TiDB Cloud Clinic
TiDB Cloud Clinic offers advanced monitoring and diagnostic capabilities on the TiDB Cloud, designed to help you quickly identify performance issues, optimize your database, and enhance overall performance with detailed analysis and actionable insights.
Prerequisites
TiDB Cloud Clinic is only available for organizations that subscribe to the Enterprise or Premium support plan.
View the Cluster page
To view the Cluster page, take the following steps:
Log in to the TiDB Cloud Clinic console and select Continue with TiDB Account to enter the TiDB Cloud login page.
From the organization list, select your target organization. The clusters in the selected project are displayed.
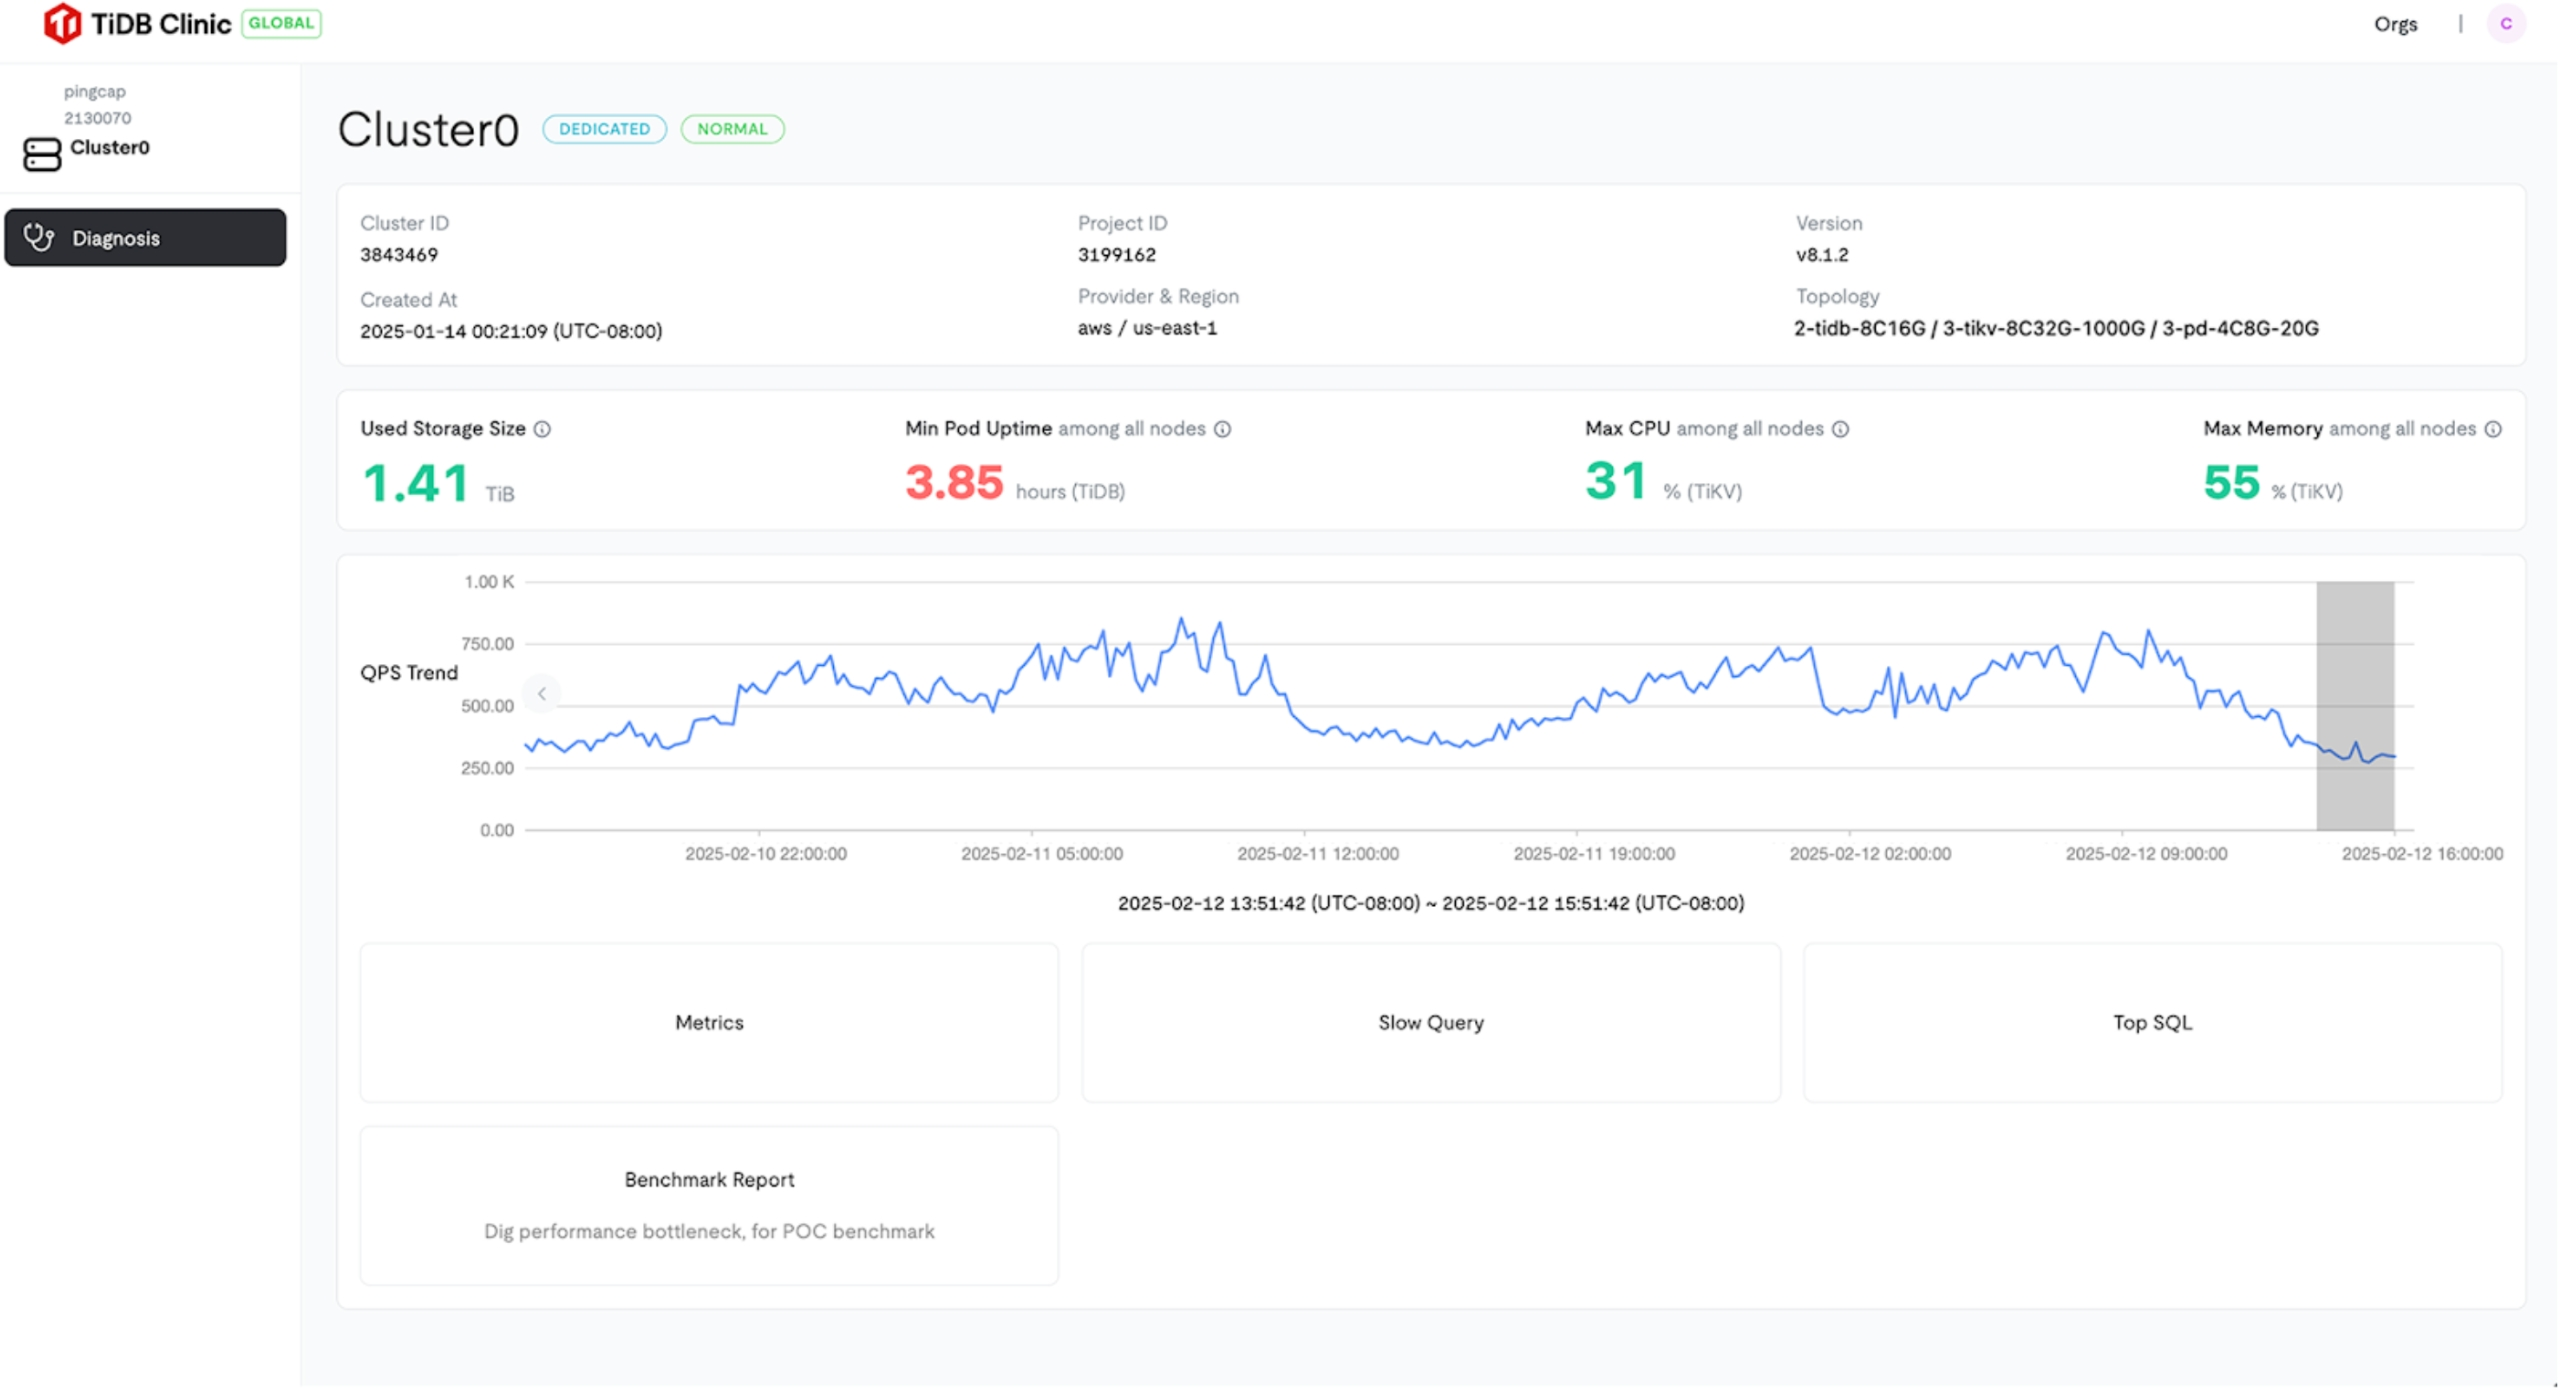
Click the name of your target TiDB Cloud Dedicated cluster. The cluster overview page is displayed, where you can view detailed information about your cluster, including:
- Advanced Metrics
- Top Slow Queries (only supported when the TiDB version of the cluster is v8.1.1 or later, v7.5.4 or later)
- Top SQL (only supported when the TiDB version of the cluster is v8.1.1 or later, v7.5.4 or later)
- Benchmark Report
Monitor advanced metrics
TiDB Cloud Clinic uses Grafana to provide a comprehensive set of metrics for TiDB clusters. The retention policy for advanced metrics is 90 days.
To view the metrics dashboard, take the following steps:
In the TiDB Cloud Clinic console, navigate to the Cluster page of a cluster.
Click Metrics.
Click the name of the dashboard you want to view. The dashboard is displayed.
The dashboards and their content are subject to change. Currently, the following dashboards are available:
- Backup & Import
- DM-Professional
- DM-Standard
- Lightning
- Performance-Overview
- TiCDC-Summary
- TiDB
- TiDB-Resource-Control
- TiFlash-Summary
- TiKV-Details
- TiProxy-Summary
- User-Node-Info
Analyze top slow queries
By default, SQL queries that take longer than 300 milliseconds are considered slow queries.
On the default Slow Queries page in the TiDB Cloud console, identifying performance-impacting queries can be difficult, especially in clusters with a large number of slow queries. The Top Slow Queries feature in TiDB Cloud Clinic provides aggregated analysis based on slow query logs. With this feature, you can easily pinpoint queries with performance issues, reducing overall performance tuning time by at least half.
Top Slow Queries displays the top 10 queries aggregated by SQL digest, sorted by the following dimensions:
- Total latency
- Maximum latency
- Average latency
- Total memory
- Maximum memory
- Average memory
- Total count
To view slow queries in a cluster, take the following steps:
In the TiDB Cloud Clinic console, navigate to the Cluster page of a cluster.
Click Slow Query.
The top slow queries are displayed in a table. You can sort the results by different columns.
(Optional) Click any slow query in the list to view its detailed execution information.
(Optional) Filter slow queries by time range, database, or statement type.
The retention policy for slow queries is 7 days.
For more information, see Slow Queries in TiDB Dashboard.
Monitor Top SQL
TiDB Cloud Clinic provides Top SQL information to help you visually analyze the most resource-intensive queries on a specific TiDB or TiKV node over a period of time. By default, Top SQL continuously collects CPU load data. For TiKV nodes, if TiKV network IO collection is enabled, you can also inspect Network Bytes and Logical IO Bytes, and analyze hotspots by Query, Table, DB, or Region. This helps you identify and troubleshoot performance issues across multiple resource dimensions, not just CPU.
To view Top SQL, take the following steps:
In the TiDB Cloud Clinic console, navigate to the Cluster page of a cluster.
Click Top SQL.
Select a specific TiDB or TiKV node to observe its workload. You can use the time picker or select a time range in the chart to refine your analysis.
Analyze the charts and tables displayed by Top SQL. Depending on the selected node and enabled metrics, you can use
Order Byand the available aggregation dimensions to inspect CPU, network, or logical I/O hotspots.
For more information, see Top SQL in TiDB Dashboard.
Generate benchmark reports
The Benchmark Report feature helps you identify performance issues in a TiDB cluster during performance testing. After completing a stress test, you can generate a benchmark report to analyze the cluster's performance. The report highlights identified bottlenecks and provides optimization suggestions. After applying these suggestions, you can run another round of stress testing and generate a new benchmark report to compare performance improvements.
To generate a benchmark report, take the following steps:
In the TiDB Cloud Clinic console, navigate to the Cluster page of a cluster.
Click Benchmark Report.
Select the time range to be analyzed in the benchmark report.
Click Create Report to generate the benchmark report.
Wait for report generation to complete. When the report is ready, click View to open it.