Dashboards
Dashboards are employed to present query results through a variety of chart types, including scorecards, pie charts, bar charts, and line charts. These charts are generated from the query results. You have the option to create a chart based on the query result after executing a query in a worksheet. Refreshing a dashboard allows you to re-execute the queries corresponding to the charts, thereby updating the charts with the latest results.
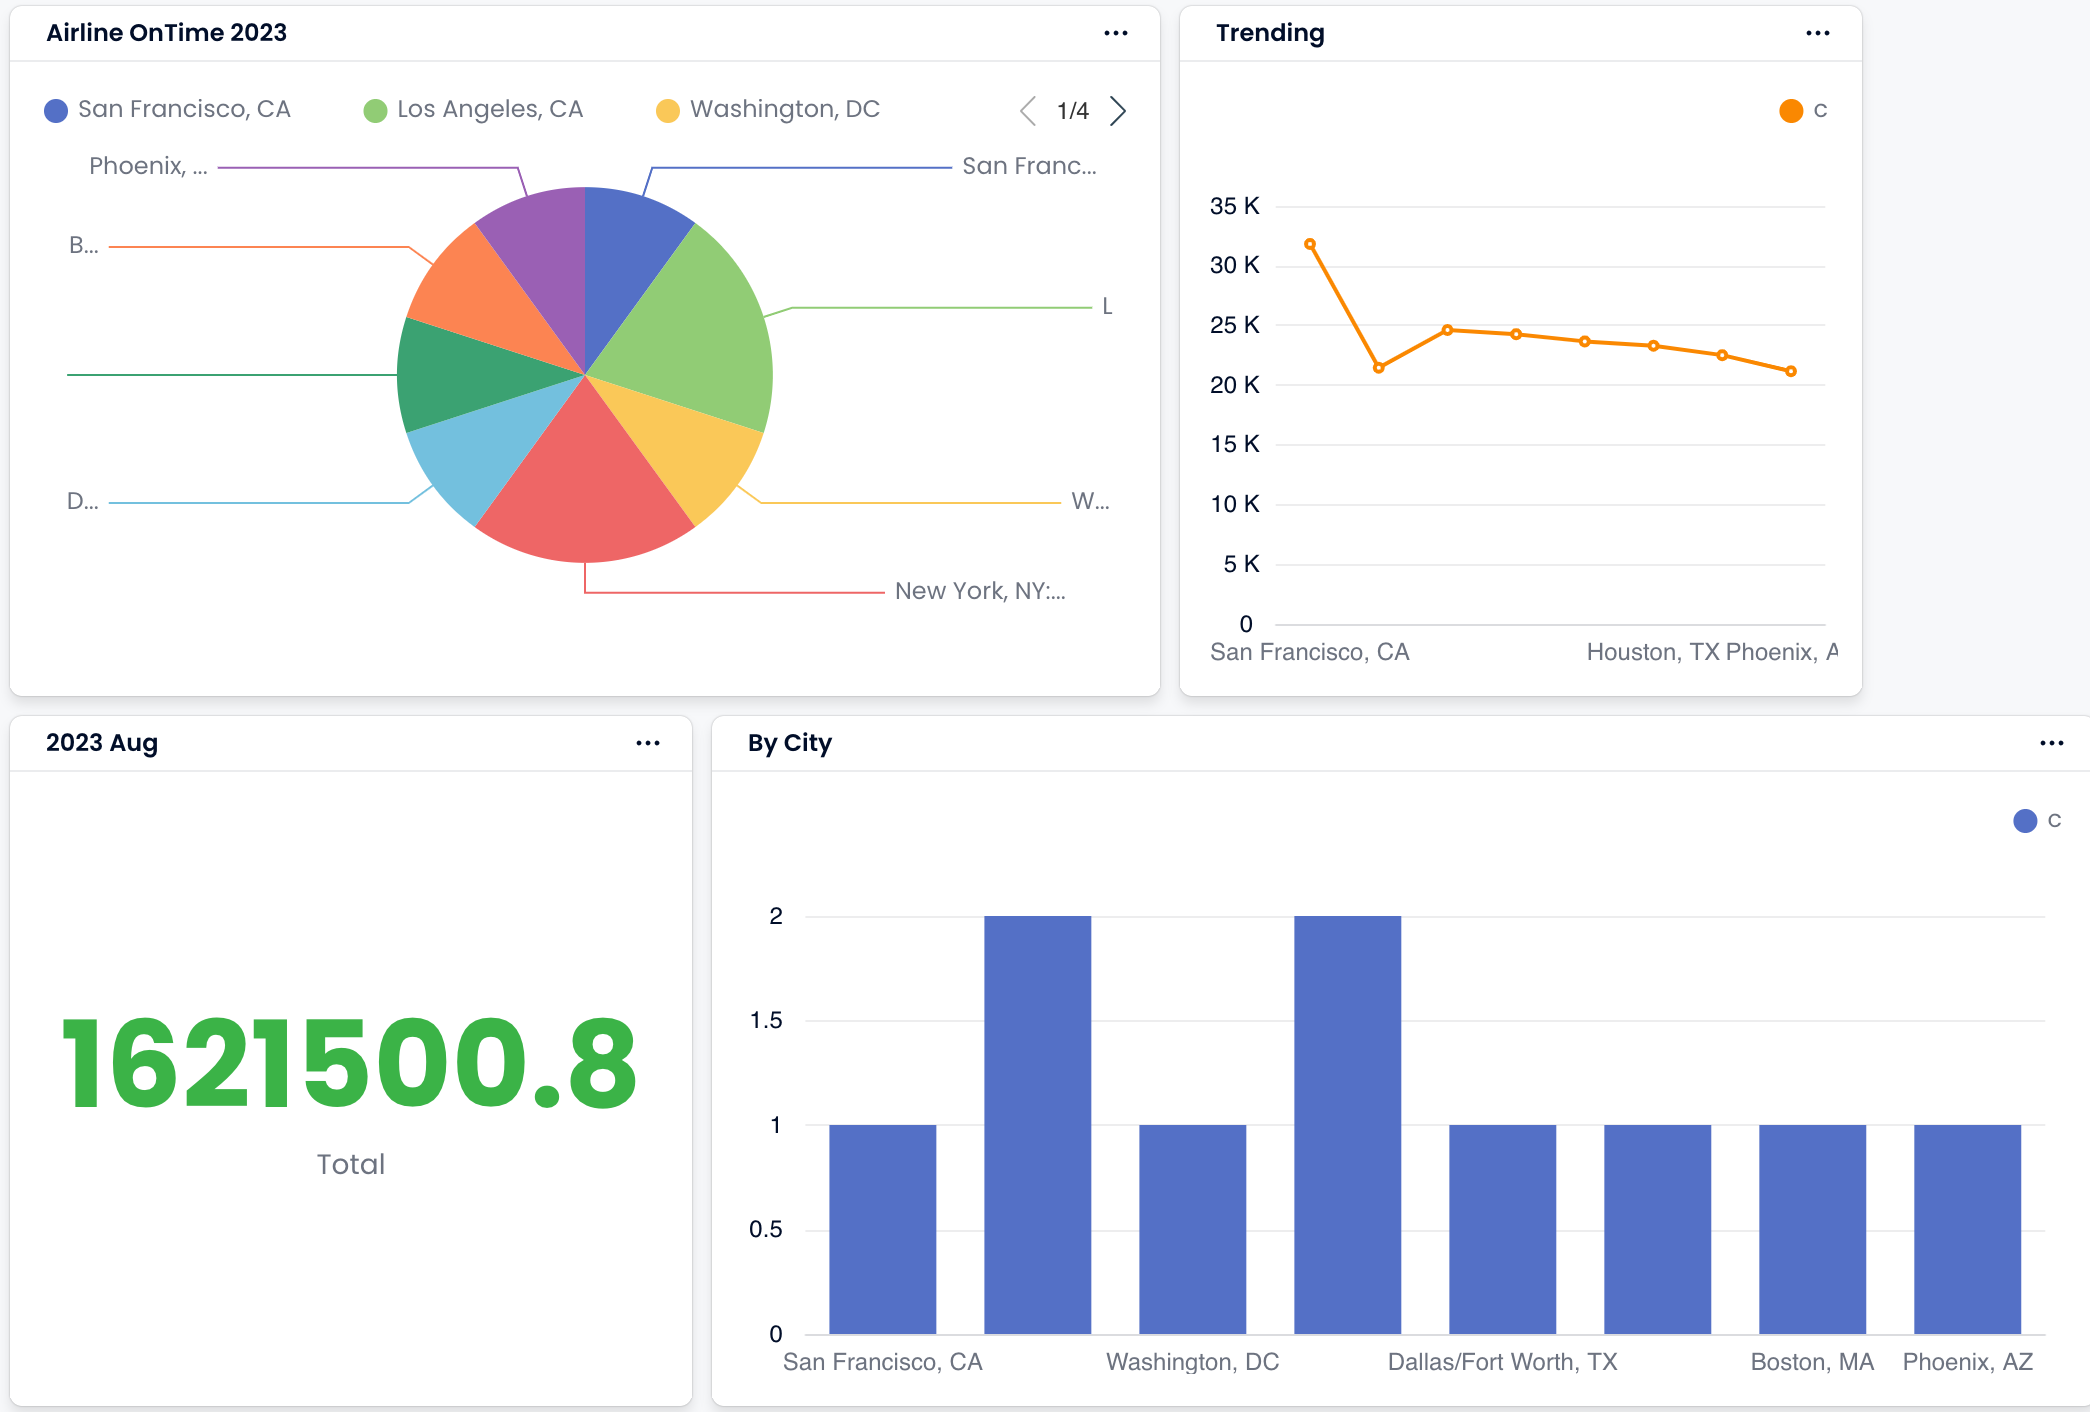
Creating a Dashboard
In TiDB Cloud Lake, you can create multiple dashboards as needed. A dashboard can contain one or multiple charts. Each individual chart corresponds to a specific query result, yet it can be integrated into multiple dashboards.
To create a dashboard:
In a worksheet, run a query for which you intend to generate a chart using the query result.
In the result area, click on the Chart tab.
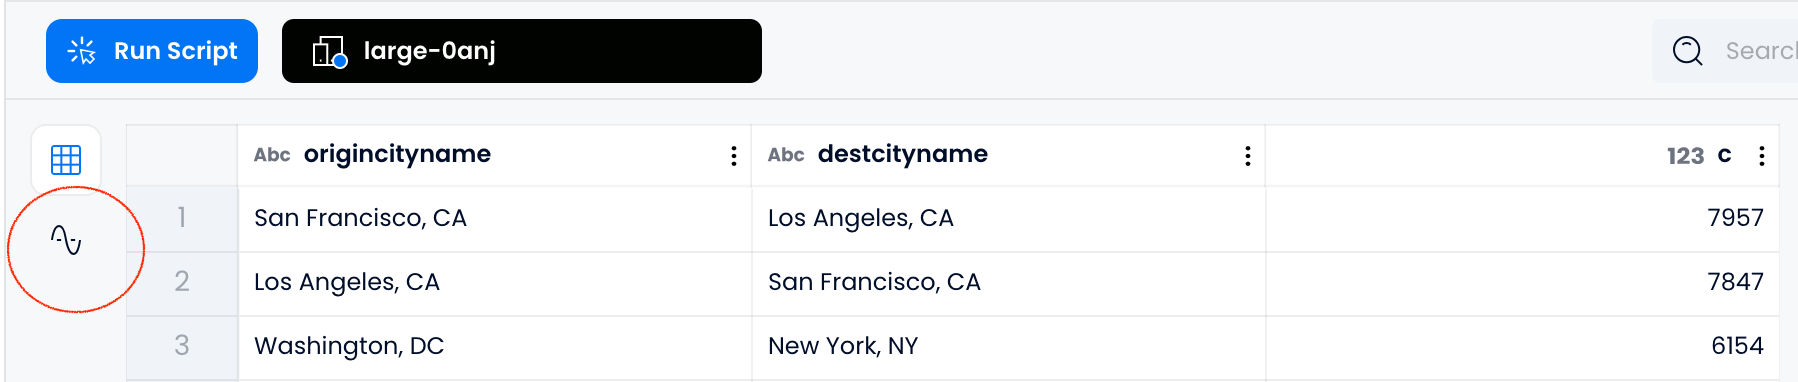
On the Chart tab, choose a chart type from the dropdown menu on the right. Next, specify the data and customize the chart's appearance using the options found on the Data and Style tabs below the dropdown list.
Please note that these aggregation functions assist in summarizing and revealing valuable patterns from the raw data in query results. The available functions for aggregation vary based on the distinct data types and the chart types you select.
Return to the TiDB Cloud Lake homepage and select Dashboards in the left navigation menu, then click New Dashboard.
In the new dashboard, click on Add Chart. Drag and drop the chart from the left pane onto the dashboard. If you have multiple charts available in the left pane, feel free to drag as many as you need.
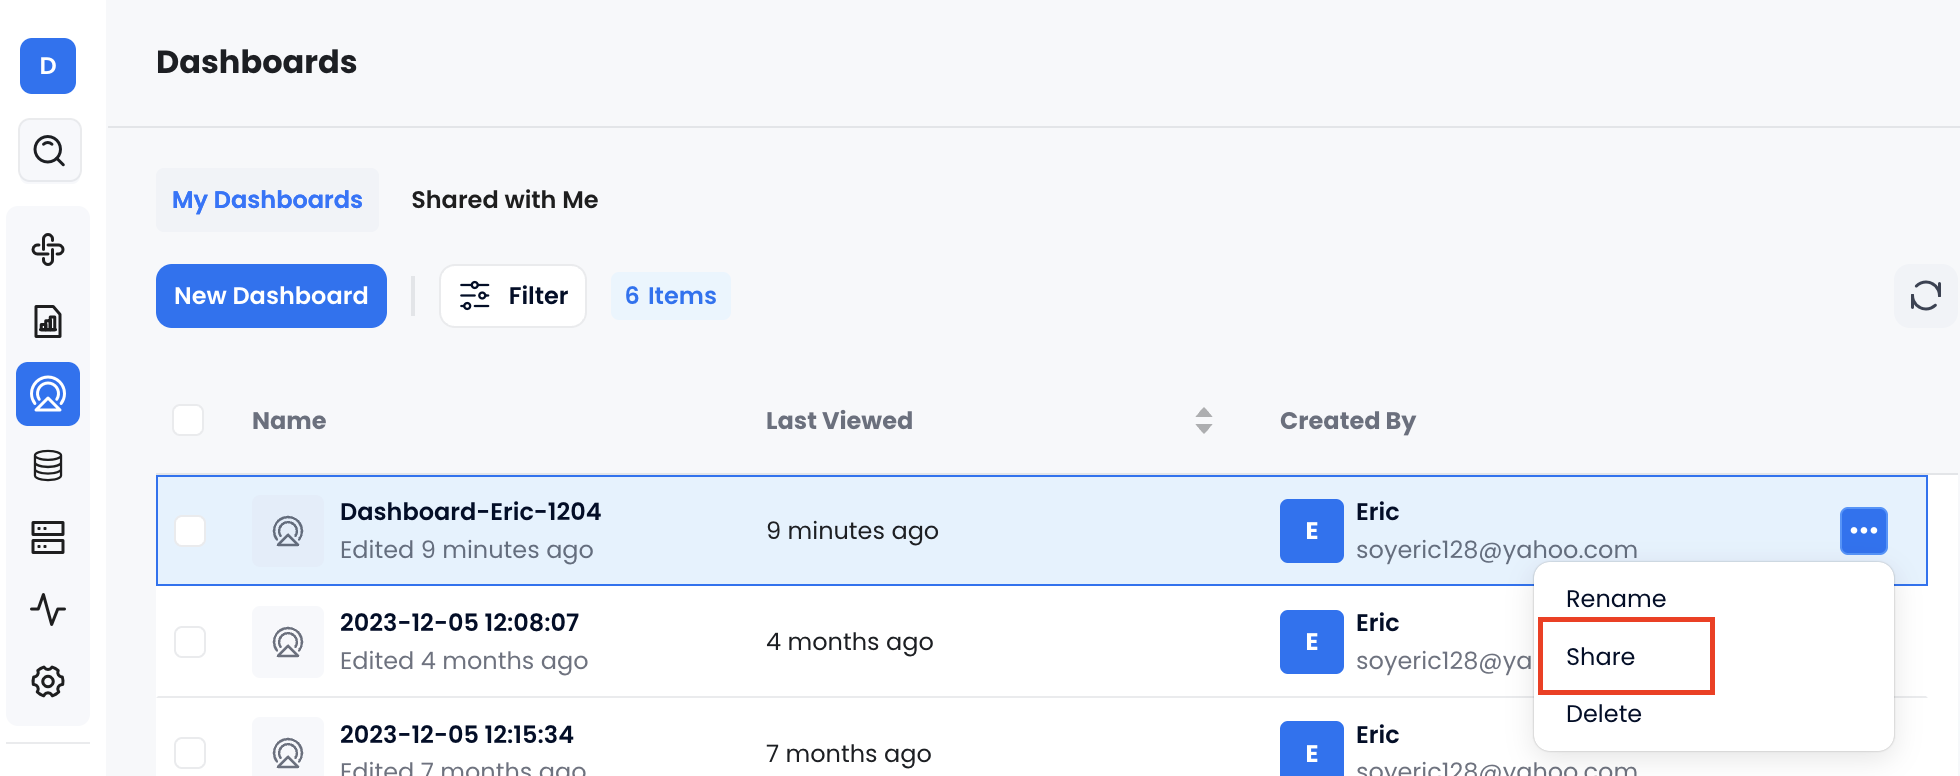
Sharing a Dashboard
You can share your dashboards with everyone in your organization or specific individuals. To do so, click the ellipse button on the dashboard you want to share, then select Share.
When sharing a dashboard, you can choose one of the following permission levels to control how others can access it:
- Read Only: View the dashboard but cannot make changes or run queries to retrieve the latest results.
- Execute: Run queries to retrieve the latest results or interact with the dashboard without modifying it.
- Edit: Modify the dashboard, including changing queries and how the dashboard reflects the results.
To view the dashboards shared with you by others, click Dashboards in the sidebar, then click the Shared with Me tab on the right.