Overview for Analyzing and Tuning Performance
This document describes steps to help you analyze and tune SQL performance in TiDB Cloud.
User response time
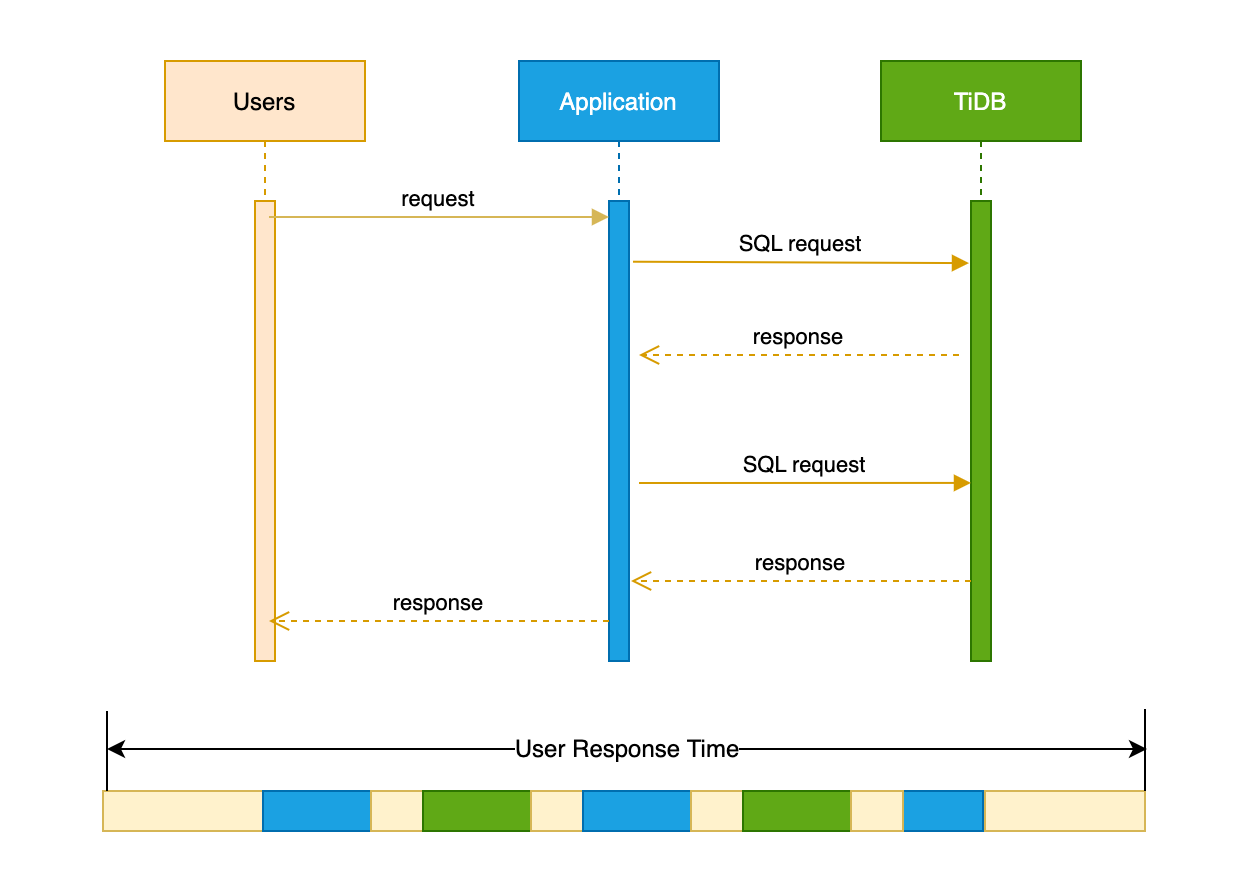
User response time indicates how long an application takes to return the results of a request to users. As you can see from the following sequential timing diagram, the time of a typical user request contains the following:
- The network latency between the user and the application
- The processing time of the application
- The network latency during the interaction between the application and the database
- The service time of the database
The user response time is affected by various subsystems on the request chain, such as network latency and bandwidth, number and request types of concurrent users, and resource usage of server CPU and I/O. To optimize the entire system effectively, you need to first identify the bottlenecks in user response time.
To get a total user response time within a specified time range (ΔT), you can use the following formula:
Total user response time in ΔT = Average TPS (Transactions Per Second) x Average user response time x ΔT.
Relationship between user response time and system throughput
User response time consists of service time, queuing time, and concurrent waiting time to complete a user request.
User Response time = Service time + Queuing delay + Coherency delay
- Service time: the time a system consumes on certain resources when processing a request, for example, the CPU time that a database consumes to complete a SQL request.
- Queuing delay: the time a system waits in a queue for service of certain resources when processing a request.
- Coherency delay: the time a system communicates and collaborates with other concurrent tasks, so that it can access shared resources when processing a request.
System throughput indicates the number of requests that can be completed by a system per second. User response time and throughput are usually inverse of each other. When the throughput increases, the system resource utilization and the queuing latency for a requested service increase accordingly. Once resource utilization exceeds a certain inflection point, the queuing latency will increase dramatically.
For example, for a database system running OLTP loads, after its CPU utilization exceeds 65%, the CPU queueing scheduling latency increases significantly. This is because concurrent requests of a system are not completely independent, which means that these requests can collaborate and compete for shared resources. For example, requests from different users might perform mutually exclusive locking operations on the same data. When the resource utilization increases, the queuing and scheduling latency increases too, which causes that the shared resources cannot be released in time and in turn prolongs the waiting time for shared resources by other tasks.
Troubleshoot bottlenecks in user response time
There are several pages in the TiDB Cloud console that help you troubleshoot user response time.
- SQL Statement enables you to directly observe SQL execution on the page, and easily locate performance problems without querying the system tables. You can click a SQL statement to further view the execution plan of the query for troubleshooting and analysis. For more information about SQL performance tuning, see SQL Tuning Overview.
- Key Visualizer helps you observe TiDB's data access patterns and data hotspots.
Metrics: on this page, you can view metrics such as request units, used storage size, query per second, and average query duration.
To request additional metrics, contact TiDB Cloud Support.
If you experience latency and performance issues, refer to the steps in the following sections for analysis and troubleshooting.
Bottlenecks outside the TiDB cluster
Observe Latency(P80) on the Overview tab. If this value is much lower than the P80 value for user response time, you can determine that the main bottleneck might be outside the TiDB cluster. In this case, you can use the following steps to troubleshoot the bottleneck.
Check the TiDB version on the left side of the Overview tab. If it is v6.0.0 or earlier versions, it is recommended to contact the PingCAP support team to confirm if the Prepared plan cache, Raft-engine and TiKV AsyncIO features can be enabled. Enabling these features, along with application-side tuning, can significantly improve throughput performance and reduce latency and resource utilization.
If necessary, you can increase the TiDB token limit to increase the throughput.
If the prepared plan cache feature is enabled, and you use JDBC on the user side, it is recommended to use the following configuration:
useServerPrepStmts=true&cachePrepStmts=true& prepStmtCacheSize=1000&prepStmtCacheSqlLimit=20480&useConfigs=maxPerformanceIf you do not use JDBC and want to take full advantage of the prepared plan cache feature of the current TiDB cluster, you need to cache the prepared statement objects on the client side. You do not need to reset the calls to StmtPrepare and StmtClose. Reduce the number of commands to be called for each query from 3 to 1. It requires some development effort, depending on your performance requirements and the amount of client-side changes. You can consult the PingCAP support team for help.
Bottlenecks in the TiDB cluster
If you determine that the performance bottleneck is within a TiDB cluster, it is recommended that you do the following:
- Optimize slow SQL queries.
- Resolve hotspot issues.
- Scale out the cluster to expand the capacity.
Optimize slow SQL queries
For more information about SQL performance tuning, see SQL Tuning Overview.
Resolve hotstpot issues
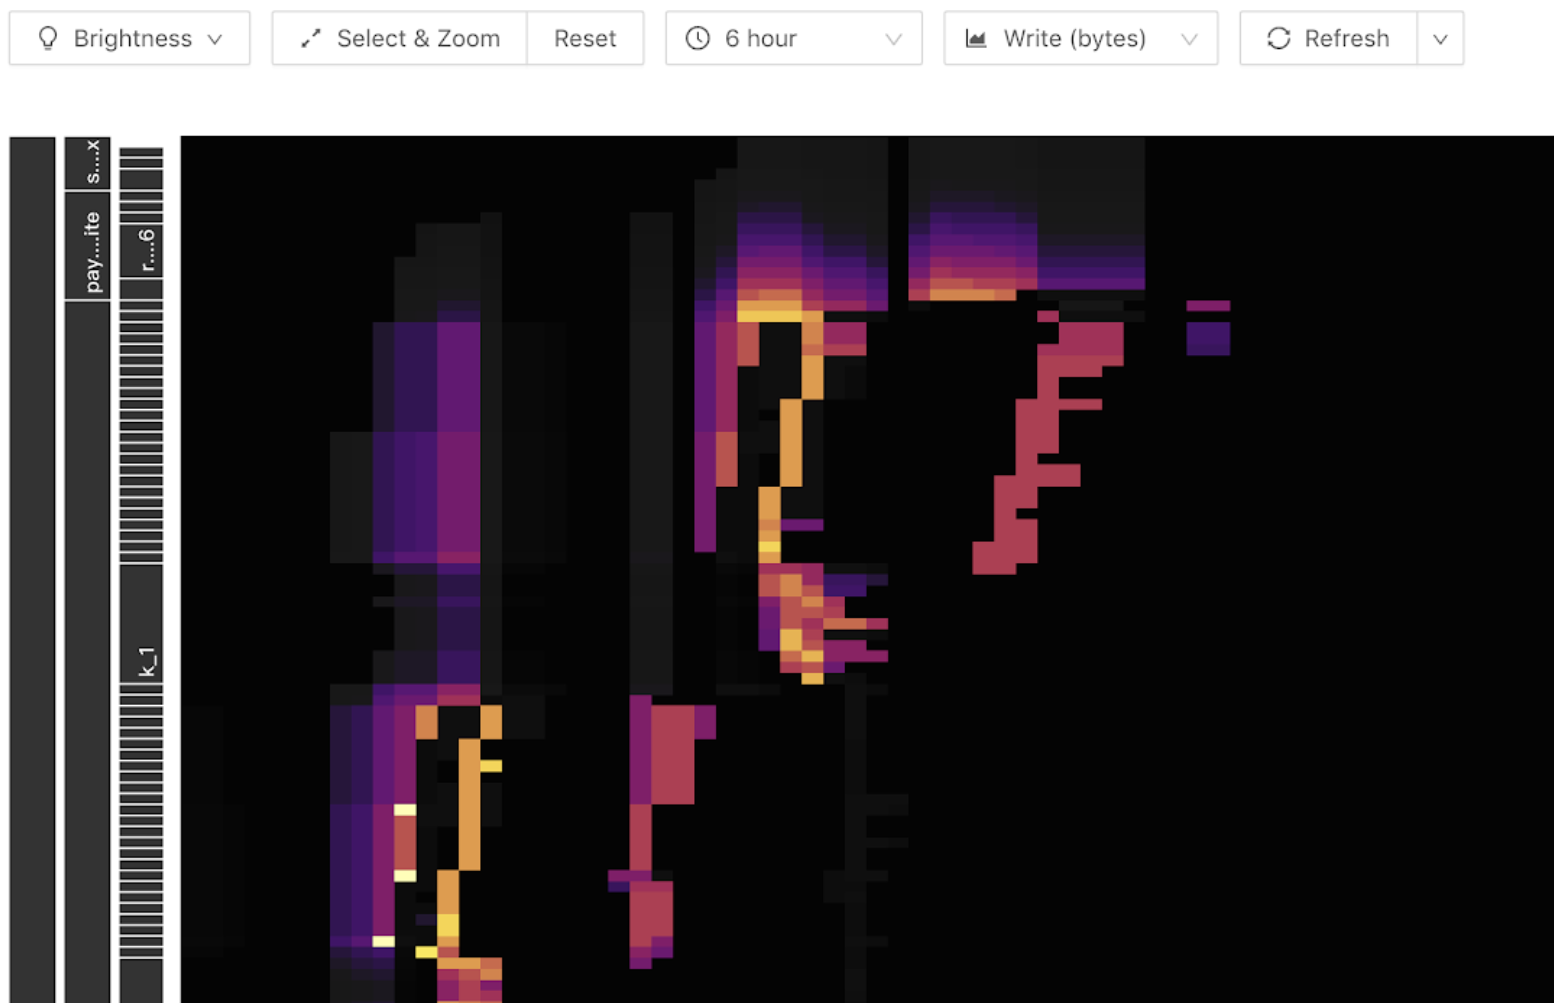
You can view hotspot issues on the Key Visualizer tab. The following screenshot shows a sample heat map. The horizontal coordinate of the map is the time, and the vertical coordinate is the table and index. Brighter color indicates higher traffic. You can toggle the display of read or write traffic in the toolbar.
The following screenshot shows an example of a write hotspot. A bright diagonal line (diagonal up or diagonal down) appears in the write flow graph, and the write traffic appears only at the end of the line. It becomes a stepped pattern as the number of table Regions grows. It indicates that there is a write hotspot in the table. When a write hotspot occurs, you need to check whether you are using a self-incrementing primary key, or no primary key, or using a time-dependent insert statement or index.

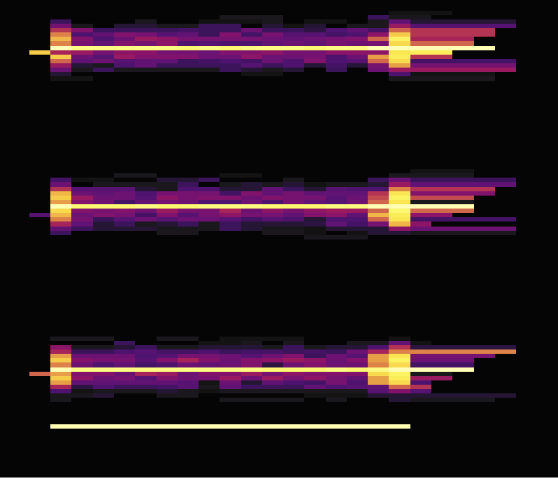
A read hotspot is generally represented in the heat map as a bright horizontal line, usually a small table with a large number of queries, as shown in the following screenshot.
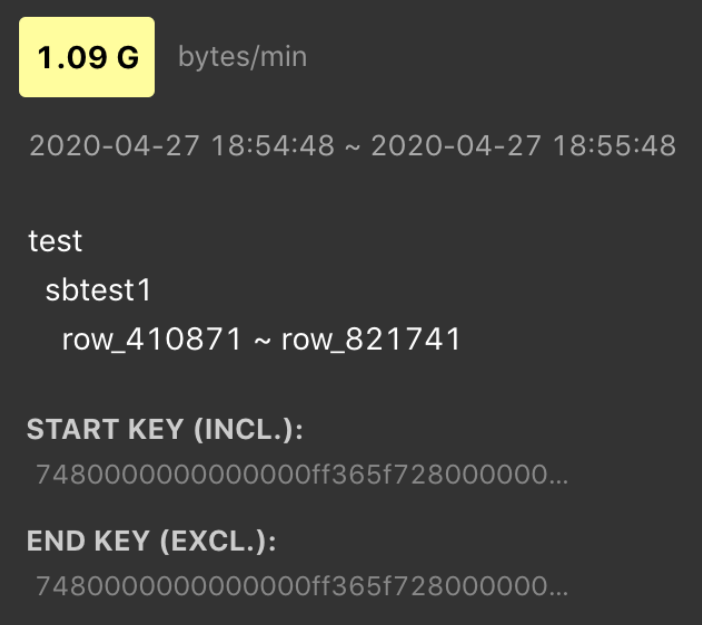
Hover over the highlighted block to see which table or index has high traffic, as shown in the following screenshot.
Scale out
On the cluster Overview page, check the storage space, CPU utilization, and TiKV IO rate metrics. If any of them are reaching the upper limit for a long time, it is possible that the current cluster size cannot meet the business requirements. It is recommended to contact the PingCAP support team to confirm if you need to scale out the cluster.
Other issues
If the previous methods cannot resolve the performance issue, you can contact the PingCAP support team for help. It is recommended to provide the following information to speed up the troubleshooting process.
- The cluster ID
- The issue interval and a comparable normal interval
- The problem phenomenon and expected behavior
- The business workload characteristics, such as read or write ratios and primary behavior
Summary
In general, you can use the following optimization methods to analyze and resolve performance issues.
In the future, TiDB Cloud will introduce more observable metrics and self-diagnostic services. They will provide you with a more comprehensive understanding of performance metrics and operational advice to improve your experience.