Overview 面板重要监控指标详解
使用 TiDB Ansible 部署 TiDB 集群时,一键部署监控系统 (Prometheus/Grafana),监控架构请看 TiDB 监控框架概述。
目前 Grafana Dashboard 整体分为 PD、TiDB、TiKV、Node_exporter、Overview 等。
对于日常运维,我们单独挑选出重要的 Metrics 放在 Overview 页面,方便日常运维人员观察集群组件 (PD, TiDB, TiKV) 使用状态以及集群使用状态。
以下为 Overview Dashboard 监控说明:
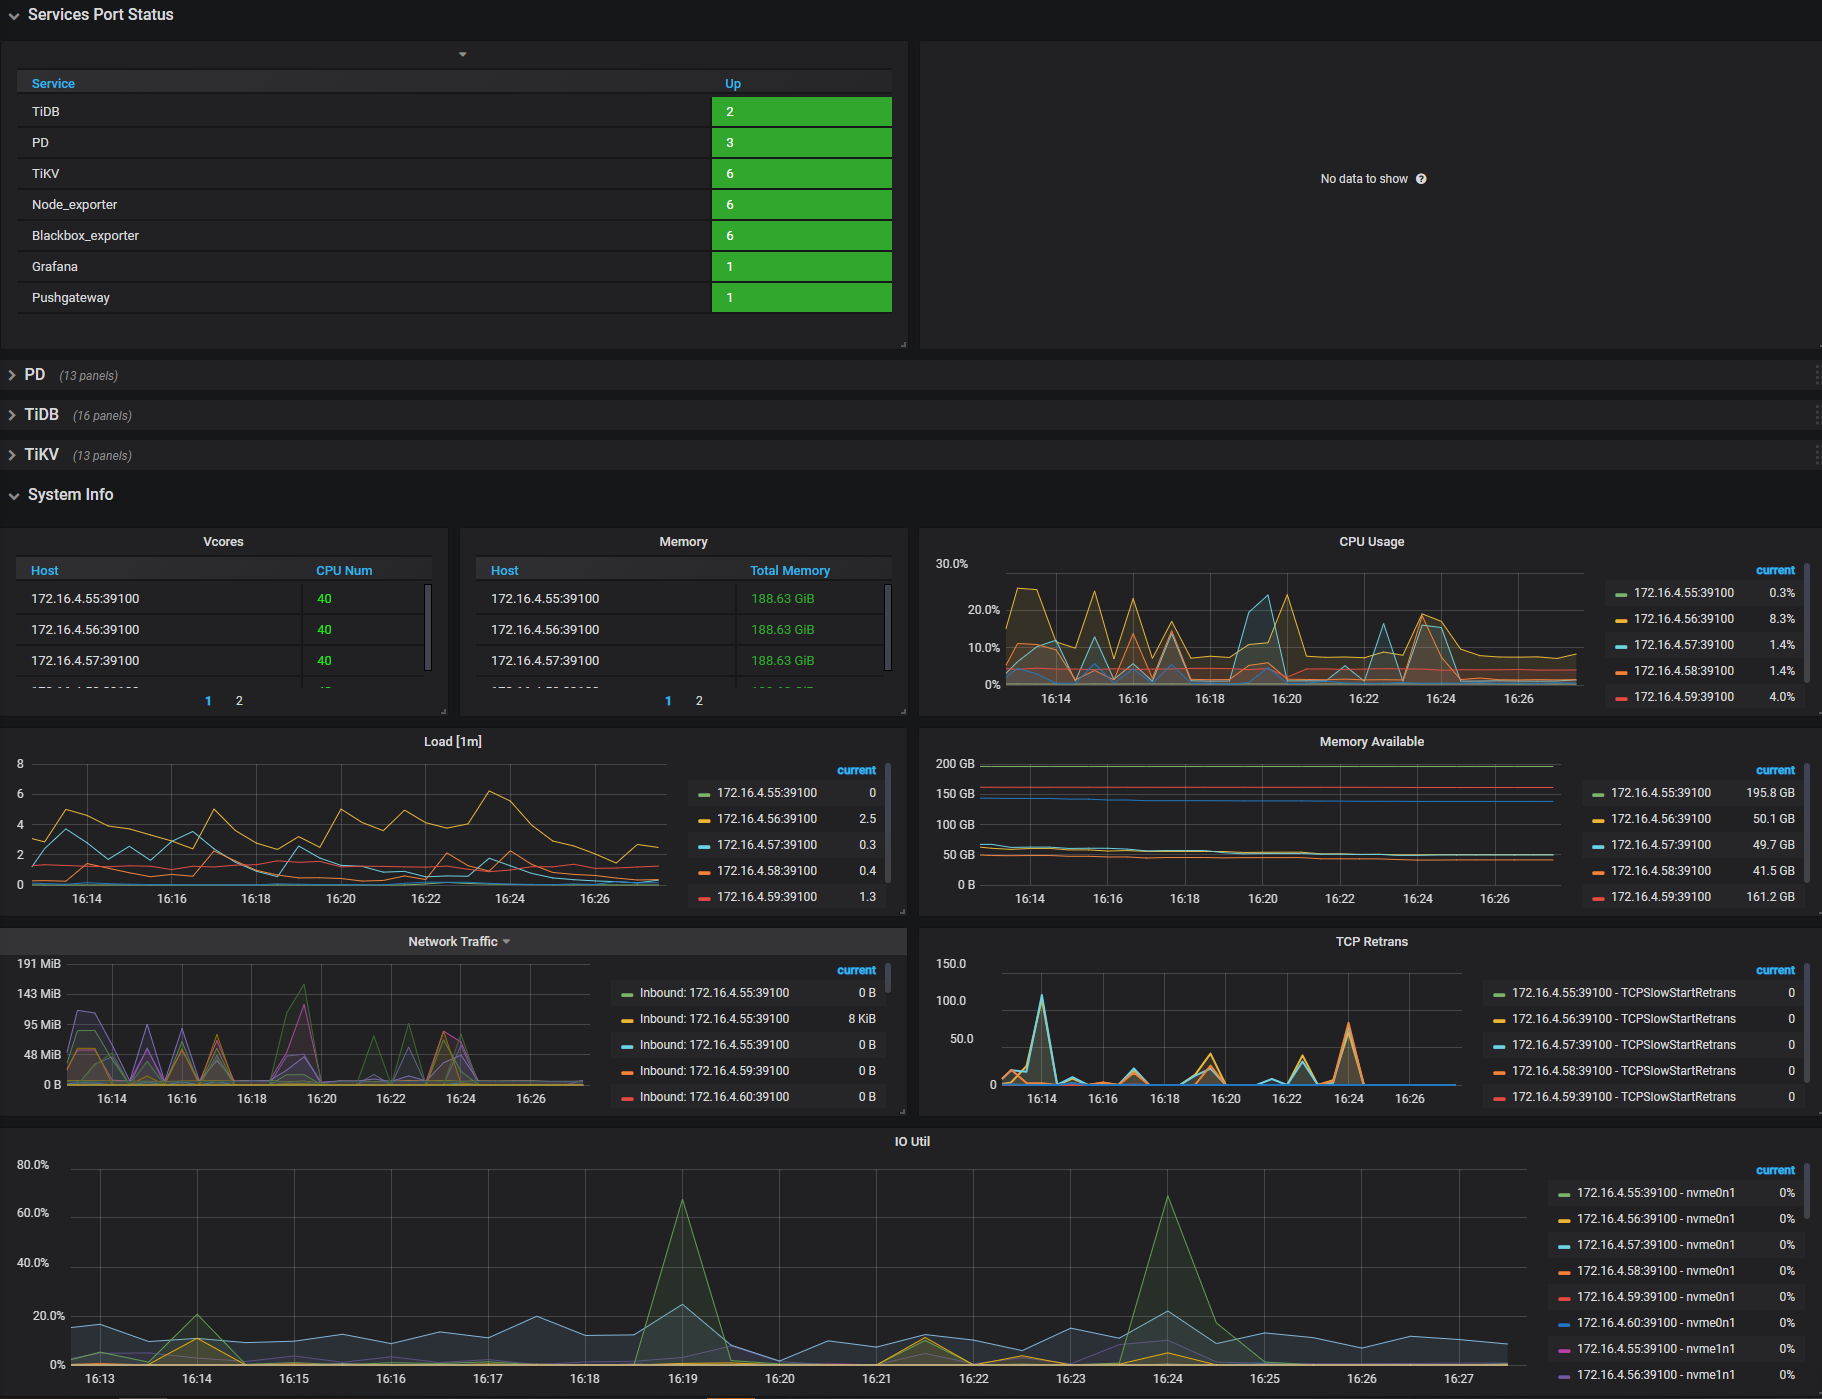
Services Port Status
- Services Online:各服务在线节点数量
- Services Offline:各服务 Down 掉节点数量
PD
- Storage Capacity:TiDB 集群总可用数据库空间大小
- Current Storage Size:TiDB 集群目前已用数据库空间大小
- Number of Regions:当前集群的 Region 总量
- Leader Balance Ratio:Leader 数量最多和最少节点相差的百分比,一般小于 5%,节点重启时会有比较大的波动
- Region Balance Ratio:Region 数量最多和最少节点相差的百分比,一般小于 5%,新增/下线节点时相差比较大
- Store Status:集群 TiKV 节点的状态
- Up Stores:正常运行的 TiKV 节点数量
- Disconnect Stores:短时间内通信异常的 TiKV 节点数量
- LowSpace Stores:剩余可用空间小于 20% 的 TiKV 节点数量
- Down Stores:停止工作的 TiKV 节点数量,如果大于 0,说明有节点不正常
- Offline Stores:正在下线的 TiKV 节点数量(正在下线的 TiKV 节点还在提供服务)
- Tombstone Stores:下线成功的 TiKV 节点数量
- 99% completed_cmds_duration_seconds:单位时间内,99% 的 pd-server 请求执行时间小于监控曲线的值,一般 <= 5ms
- handle_requests_duration_seconds:PD 发送请求的网络耗时
- Region health:每个 Region 的状态,通常情况下,pending 的 peer 应该少于 100,miss 的 peer 不能一直大于
0 - Hot write Region's leader distribution:每个 TiKV 实例上是写入热点的 leader 的数量
- Hot read Region's leader distribution:每个 TiKV 实例上是读取热点的 leader 的数量
- Region heartbeat report:TiKV 向 PD 发送的心跳个数
- 99% Region heartbeat latency:99% 的情况下,心跳的延迟
TiDB
- Statement OPS:SQL 执行数量统计(包含 select、insert、update 等)
- Duration:SQL 执行的时间
- QPS By Instance:每个 TiDB 上的 QPS
- Failed Query OPM:失败 SQL 的统计,例如语法错误、主键冲突等
- Connection count:每个 TiDB 的连接数
- Heap Memory Usage:每个 TiDB 使用的堆内存大小
- Transaction OPS:事务执行数量统计
- Transaction Duration:事务执行的时间
- KV Cmd OPS:KV 命令执行数量统计
- KV Cmd Duration 99:KV 命令执行的时间
- PD TSO OPS:TiDB 从 PD 获取 TSO 的数量
- PD TSO Wait Duration:TiDB 从 PD 获取 TS 的时间
- TiClient Region Error OPS:TiKV 返回 Region 相关错误信息的数量
- Lock Resolve OPS:事务冲突相关的数量
- Load Schema Duration:TiDB 从 TiKV 获取 Schema 的时间
- KV Backoff OPS:TiKV 返回错误信息的数量(事务冲突等)
TiKV
- leader:各个 TiKV 节点上 Leader 的数量分布
- region:各个 TiKV 节点上 Region 的数量分布
- CPU:各个 TiKV 节点的 CPU 使用率
- Memory:各个 TiKV 节点的内存使用量
- store size:各个 TiKV 节点存储的数据量
- cf size:集群不同 CF 存储的数据量
- channel full:正常情况显示 No data,如果有了监控值,说明对应 TiKV 节点的消息处理不过来了
- server report failures:正常情况显示 No data,如果出现了 Unreachable,说明 TiKV 之间通信有问题
- scheduler pending commands:写入堆积的数量,偶尔出现峰值属于正常现象
- coprocessor pending requests:正常情况监控为 0 或者数量很少
- coprocessor executor count:不同类型的查询操作数量
- coprocessor request duration:TiKV 中查询消耗的时间
- raft store CPU:raftstore 线程的 CPU 使用率,线程数量默认为 2 (通过
raftstore.store-pool-size配置)。如果单个线程使用率超过 80%,说明使用率很高 - Coprocessor CPU:TiKV 查询线程的 CPU 使用率,和业务相关,复杂查询会使用大量的 CPU 资源
System Info
- Vcores:CPU 核心数量
- Memory:内存总大小
- CPU Usage:CPU 使用率,最大为 100%
- Load [1m]:1 分钟的负载情况
- Memory Available:剩余内存大小
- Network Traffic:网卡流量统计
- TCP Retrans:网络监控,TCP 相关信息统计
- IO Util:磁盘使用率,最高为 100%,一般到 80% - 90% 就需要考虑加节点
图例