SQL Non-Prepared Execution Plan Cache
TiDB supports execution plan caching for some non-PREPARE statements, similar to the Prepare/Execute statements. This feature allows these statements to skip the optimization phase and improve performance.
Principle
The non-prepared plan cache is a session-level feature that is independent of the prepared plan cache, and the cached plans do not affect each other. The basic principle of the non-prepared plan cache is as follows:
- After you enable the non-prepared plan cache, TiDB first parameterizes the query based on the abstract syntax tree (AST). For example,
SELECT * FROM t WHERE b < 10 AND a = 1is parameterized asSELECT * FROM t WHERE b < ? and a = ?. - Then, TiDB uses the parameterized query to search the non-prepared plan cache.
- If a reusable plan is found, it is directly used and the optimization phase is skipped.
- Otherwise, the optimizer generates a new plan and adds it back into the cache for reuse in the subsequent query.
Usage
To enable or disable the non-prepared plan cache, you can set the tidb_enable_non_prepared_plan_cache system variable. You can also control the size of the non-prepared plan cache using the tidb_non_prepared_plan_cache_size system variable. When the number of cached plans exceeds tidb_non_prepared_plan_cache_size, TiDB evicts plans using the least recently used (LRU) strategy.
Example
The following example shows how to use the non-prepared plan cache:
Create a table
tfor testing:CREATE TABLE t (a INT, b INT, KEY(b));Enable the non-prepared plan cache:
SET tidb_enable_non_prepared_plan_cache = true;Execute the following two queries:
SELECT * FROM t WHERE b < 10 AND a = 1;
SELECT * FROM t WHERE b < 5 AND a = 2;
Check whether the second query hits the cache:
SELECT @@last_plan_from_cache;If the value of
last_plan_from_cachein the output is1, it means that the execution plan of the second query comes from the cache:+------------------------+ | @@last_plan_from_cache | +------------------------+ | 1 | +------------------------+ 1 row in set (0.00 sec)
Restrictions
TiDB only caches one plan for a parameterized query. For example, the queries SELECT * FROM t WHERE a < 1 and SELECT * FROM t WHERE a < 100000 share the same parameterized form, SELECT * FROM t WHERE a < ?, and thus share the same plan.
If this causes performance issues, you can use the ignore_plan_cache() hint to ignore plans in the cache, so that the optimizer generates a new execution plan for the SQL every time. If the SQL cannot be modified, you can create a binding to solve the problem. For example, CREATE BINDING FOR SELECT ... USING SELECT /*+ ignore_plan_cache() */ ....
Due to the preceding risks and the fact that the execution plan cache only provides significant benefits for simple queries (if a query is complex and takes a long time to execute, using the execution plan cache might not be very helpful), TiDB has strict restrictions on the scope of non-prepared plan cache. The restrictions are as follows:
- Queries or plans that are not supported by the Prepared plan cache are also not supported by the non-prepared plan cache.
- Currently, only point get or range queries on a single table that contain
Scan,Selection, orProjectionoperators are supported, such asSELECT * FROM t WHERE a < 10 AND b in (1, 2). - Queries that contain complex operators such as
Agg,Limit,Window, orSortare not supported. - Queries that contain non-range query conditions are not supported, such as:
LIKEis not supported, such asc LIKE 'c%'.+operation is not supported, such asa+1 < 2.
- Queries that filter on columns of
JSON,ENUM,SET, orBITtype are not supported, such asSELECT * FROM t WHERE json_col = '{}'. - Queries that filter on
NULLvalues are not supported, such asSELECT * FROM t WHERE a is NULL. - Queries with more than 50 parameters after parameterization are not supported, such as
SELECT * FROM t WHERE a in (1, 2, 3, ... 51). - Queries that access partitioned tables, virtual columns, temporary tables, views, or memory tables are not supported, such as
SELECT * FROM INFORMATION_SCHEMA.COLUMNS, whereCOLUMNSis a TiDB memory table. - Queries with hints, subqueries, or locks are not supported.
- DML statements are not supported.
Diagnostics
After enabling the non-prepared plan cache, you can execute the EXPLAIN FORMAT='plan_cache' SELECT ... statement to verify whether the query can hit the cache. For queries that cannot hit the cache, the system returns the reason in a warning.
Note that if you do not add FORMAT='plan_cache', the EXPLAIN statement will never hit the cache.
To verify whether the query hits the cache, execute the following EXPLAIN FORMAT='plan_cache' statement:
EXPLAIN FORMAT='plan_cache' SELECT * FROM t WHERE a+2 < 10;
The output is as follows:
3 rows in set, 1 warning (0.00 sec)
To view the queries that cannot hit the cache, execute SHOW warnings;:
SHOW warnings;
The output is as follows:
+---------+------+-----------------------------------------------------------------------+
| Level   | Code | Message                                                               |
+---------+------+-----------------------------------------------------------------------+
| Warning | 1105 | skip non-prep plan cache: query has some unsupported binary operation |
+---------+------+-----------------------------------------------------------------------+
1 row in set (0.00 sec)
In the preceding example, the query cannot hit the cache because the non-prepared plan cache does not support the + operation.
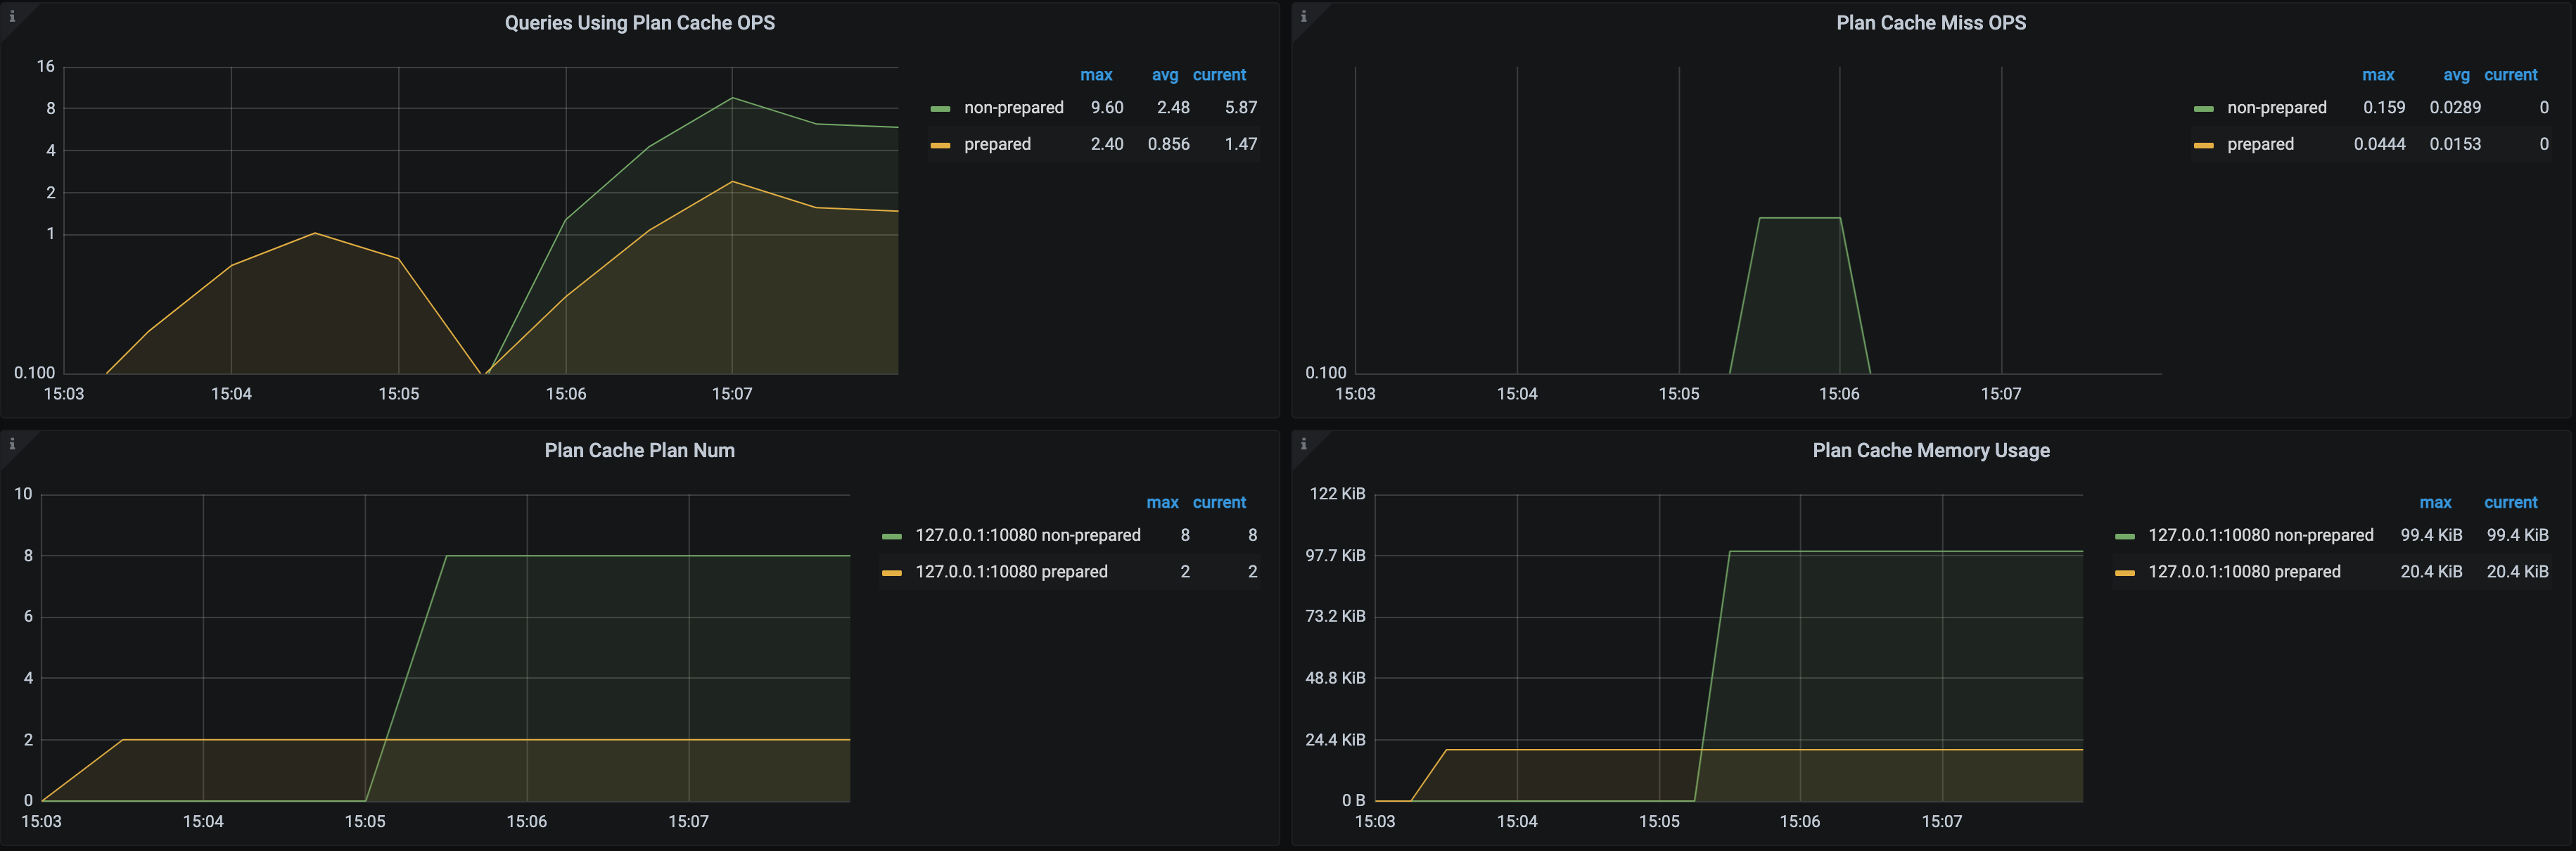
Monitoring
After enabling the non-prepared plan cache, you can monitor the memory usage, number of plans in the cache, and cache hit rate in the following panes:
You can also monitor the cache hit rate in the statements_summary table and slow query log. The following shows how to view the cache hit rate in the statements_summary table:
Create a table
t:CREATE TABLE t (a int);Enable the non-prepared plan cache:
SET @@tidb_enable_non_prepared_plan_cache=1;Execute the following three queries:
SELECT * FROM t WHERE a<1;
SELECT * FROM t WHERE a<2;
SELECT * FROM t WHERE a<3;
Query the
statements_summarytable to view the cache hit rate:SELECT digest_text, query_sample_text, exec_count, plan_in_cache, plan_cache_hits FROM INFORMATION_SCHEMA.STATEMENTS_SUMMARY WHERE digest_text LIKE '%SELECT * FROM %';The output is as follows:
+---------------------------------+------------------------------------------+------------+---------------+-----------------+
| digest_text                     | query_sample_text                        | exec_count | plan_in_cache | plan_cache_hits |
+---------------------------------+------------------------------------------+------------+---------------+-----------------+
| SELECT * FROM `t` WHERE `a` < ? | SELECT * FROM t WHERE a<1 [arguments: 1] |          3 |             1 |               2 |
+---------------------------------+------------------------------------------+------------+---------------+-----------------+
1 row in set (0.01 sec)
From the output, you can see that the query was executed three times and hit the cache twice.