SQL Non-Prepared Execution Plan Cache
TiDB supports execution plan caching for some non-PREPARE statements, similar to the Prepare/Execute statements. This feature allows these statements to skip the optimization phase and improve performance.
Enabling the non-prepared plan cache might incur additional memory and CPU overhead and might not be suitable for all situations. To determine whether to enable this feature in your scenario, refer to the Performance benefits and Memory monitoring sections.
Principle
The non-prepared plan cache is a session-level feature that shares a cache with the prepared plan cache. The basic principle of the non-prepared plan cache is as follows:
- After you enable the non-prepared plan cache, TiDB first parameterizes the query based on the abstract syntax tree (AST). For example,
SELECT * FROM t WHERE b < 10 AND a = 1is parameterized asSELECT * FROM t WHERE b < ? and a = ?. - Then, TiDB uses the parameterized query to search the plan cache.
- If a reusable plan is found, it is directly used and the optimization phase is skipped.
- Otherwise, the optimizer generates a new plan and adds it back into the cache for reuse in the subsequent query.
Usage
To enable or disable the non-prepared plan cache, you can set the tidb_enable_non_prepared_plan_cache system variable. You can also control the size of the non-prepared plan cache using the tidb_session_plan_cache_size system variable. When the number of cached plans exceeds tidb_session_plan_cache_size, TiDB evicts plans using the least recently used (LRU) strategy.
Starting from v7.1.0, you can control the maximum size of a plan that can be cached using the system variable tidb_plan_cache_max_plan_size. The default value is 2 MB. If the size of a plan exceeds this value, the plan will not be cached.
Example
The following example shows how to use the non-prepared plan cache:
Create a table
tfor testing:CREATE TABLE t (a INT, b INT, KEY(b));Enable the non-prepared plan cache:
SET tidb_enable_non_prepared_plan_cache = ON;Execute the following two queries:
SELECT * FROM t WHERE b < 10 AND a = 1;
SELECT * FROM t WHERE b < 5 AND a = 2;
Check whether the second query hits the cache:
SELECT @@last_plan_from_cache;If the value of
last_plan_from_cachein the output is1, it means that the execution plan of the second query comes from the cache:+------------------------+ | @@last_plan_from_cache | +------------------------+ | 1 | +------------------------+ 1 row in set (0.00 sec)
Restrictions
Cache suboptimal plans
TiDB only caches one plan for a parameterized query. For example, the queries SELECT * FROM t WHERE a < 1 and SELECT * FROM t WHERE a < 100000 share the same parameterized form, SELECT * FROM t WHERE a < ?, and thus share the same plan.
If this causes performance issues, you can use the ignore_plan_cache() hint to ignore plans in the cache, so that the optimizer generates a new execution plan for the SQL every time. If the SQL cannot be modified, you can create a binding to solve the problem. For example, CREATE BINDING FOR SELECT ... USING SELECT /*+ ignore_plan_cache() */ ....
Usage restrictions
Due to the preceding risks and the fact that the execution plan cache only provides significant benefits for simple queries (if a query is complex and takes a long time to execute, using the execution plan cache might not be very helpful), TiDB has strict restrictions on the scope of non-prepared plan cache. The restrictions are as follows:
- Queries or plans that are not supported by the Prepared plan cache are also not supported by the non-prepared plan cache.
- Queries that contain complex operators such as
WindoworHavingare not supported. - Queries that contain three or more
Jointables or subqueries are not supported. - Queries that contain numbers or expressions directly after
ORDER BYorGROUP BYare not supported, such asORDER BY 1andGROUP BY a+1. OnlyORDER BY column_nameandGROUP BY column_nameare supported. - Queries that filter on columns of
JSON,ENUM,SET, orBITtype are not supported, such asSELECT * FROM t WHERE json_col = '{}'. - Queries that filter on
NULLvalues are not supported, such asSELECT * FROM t WHERE a is NULL. - Queries with more than 200 parameters after parameterization are not supported by default, such as
SELECT * FROM t WHERE a in (1, 2, 3, ... 201). Starting from v7.3.0, you can modify this limit by setting the44823fix in thetidb_opt_fix_controlsystem variable. - Queries that access virtual columns, temporary tables, views, or memory tables are not supported, such as
SELECT * FROM INFORMATION_SCHEMA.COLUMNS, whereCOLUMNSis a TiDB memory table. - Queries with hints or bindings are not supported.
- DML statements or
SELECTstatements with theFOR UPDATEclause are not supported by default. To remove this restriction, you can executeSET tidb_enable_non_prepared_plan_cache_for_dml = ON.
After you enable this feature, the optimizer quickly evaluates the query. If it does not meet the support conditions for non-prepared plan cache, the query falls back to the regular optimization process.
Performance benefits
In internal tests, enabling the non-prepared plan cache feature can achieve significant performance benefits in most TP scenarios. For example, a performance improvement of about 4% in TPC-C tests, over 10% in some banking workloads, and 15% in Sysbench RangeScan.
However, this feature also introduces some additional memory and CPU overhead, including determining whether the query is supported, parameterizing the query, and searching for a plan in the cache. If the cache cannot hit the majority of queries in your workload, enabling it might actually adversely affect performance.
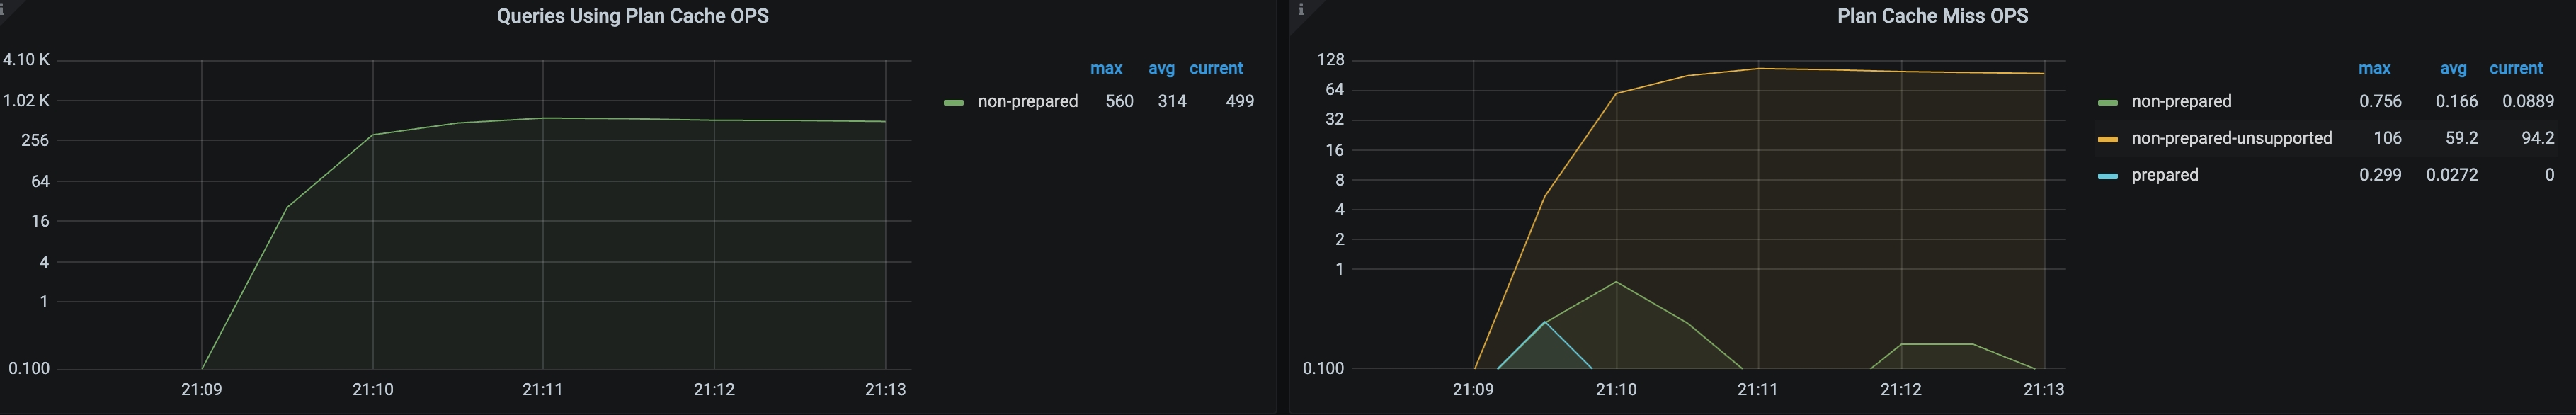
In this case, you need to observe the non-prepared metric in the Queries Using Plan Cache OPS panel and the non-prepared-unsupported metric in the Plan Cache Miss OPS panel on Grafana. If most queries are not supported and only a few can hit the plan cache, you can disable this feature.
Diagnostics
After enabling the non-prepared plan cache, you can execute the EXPLAIN FORMAT='plan_cache' SELECT ... statement to verify whether the query can hit the cache. For queries that cannot hit the cache, the system returns the reason in a warning.
Note that if you do not add FORMAT='plan_cache', the EXPLAIN statement will never hit the cache.
To verify whether the query hits the cache, execute the following EXPLAIN FORMAT='plan_cache' statement:
EXPLAIN FORMAT='plan_cache' SELECT * FROM (SELECT a+1 FROM t) t;
The output is as follows:
3 rows in set, 1 warning (0.00 sec)
To view the queries that cannot hit the cache, execute SHOW warnings;:
SHOW warnings;
The output is as follows:
+---------+------+-------------------------------------------------------------------------------+
| Level   | Code | Message                                                                       |
+---------+------+-------------------------------------------------------------------------------+
| Warning | 1105 | skip non-prepared plan-cache: queries that have sub-queries are not supported |
+---------+------+-------------------------------------------------------------------------------+
1 row in set (0.00 sec)
In the preceding example, the query cannot hit the cache because the non-prepared plan cache does not support the + operation.
Monitoring
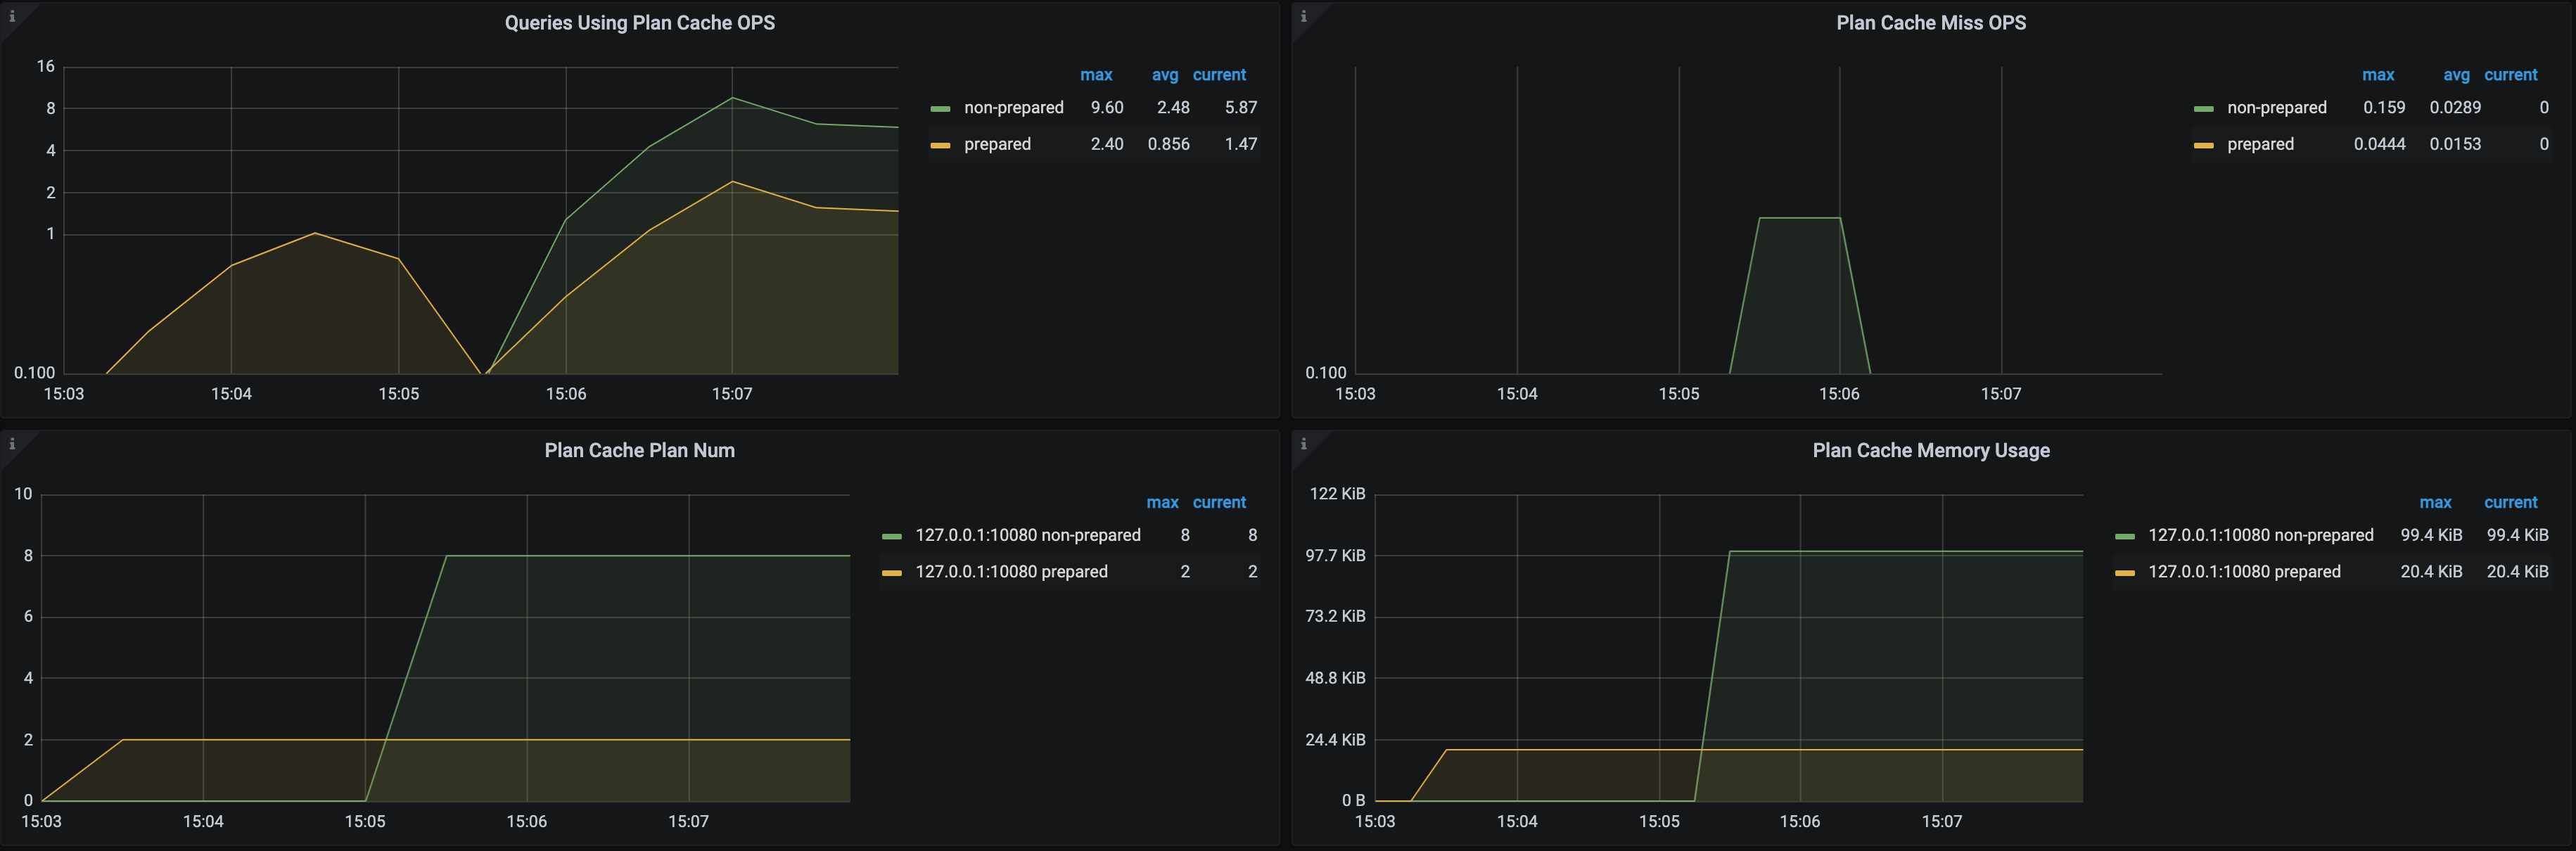
After enabling the non-prepared plan cache, you can monitor the memory usage, number of plans in the cache, and cache hit rate in the following panes:
You can also monitor the cache hit rate in the statements_summary table and slow query log. The following shows how to view the cache hit rate in the statements_summary table:
Create a table
t:CREATE TABLE t (a int);Enable the non-prepared plan cache:
SET @@tidb_enable_non_prepared_plan_cache=ON;Execute the following three queries:
SELECT * FROM t WHERE a<1;
SELECT * FROM t WHERE a<2;
SELECT * FROM t WHERE a<3;
Query the
statements_summarytable to view the cache hit rate:SELECT digest_text, query_sample_text, exec_count, plan_in_cache, plan_cache_hits FROM INFORMATION_SCHEMA.STATEMENTS_SUMMARY WHERE query_sample_text LIKE '%SELECT * FROM %';The output is as follows:
+---------------------------------+------------------------------------------+------------+---------------+-----------------+
| digest_text                     | query_sample_text                        | exec_count | plan_in_cache | plan_cache_hits |
+---------------------------------+------------------------------------------+------------+---------------+-----------------+
| SELECT * FROM `t` WHERE `a` < ? | SELECT * FROM t WHERE a<1                |          3 |             1 |               2 |
+---------------------------------+------------------------------------------+------------+---------------+-----------------+
1 row in set (0.01 sec)
From the output, you can see that the query was executed three times and hit the cache twice.