Deploy TiDB Dashboard
The TiDB Dashboard UI is built into the PD component for v4.0 or higher versions, and no additional deployment is required. Simply deploy a standard TiDB cluster, and TiDB Dashboard will be there.
See the following documents to learn how to deploy a standard TiDB cluster:
- Quick Start Guide for the TiDB Database Platform
- Deploy TiDB in Production Environment
- Kubernetes environment deployment
Deployment with multiple PD instances
When multiple PD instances are deployed in the cluster, only one of these instances serves the TiDB Dashboard.
When PD instances are running for the first time, they automatically negotiate with each other to choose one instance to serve the TiDB Dashboard. TiDB Dashboard will not run on other PD instances. The TiDB Dashboard service will always be provided by the chosen PD instance no matter PD instances are restarted or new PD instances are joined. However, there will be a re-negotiation when the PD instance that serves TiDB Dashboard is removed from the cluster (scaled-in). The negotiation process does not need user intervention.
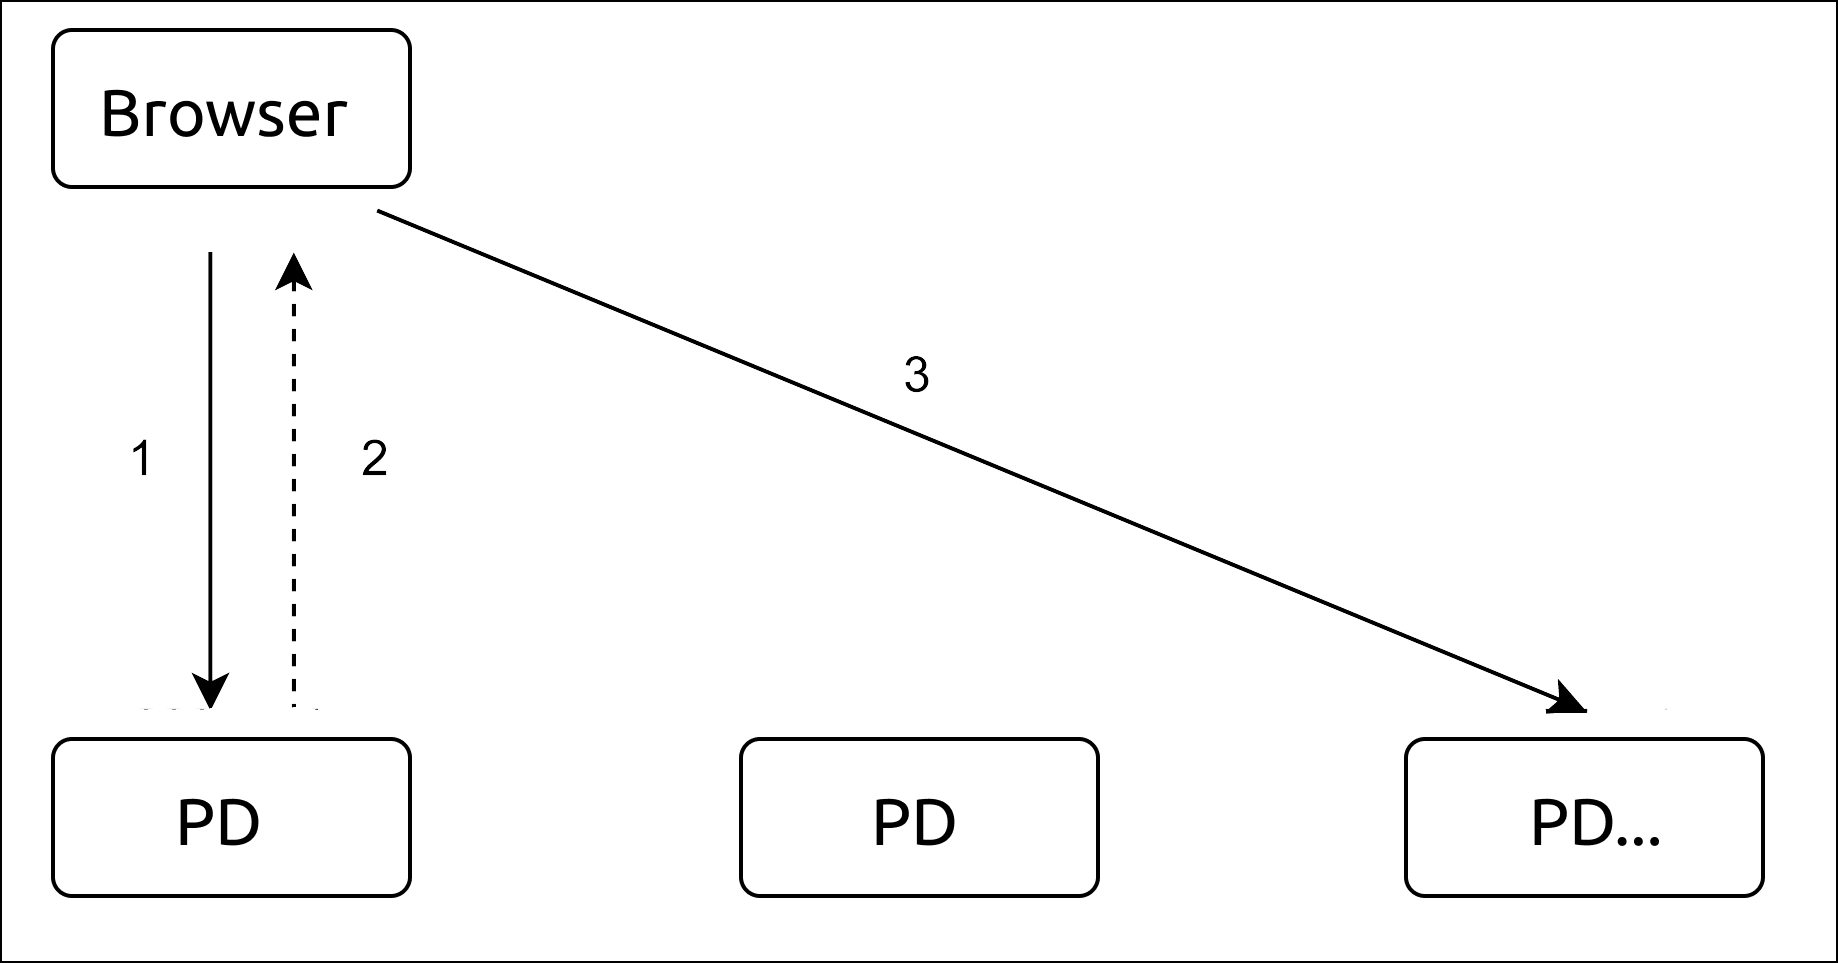
When you access a PD instance that does not serve TiDB Dashboard, the browser will be redirected automatically to guide you to access the PD instance that serves the TiDB Dashboard, so that you can access the service normally. This process is illustrated in the image below.

Check the PD instance that actually serves TiDB Dashboard
For a running cluster deployed using TiUP, you can use the tiup cluster display command to see which PD instance serves TiDB Dashboard. Replace CLUSTER_NAME with the cluster name.
tiup cluster display CLUSTER_NAME --dashboard
A sample output is as follows:
http://192.168.0.123:2379/dashboard/
Switch to another PD instance to serve TiDB Dashboard
For a running cluster deployed using TiUP, you can use the tiup ctl:<cluster-version> pd command to change the PD instance that serves TiDB Dashboard, or re-specify a PD instance to serve TiDB Dashboard when it is disabled:
tiup ctl:<cluster-version> pd -u http://127.0.0.1:2379 config set dashboard-address http://9.9.9.9:2379
In the command above:
- Replace
127.0.0.1:2379with the IP and port of any PD instance. - Replace
9.9.9.9:2379with the IP and port of the new PD instance that you desire to run the TiDB Dashboard service.
You can use the tiup cluster display command to see whether the modification is taking effect (replace CLUSTER_NAME with the cluster name):
tiup cluster display CLUSTER_NAME --dashboard
Disable TiDB Dashboard
For a running cluster deployed using TiUP, use the tiup ctl:<cluster-version> pd command to disable TiDB Dashboard on all PD instances (replace 127.0.0.1:2379 with the IP and port of any PD instance):
tiup ctl:<cluster-version> pd -u http://127.0.0.1:2379 config set dashboard-address none
After disabling TiDB Dashboard, checking which PD instance provides the TiDB Dashboard service will fail:
Error: TiDB Dashboard is disabled
Visiting the TiDB Dashboard address of any PD instance via the browser will also fail:
Dashboard is not started.
Re-enable TiDB Dashboard
For a running cluster deployed using TiUP, use the tiup ctl:<cluster-version> pd command to request PD to renegotiate an instance to run TiDB Dashboard (replace 127.0.0.1:2379 with the IP and port of any PD instance):
tiup ctl:<cluster-version> pd -u http://127.0.0.1:2379 config set dashboard-address auto
After executing the command above, you can use the tiup cluster display command to view the TiDB Dashboard instance address automatically negotiated by PD (replace CLUSTER_NAME with the cluster name):
tiup cluster display CLUSTER_NAME --dashboard
You can also re-enable TiDB Dashboard by manually specifying the PD instance that serves TiDB Dashboard. See Switch to another PD instance to serve TiDB Dashboard.
What's next
To learn how to access and log into the TiDB Dashboard UI, see Access TiDB Dashboard.
To learn how to enhance the security of TiDB Dashboard, such as configuring a firewall, see Secure TiDB Dashboard.