Understanding Stale Read and safe-ts in TiKV
In this guide, you can learn about Stale Read and safe-ts in TiKV and how to diagnose common issues related to Stale Read.
Overview of Stale Read and safe-ts
Stale Read is a mechanism that TiDB applies to read historical versions of data stored in TiDB. In TiKV, Stale Read relies on safe-ts. If a read request on a Region peer has a timestamp (ts) that is less than or equal to the Region's safe-ts, TiDB can safely read the data from the peer. TiKV implements this safety guarantee by ensuring that safe-ts is always less than or equal to resolved-ts.
Understand safe-ts and resolved-ts
This section explains the concepts and maintenance of safe-ts and resolved-ts.
What is safe-ts?
The safe-ts is a timestamp that each peer in a Region maintains. It ensures that all transactions with a timestamp less than this value have been applied locally, which enables local Stale Read.
What is resolved-ts?
The resolved-ts is a timestamp that guarantees all transactions with a timestamp less than this value have been applied by the leader. Unlike safe-ts, which is a peer concept, resolved-ts is only maintained by the Region leader. Followers might have a smaller apply index than the leader, so resolved-ts cannot be directly treated as safe-ts in followers.
The maintenance of safe-ts
The RegionReadProgress module maintains safe-ts. The Region leader maintains resolved-ts and periodically sends its resolved-ts, the minimum required apply index (which validates this resolved-ts), and the Region itself to the RegionReadProgerss modules of all replicas via the CheckLeader RPC.
When a peer applies data, it updates the apply index and checks if any pending resolved-ts can become the new safe-ts.
The maintenance of resolved-ts
The Region leader uses a resolver to manage resolved-ts. This resolver tracks locks in the LOCK CF (Column Family) by receiving change logs when Raft applies. When initialized, the resolver scans the entire Region to track locks.
Diagnose Stale Read issues
This section introduces how to diagnose Stale Read issues using Grafana, tikv-ctl, and logs.
Identify issues
In the Grafana > TiDB dashboard > KV Request dashboard, the following panels show the hit rate, OPS, and traffic of Stale Read:
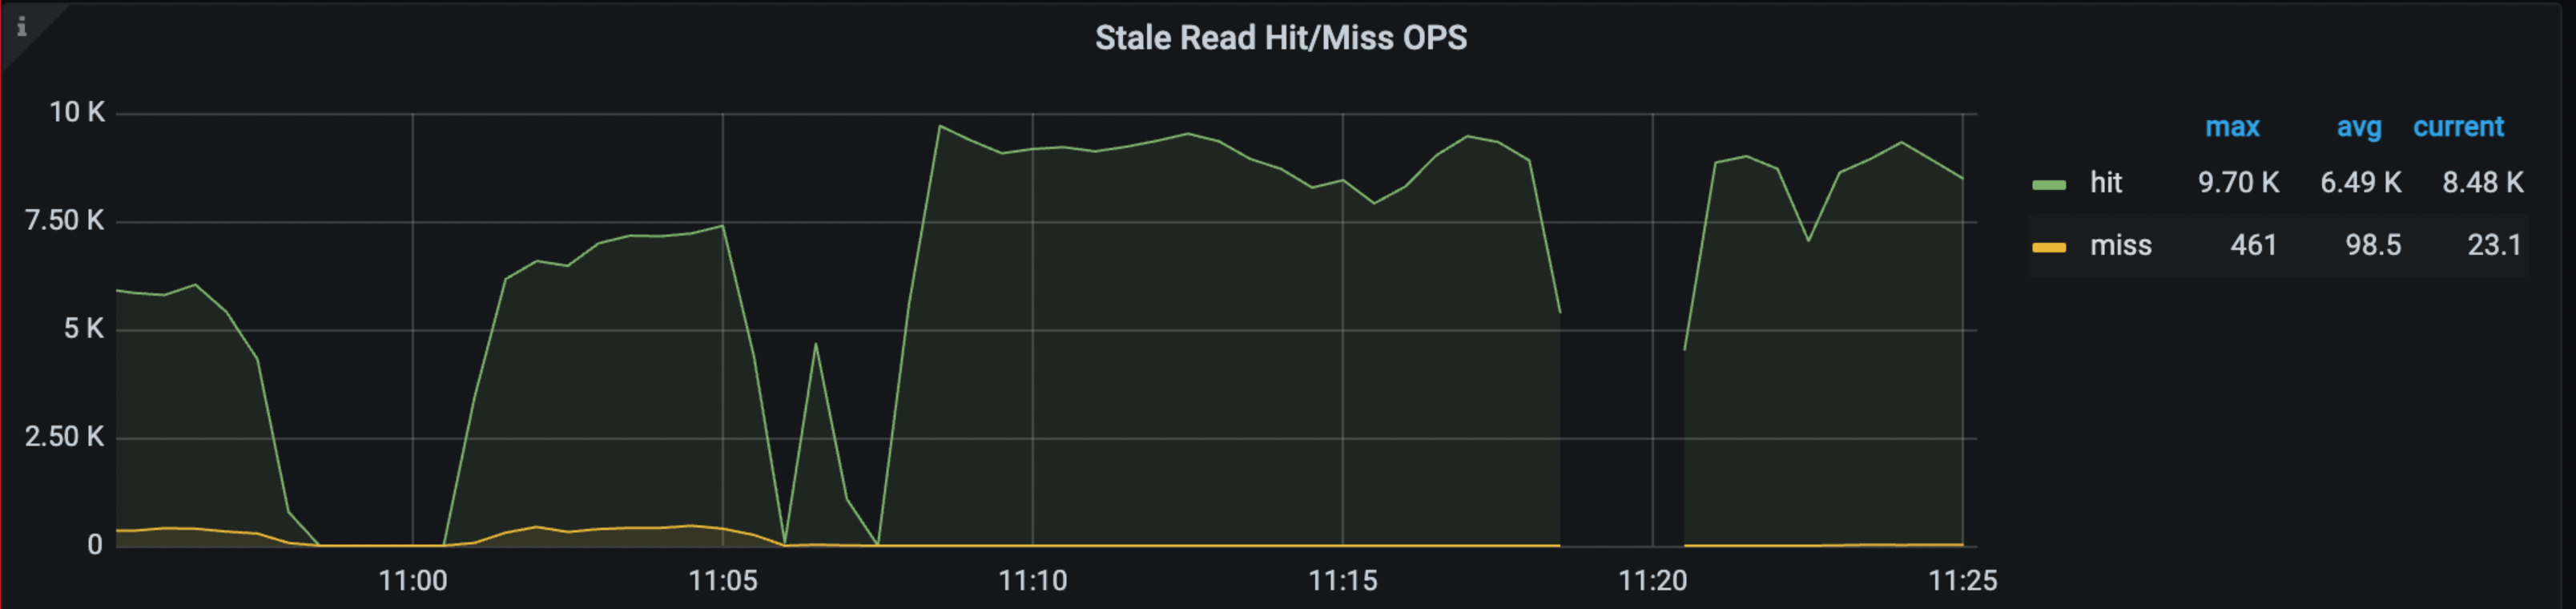
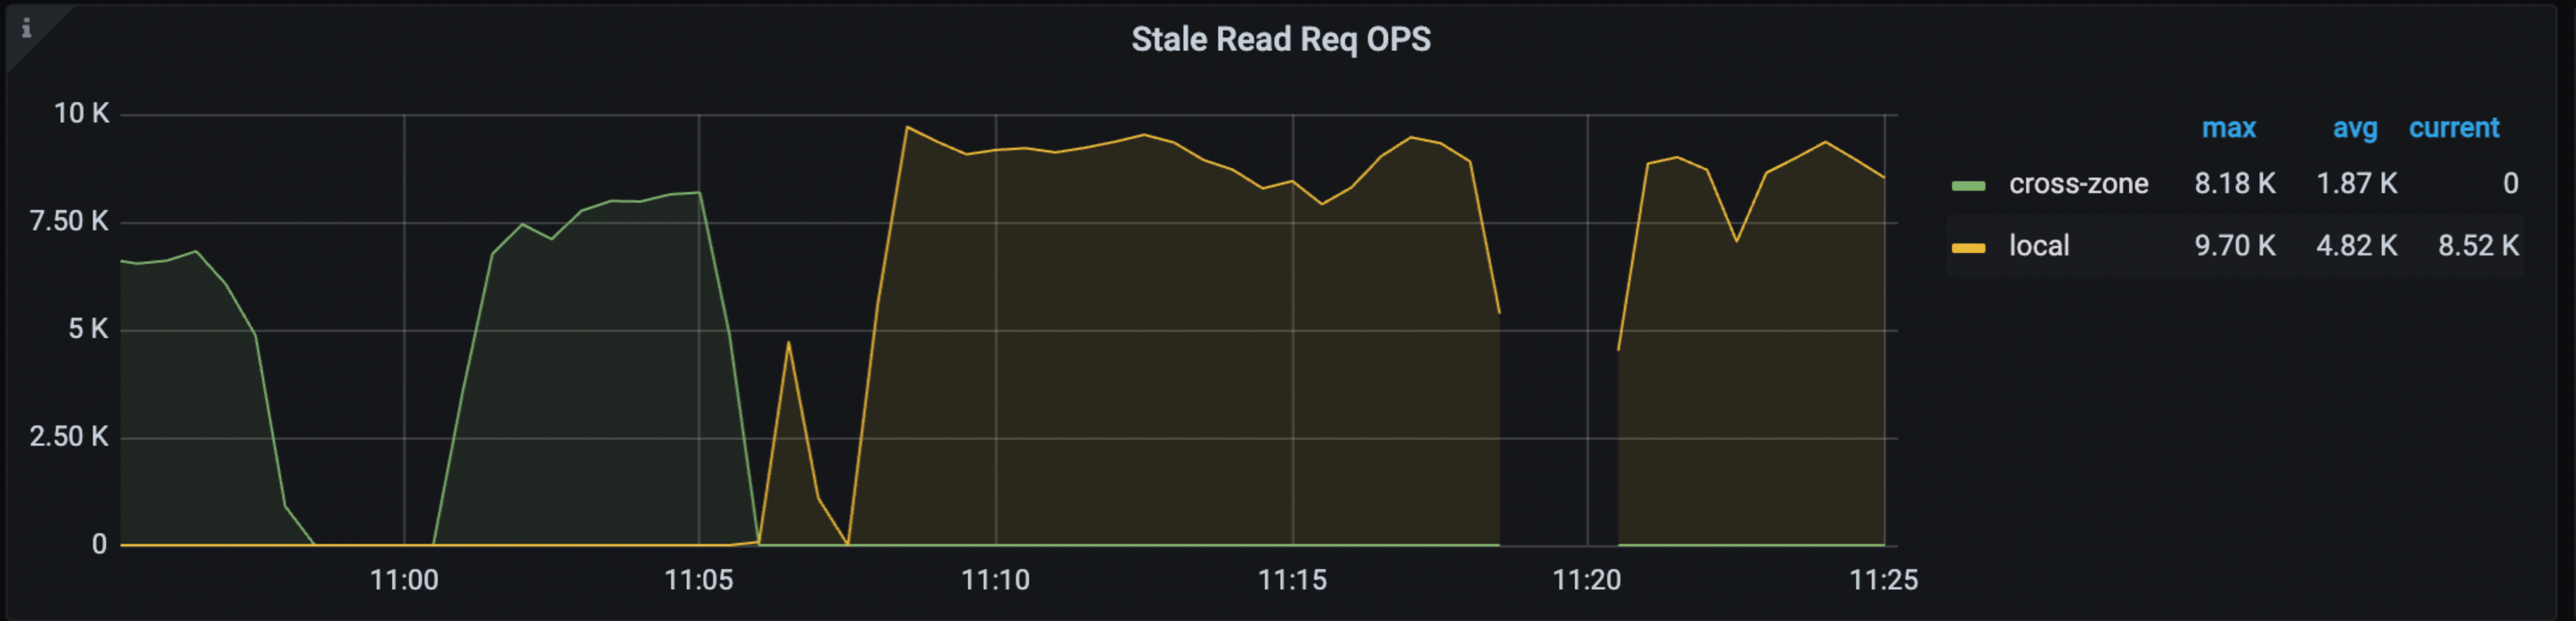
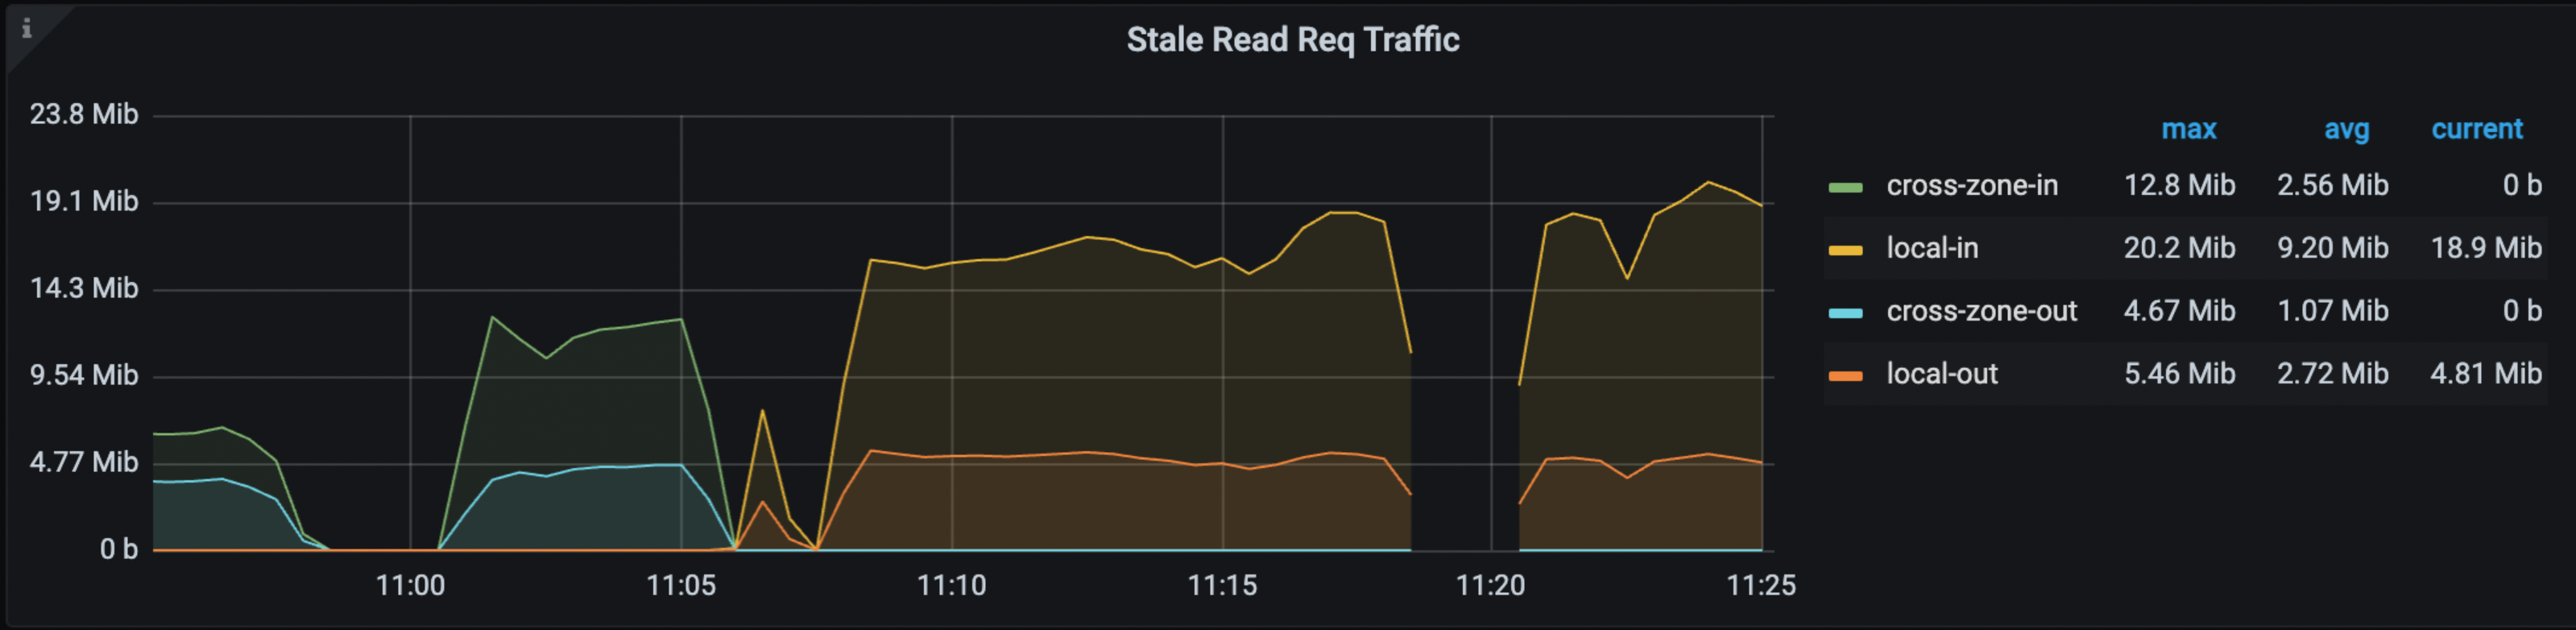
For more information about the preceding metrics, see TiDB monitoring metrics.
When Stale Read issues occur, you might notice changes in the preceding metrics. The most direct indicator is a WARN log from TiDB, which reports DataIsNotReady with a Region ID and the safe-ts it encounters.
Common causes
The most common causes that can impact the effectiveness of Stale Read are as follows:
- Transactions that take long time to commit.
- Transactions live too long before they commit.
- Delays in pushing the information of CheckLeader from the leader to the follower.
Use Grafana to diagnose
In the TiKV-Details > Resolved-TS dashboard, you can identify the Region with the smallest resolved-ts and safe-ts for each TiKV. If these timestamps are significantly behind real-time, you need to check the details of these Regions using tikv-ctl.
Use tikv-ctl to diagnose
tikv-ctl provides up-to-date details of the resolver and RegionReadProgress. For more details, see Get the state of a Region's RegionReadProgress.
The following is an example:
./tikv-ctl --host 127.0.0.1:20160 get-region-read-progress -r 14 --log --min-start-ts 0
The output is as follows:
Region read progress:
    exist: true,
    safe_ts: 0,
    applied_index: 92,
    pending front item (oldest) ts: 0,
    pending front item (oldest) applied index: 0,
    pending back item (latest) ts: 0,
    pending back item (latest) applied index: 0,
    paused: false,
Resolver:
    exist: true,
    resolved_ts: 0,
    tracked index: 92,
    number of locks: 0,
    number of transactions: 0,
    stopped: false,
The preceding output helps you determine:
- Whether locks are blocking resolved-ts.
- Whether the apply index is too small to update safe-ts.
- Whether the leader is sending a sufficiently updated resolved-ts when a follower peer exists.
Use logs to diagnose
Every 10 seconds, TiKV checks the following metrics:
- The Region leader whose resolved-ts is the minimal
- The Region follower whose safe-ts is the minimal
- The Region follower whose resolved-ts is the minimal
If any of these timestamps is abnormally small, TiKV prints a log.
These logs are especially useful when you want to diagnose a historical problem that is no longer present.
The following shows an example of the logs:
[2023/08/29 16:48:18.118 +08:00] [INFO] [endpoint.rs:505] ["the max gap of leader resolved-ts is large"] [last_resolve_attempt="Some(LastAttempt { success: false, ts: TimeStamp(443888082736381953), reason: \"lock\", lock: Some(7480000000000000625F728000000002512B5C) })"] [duration_to_last_update_safe_ts=10648ms] [min_memory_lock=None] [txn_num=0] [lock_num=0] [min_lock=None] [safe_ts=443888117326544897] [gap=110705ms] [region_id=291]

[2023/08/29 16:48:18.118 +08:00] [INFO] [endpoint.rs:526] ["the max gap of follower safe-ts is large"] [oldest_candidate=None] [latest_candidate=None] [applied_index=3276] [duration_to_last_consume_leader=11460ms] [resolved_ts=443888117117353985] [safe_ts=443888117117353985] [gap=111503ms] [region_id=273]

[2023/08/29 16:48:18.118 +08:00] [INFO] [endpoint.rs:547] ["the max gap of follower resolved-ts is large; it's the same region that has the min safe-ts"]
Troubleshooting tips
Handle slow transaction commit
A transaction that takes a long time to commit is often a large transaction. The prewrite phase of this slow transaction leaves some locks, but it takes too long before the commit phase clean the locks. To troubleshoot this issue, you can try to identify the transaction to which the locks belong and try to pinpoint the reason they exist, such as using logs.
The following list some actions you can take:
Specify the
--logoption in thetikv-ctlcommand and check TiKV logs to find the specific locks with their start_ts.Search the start_ts in both TiDB and TiKV logs to identify issues with the transaction.
If a query takes over 60 seconds, an
expensive_querylog is printed with the SQL statement. You can use the start_ts value to match the log. The following is an example:[2023/07/17 19:32:09.403 +08:00] [WARN] [expensivequery.go:145] [expensive_query] [cost_time=60.025022732s] [cop_time=0.00346666s] [process_time=8.358409508s] [wait_time=0.013582596s] [request_count=278] [total_keys=9943616] [process_keys=9943360] [num_cop_tasks=278] [process_avg_time=0.030066221s] [process_p90_time=0.045296042s] [process_max_time=0.052828934s] [process_max_addr=192.168.31.244:20160] [wait_avg_time=0.000048858s] [wait_p90_time=0.00006057s] [wait_max_time=0.00040991s] [wait_max_addr=192.168.31.244:20160] [stats=t:442916666913587201] [conn=2826881778407440457] [user=root] [database=test] [table_ids="[100]"] [**txn_start_ts**=442916790435840001] [mem_max="2514229289 Bytes (2.34 GB)"] [sql="update t set b = b + 1"]Use the
CLUSTER_TIDB_TRXtable to find active transactions if you cannot get enough information about the locks from logs.Execute
SHOW PROCESSLISTto view the current sessions connected to the same TiDB server and their time spent on the current statement. But it does not show start_ts.
If the locks exist due to ongoing large transactions, consider modifying your application logic as these locks can hinder the progress of resolve-ts.
If the locks do not belong to any ongoing transactions, it might be due to a coordinator (TiDB) crashing after it prewrites the locks. In this case, TiDB will automatically resolve the locks. No action is required unless the problem persists.
Handle long-lived transactions
Transactions that remain active for a long time could possibly block the advance of resolved-ts, even if they eventually commit quickly. This is because it is the start-ts of these long-lived transactions that are used to calculate the resolved-ts.
To address this issue:
Identify the Transaction: Begin by pinpointing the transaction associated with the locks. It is crucial to understand the reason behind their existence. Leveraging logs can be particularly helpful.
Examine Application Logic: If the prolonged transaction duration is a result of your application's logic, consider revising it to prevent such occurrences.
Address Slow Queries: If the transaction's duration is extended due to slow queries, prioritize resolving these queries to alleviate the issue.
Address CheckLeader issues
To address CheckLeader issues, you can check the network and the Check Leader Duration metric in TiKV-Details > Resolved-TS dashboard.
Example
If you observe an increasing miss rate of Stale Read OPS as follows:
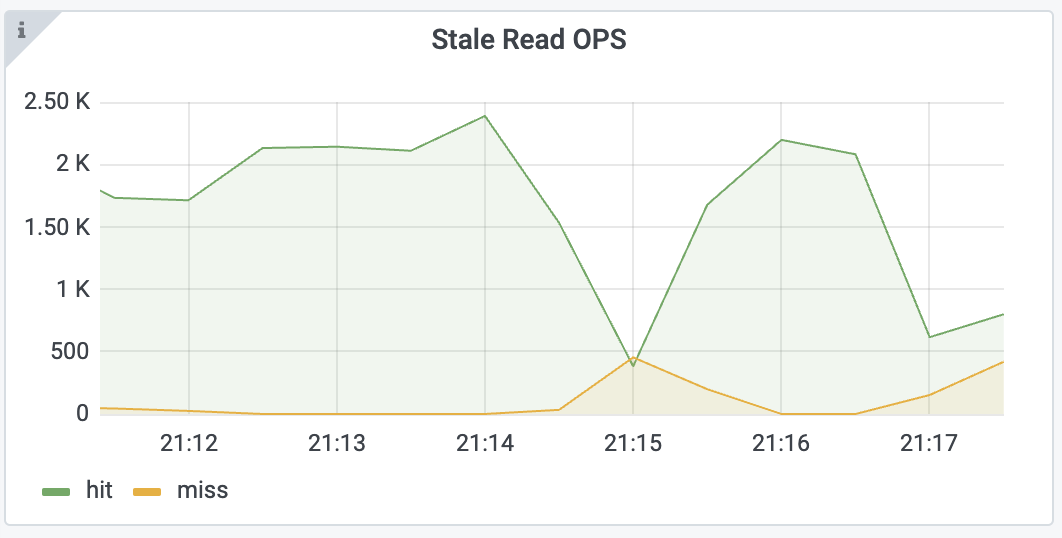
You can first check the Max Resolved TS gap and Min Resolved TS Region metrics in the TiKV-Details > Resolved-TS dashboard:
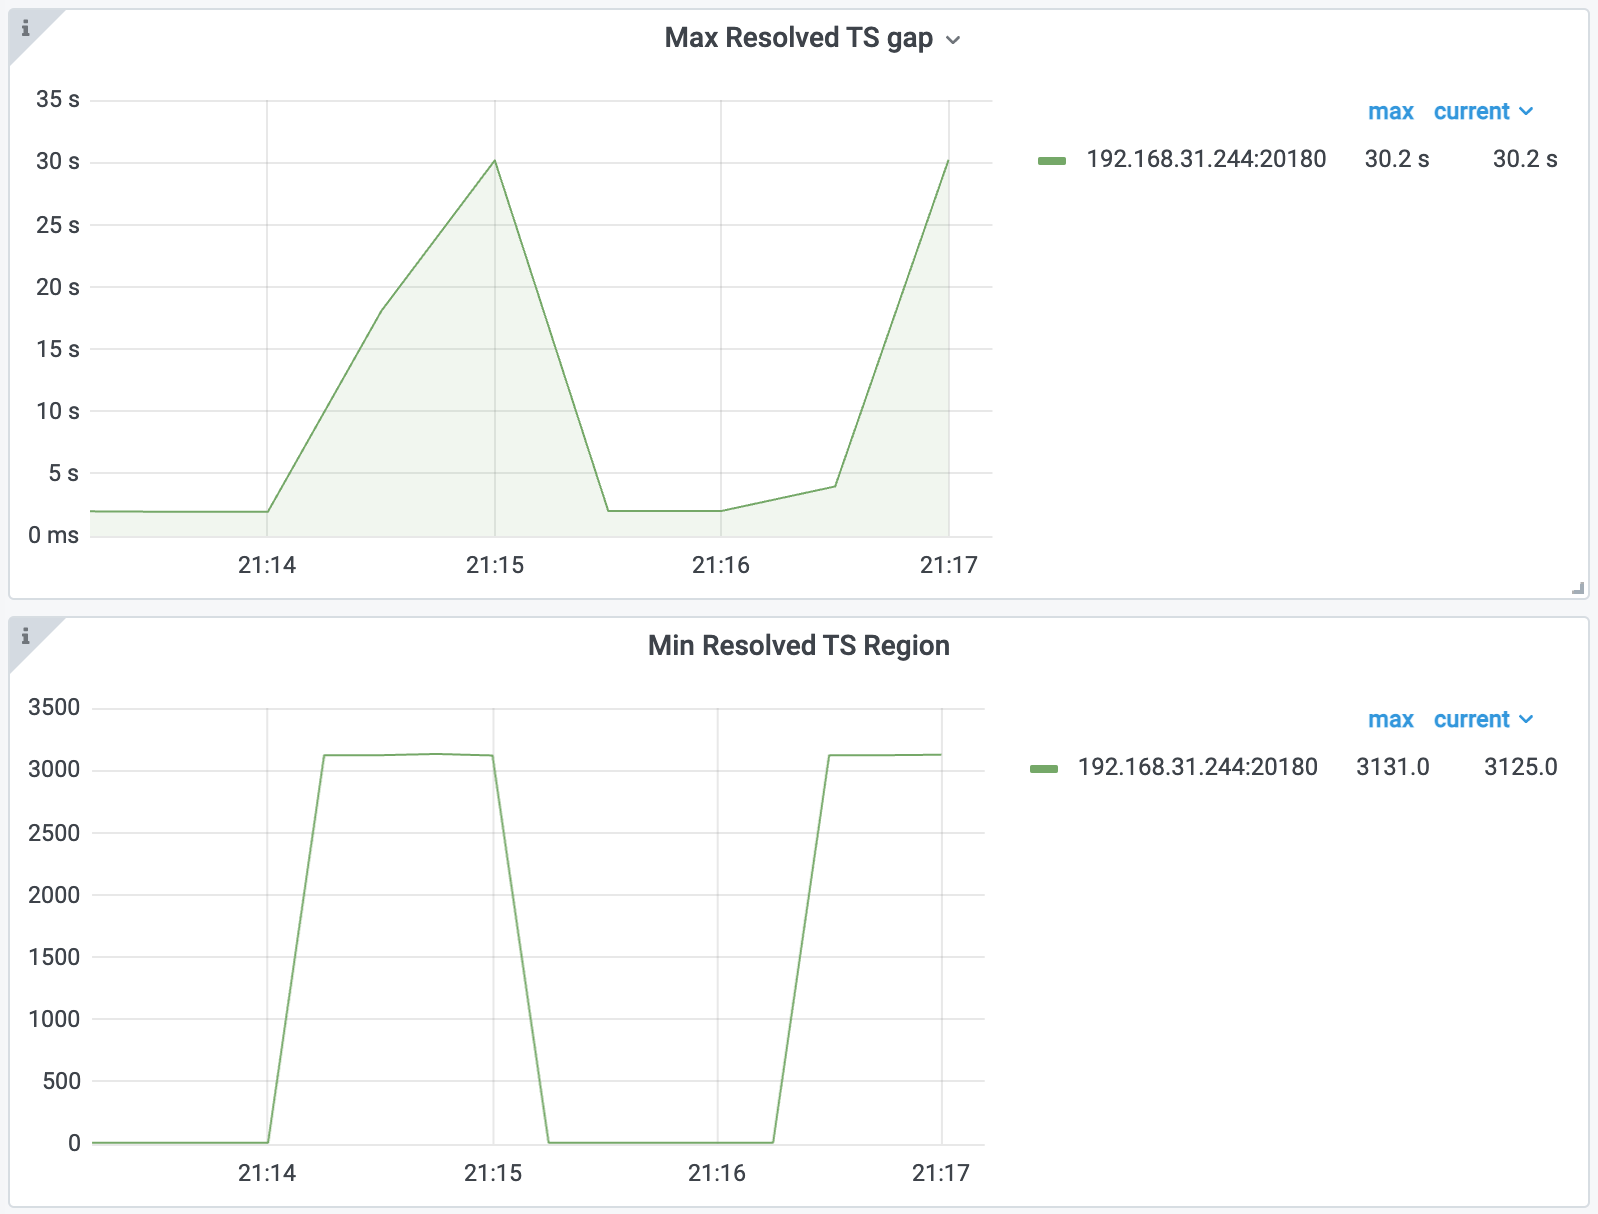
From the preceding metrics, you can find that Region 3121 and some other Regions have not updated their resolved-ts in time.
To get more details about the state of Region 3121, you can run the following command:
./tikv-ctl --host 127.0.0.1:20160 get-region-read-progress -r 3121 --log
The output is as follows:
Region read progress:
    exist: true,
    safe_ts: 442918444145049601,
    applied_index: 2477,
    read_state.ts: 442918444145049601,
    read_state.apply_index: 1532,
    pending front item (oldest) ts: 0,
    pending front item (oldest) applied index: 0,
    pending back item (latest) ts: 0,
    pending back item (latest) applied index: 0,
    paused: false,
    discarding: false,
Resolver:
    exist: true,
    resolved_ts: 442918444145049601,
    tracked index: 2477,
    number of locks: 480000,
    number of transactions: 1,
    stopped: false,
A notable observation here is that the applied_index equals to the tracked index in resolver. Therefore, the resolver appears to be the root of this issue. You can also see that there is 1 transaction that leaves 480000 locks in this Region, which might be the cause.
To get the exact transaction and the keys of some of the locks, you can check TiKV logs and grep locks with. The output is as follows:
[2023/07/17 21:16:44.257 +08:00] [INFO] [resolver.rs:213] ["locks with the minimum start_ts in resolver"] [keys="[74800000000000006A5F7280000000000405F6, ... , 74800000000000006A5F72800000000000EFF6, 74800000000000006A5F7280000000000721D9, 74800000000000006A5F72800000000002F691]"] [start_ts=442918429687808001] [region_id=3121]
From the TiKV log, you can get the start_ts of the transaction, that is 442918429687808001. To get more information about the statement and transaction, you can grep this timestamp in TiDB logs. The output is as follows:
[2023/07/17 21:16:18.287 +08:00] [INFO] [2pc.go:685] ["[BIG_TXN]"] [session=2826881778407440457] ["key sample"=74800000000000006a5f728000000000000000] [size=319967171] [keys=10000000] [puts=10000000] [dels=0] [locks=0] [checks=0] [txnStartTS=442918429687808001]

[2023/07/17 21:16:22.703 +08:00] [WARN] [expensivequery.go:145] [expensive_query] [cost_time=60.047172498s] [cop_time=0.004575113s] [process_time=15.356963423s] [wait_time=0.017093811s] [request_count=397] [total_keys=20000398] [process_keys=10000000] [num_cop_tasks=397] [process_avg_time=0.038682527s] [process_p90_time=0.082608262s] [process_max_time=0.116321331s] [process_max_addr=192.168.31.244:20160] [wait_avg_time=0.000043057s] [wait_p90_time=0.00004007s] [wait_max_time=0.00075014s] [wait_max_addr=192.168.31.244:20160] [stats=t:442918428521267201] [conn=2826881778407440457] [user=root] [database=test] [table_ids="[106]"] [txn_start_ts=442918429687808001] [mem_max="2513773983 Bytes (2.34 GB)"] [sql="update t set b = b + 1"]
Then, you can basically locate the statement that caused the problem. To further check it, you can execute the SHOW PROCESSLIST statement. The output is as follows:
+---------------------+------+---------------------+--------+---------+------+------------+---------------------------+
| Id                  | User | Host                | db     | Command | Time | State      | Info                      |
+---------------------+------+---------------------+--------+---------+------+------------+---------------------------+
| 2826881778407440457 | root | 192.168.31.43:58641 | test   | Query   | 48   | autocommit | update t set b = b + 1    |
| 2826881778407440613 | root | 127.0.0.1:45952     | test   | Execute | 0    | autocommit | select * from t where a=? |
| 2826881778407440619 | root | 192.168.31.43:60428 | <null> | Query   | 0    | autocommit | show processlist          |
+---------------------+------+---------------------+--------+---------+------+------------+---------------------------+
The output shows that someone is executing an unexpected UPDATE statement (update t set b = b + 1), which results in a large transaction and hinders Stale Read.
To resolve this issue, you can stop the application that is running this UPDATE statement.