TiDB Dashboard Top SQL Page
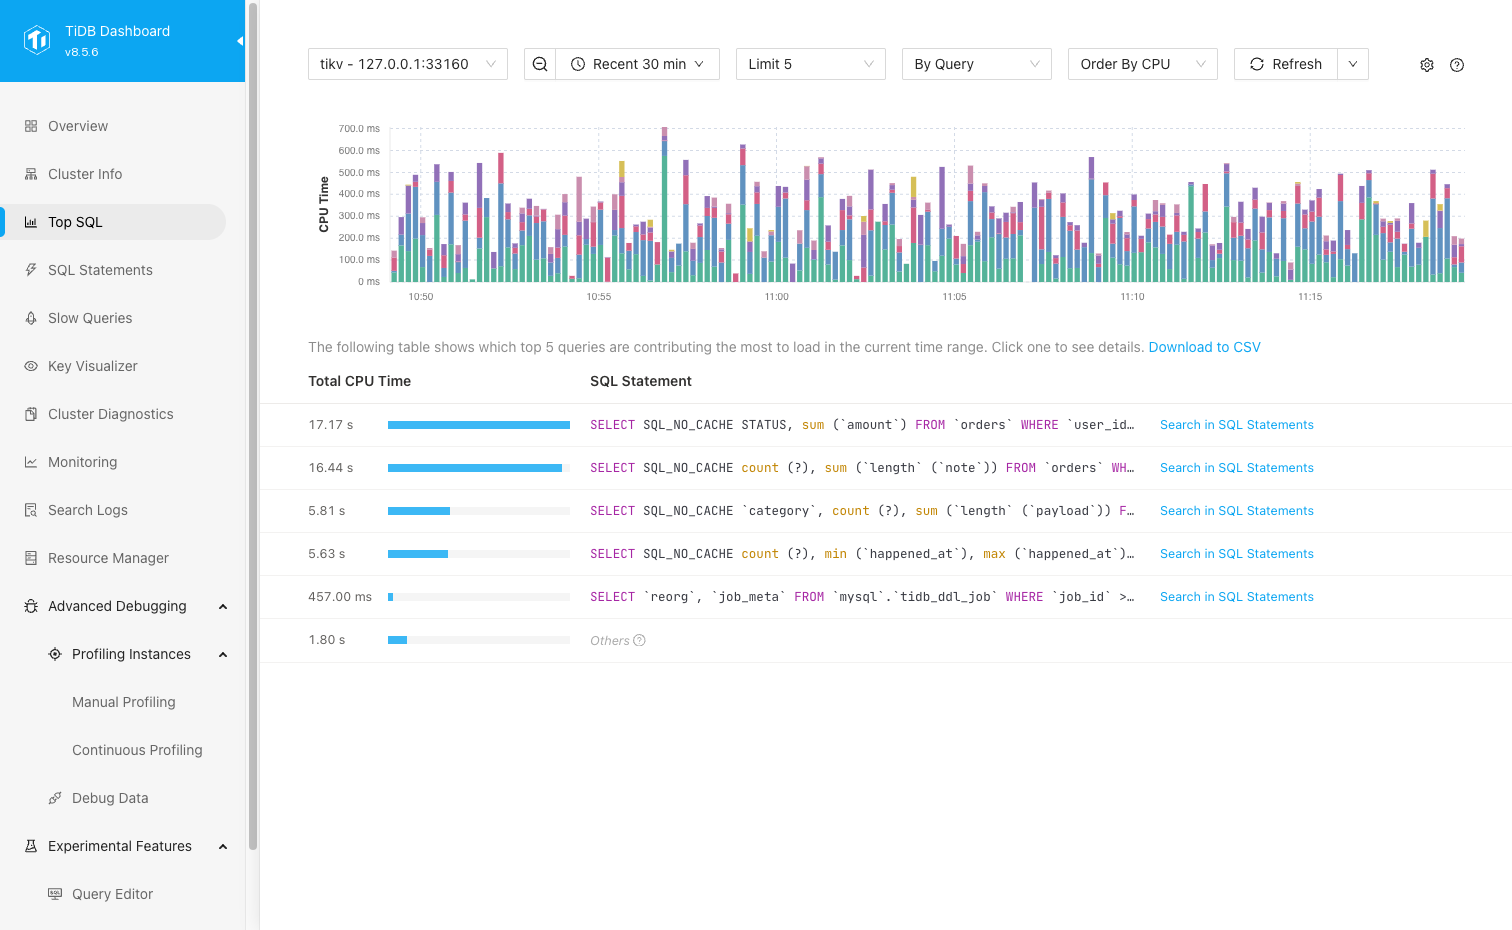
On the Top SQL page of TiDB Dashboard, you can view and analyze the most resource-consuming SQL queries on a specified TiDB or TiKV node over a period of time.
- After you enable Top SQL, this feature continuously collects CPU workload data from existing TiDB and TiKV nodes and retains the data for up to 30 days.
- Starting from v8.5.6 and v9.0.0, you can also enable TiKV Network IO collection (multi-dimensional) in the Top SQL settings to further view metrics such as
Network BytesandLogical IO Bytesfor specified TiKV nodes, and perform aggregation analysis in dimensions ofBy Query,By Table,By DB, andBy Region.
Top SQL provides the following features:
- Visualize the top
5,20, or100SQL queries with the most resource consumption in the current time range through charts and tables, with the remaining records automatically summarized asOthers. - Display resource consumption hotspots sorted by CPU time or network bytes. When selecting a TiKV node, you can also sort by logical IO bytes.
- Display SQL and execution plan details by query. When selecting a TiKV node, you can also aggregate analysis in dimensions of
By Table,By DB, andBy Region. - Zoom in on a selected time range in the chart, manually refresh data, enable auto refresh, and export table data to CSV.
- Collect all SQL statements that are executed, including those that are still running.
- Display data of a specific TiDB or TiKV node.
Recommended scenarios
Top SQL is suitable for analyzing performance issues. The following are some typical Top SQL scenarios:
- You discovered that an individual TiDB or TiKV node in the cluster has a very high CPU usage. You want to quickly locate which type of SQL is consuming a lot of CPU resources.
- The overall cluster queries become slow. You want to find out which SQL is currently consuming the most resources, or compare the main query differences before and after the workload changes.
- You need to locate hotspots from a higher dimension and want to aggregate and view resource consumption on the TiKV side by
Table,DB, orRegion. - You need to troubleshoot TiKV hotspots from the perspective of network traffic or logical IO, not just limited to the CPU dimension.
Top SQL cannot be used in the following scenarios:
- Top SQL cannot be used to pinpoint non-performance issues, such as incorrect data or abnormal crashes.
- Top SQL is not suitable for directly analyzing lock conflicts, transaction semantic errors, or other issues not caused by resource consumption.
Access the page
You can access the Top SQL page using either of the following methods:
After logging in to TiDB Dashboard, click Top SQL in the left navigation menu.
Visit http://127.0.0.1:2379/dashboard/#/topsql in your browser. Replace
127.0.0.1:2379with the actual PD node address and port.
Enable Top SQL
Top SQL is not enabled by default as it has a slight impact on cluster performance (within 3% on average) when enabled. You can enable Top SQL by the following steps:
- Visit the Top SQL page.
- Click Open Settings. In the Settings area on the right side of the page, enable the Enable Feature switch.
- Click Save.
After enabling Top SQL, you can only view data collected starting from this point in time, while historical data before enabling will not be backfilled. Data display usually has a delay of about 1 minute, so you need to wait a moment to see new data. After disabling Top SQL, if historical data has not expired, the Top SQL page still displays this historical data, but new data will no longer be collected or displayed.
In addition to the UI, you can also enable the Top SQL feature by setting the TiDB system variable tidb_enable_top_sql:
SET GLOBAL tidb_enable_top_sql = 1;
(Optional) Enable TiKV Network IO collection New in v8.5.6 and v9.0.0
To view Top SQL by Order By Network or Order By Logical IO for TiKV nodes, or to use the By Region aggregation, you can enable the Enable TiKV Network IO collection (multi-dimensional) switch in Top SQL settings and save the changes.
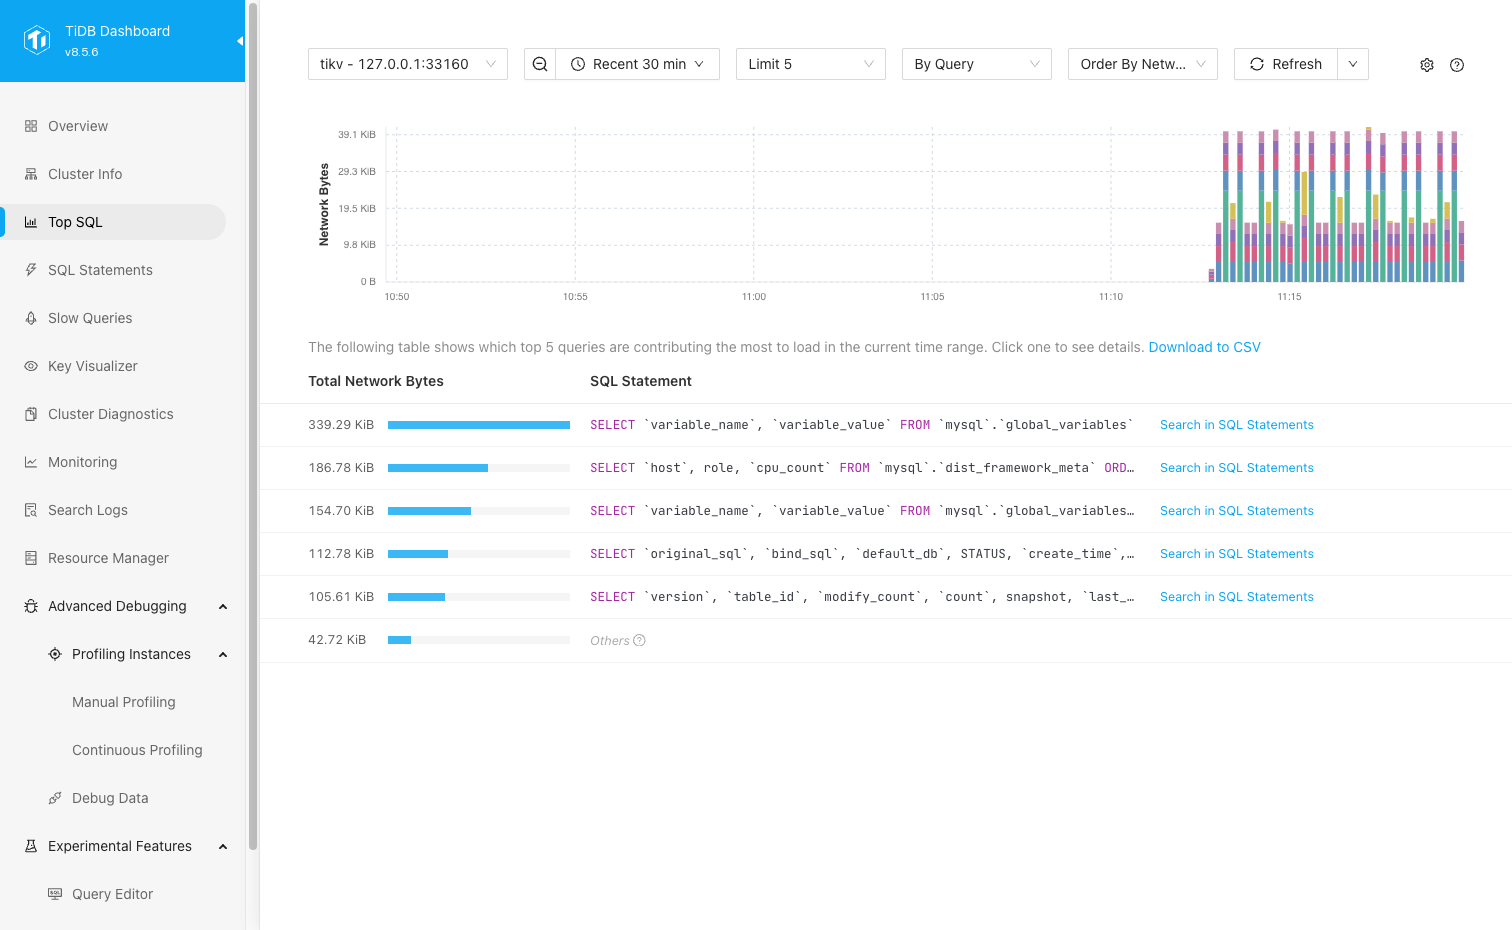
- Order By Network: Sorts by the number of network bytes generated during TiKV request processing.
- Order By Logical IO: Sorts by the amount of logical data (in bytes) processed by TiKV at the storage layer for TiKV requests, such as the data scanned or processed during reads and the data written by write requests.
As shown in the following screenshot, the right Settings panel displays both the Enable Feature and Enable TiKV Network IO collection (multi-dimensional) switches.
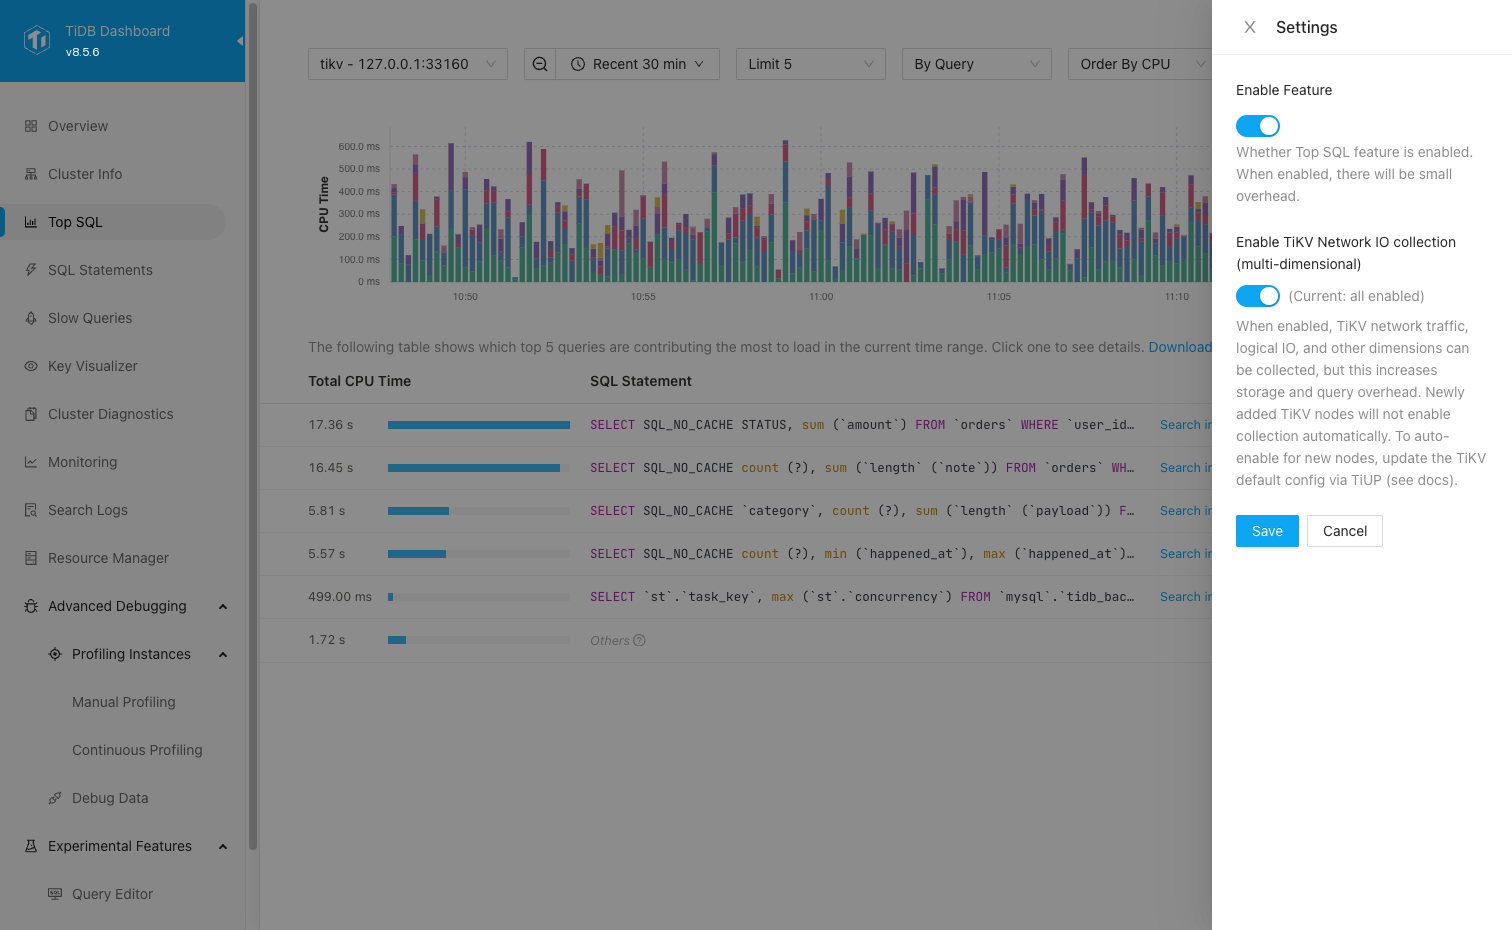
Enabling TiKV Network IO collection (multi-dimensional) increases storage and query overhead. After enabling, the configuration is delivered to all current TiKV nodes; data display might also have a delay of about 1 minute. If some TiKV nodes fail to enable this feature, the page shows a warning, and new data might be incomplete.
For newly added TiKV nodes, this switch does not take effect automatically. You need to set the Enable TiKV Network IO collection (multi-dimensional) switch to all enabled in the Top SQL settings panel and save, so the configuration is delivered to all TiKV nodes again. If you want newly added TiKV nodes to automatically enable this feature, add the following configuration under server_configs.tikv in the TiUP cluster topology file and use TiUP to re-deliver the TiKV configuration:
server_configs:
  tikv:
    resource-metering.enable-network-io-collection: true
For more information about TiUP topology configuration, see TiUP cluster topology file configuration.
Use Top SQL
The following are the common steps to use Top SQL.
Visit the Top SQL page.
Select a particular TiDB or TiKV node that you want to observe the workload.

If you are not sure which node to observe, you can first locate the node with abnormal workload from Grafana or the TiDB Dashboard Overview page, and then return to the Top SQL page for further analysis.
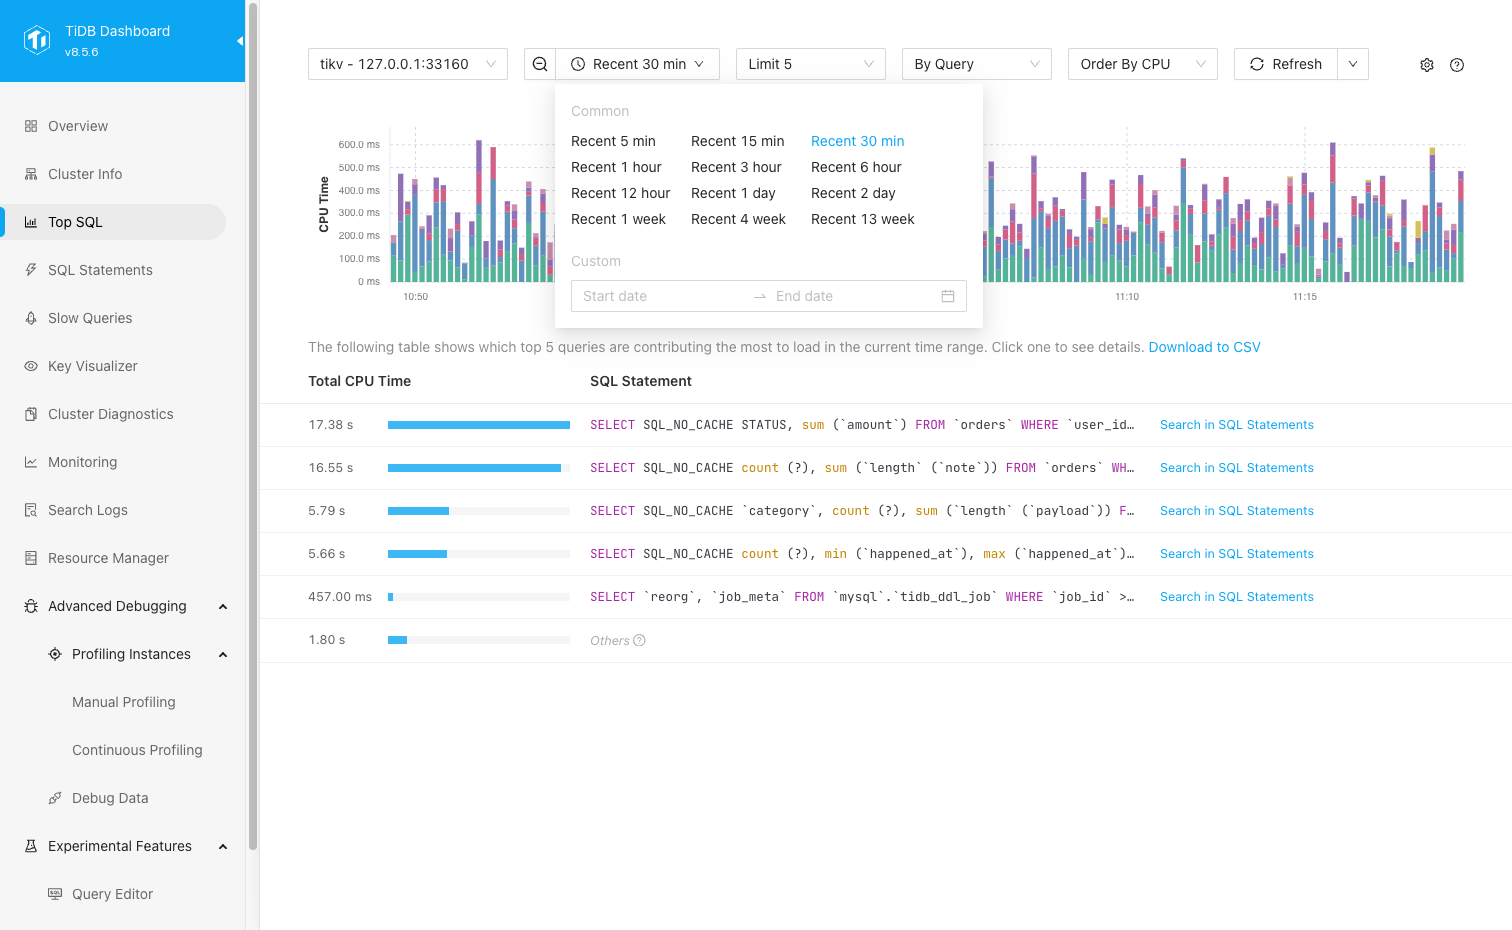
Set the time range and refresh data as needed.
You can adjust the time range in the time picker or zoom the observation window by selecting a time range in the chart. Setting a smaller time range displays more fine-grained data, with a precision of up to 1 second.
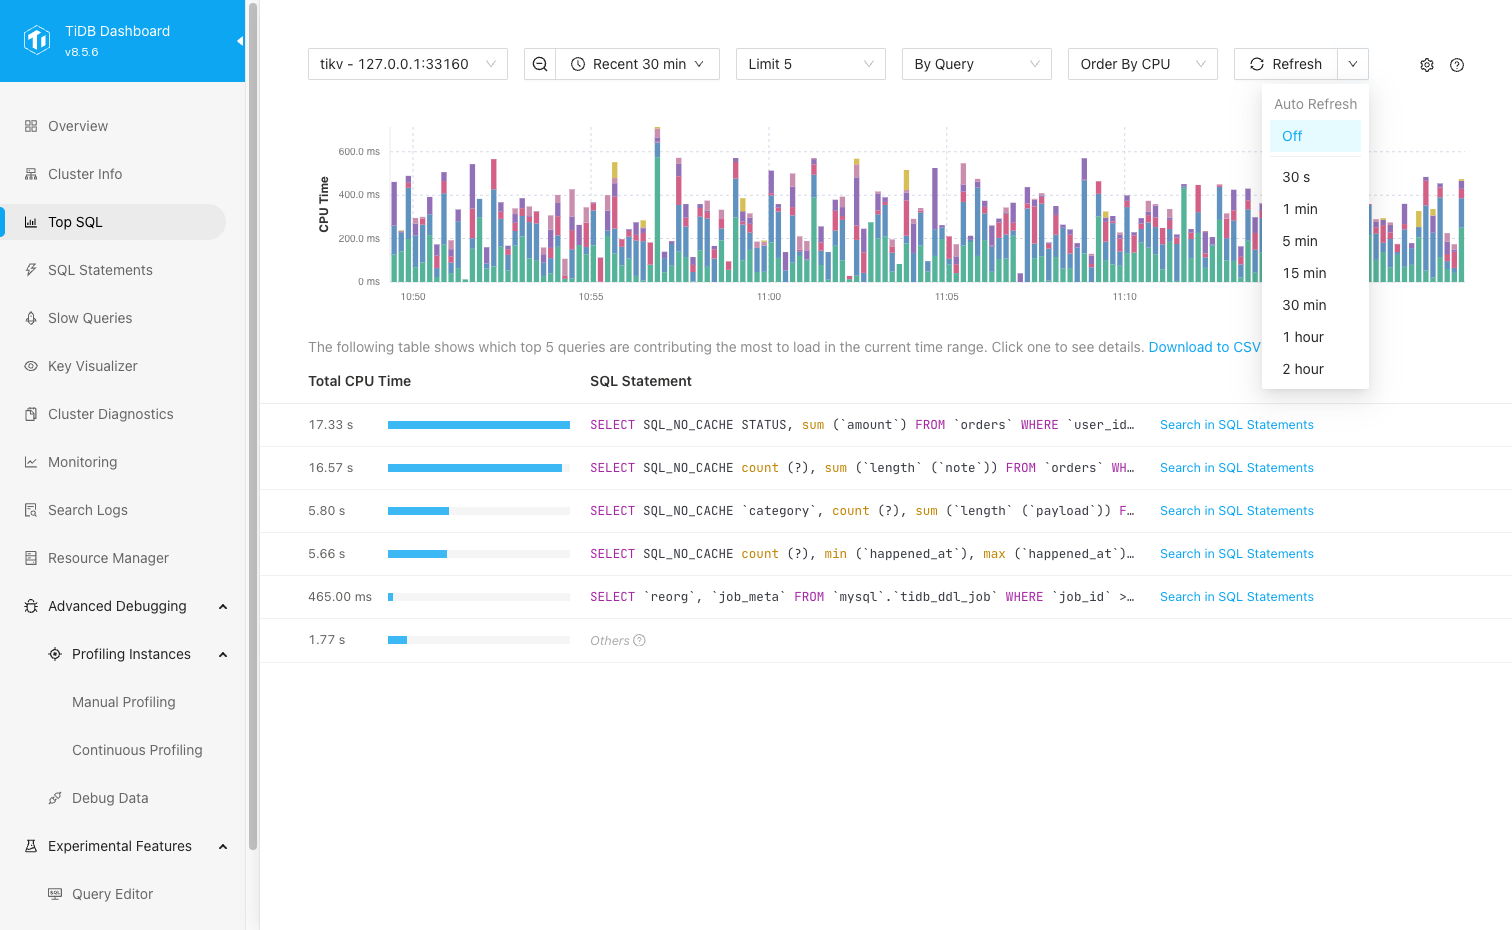
If the chart is out of date, click Refresh to refresh once, or select the data auto-refresh frequency from the Refresh drop-down list.
Select the observation mode.
Use
Limitto display the Top5,20, or100SQL queries.The default aggregation dimension is
By Query. If you select a TiKV node, you can also aggregate in dimensions ofBy Table,By DB, orBy Region.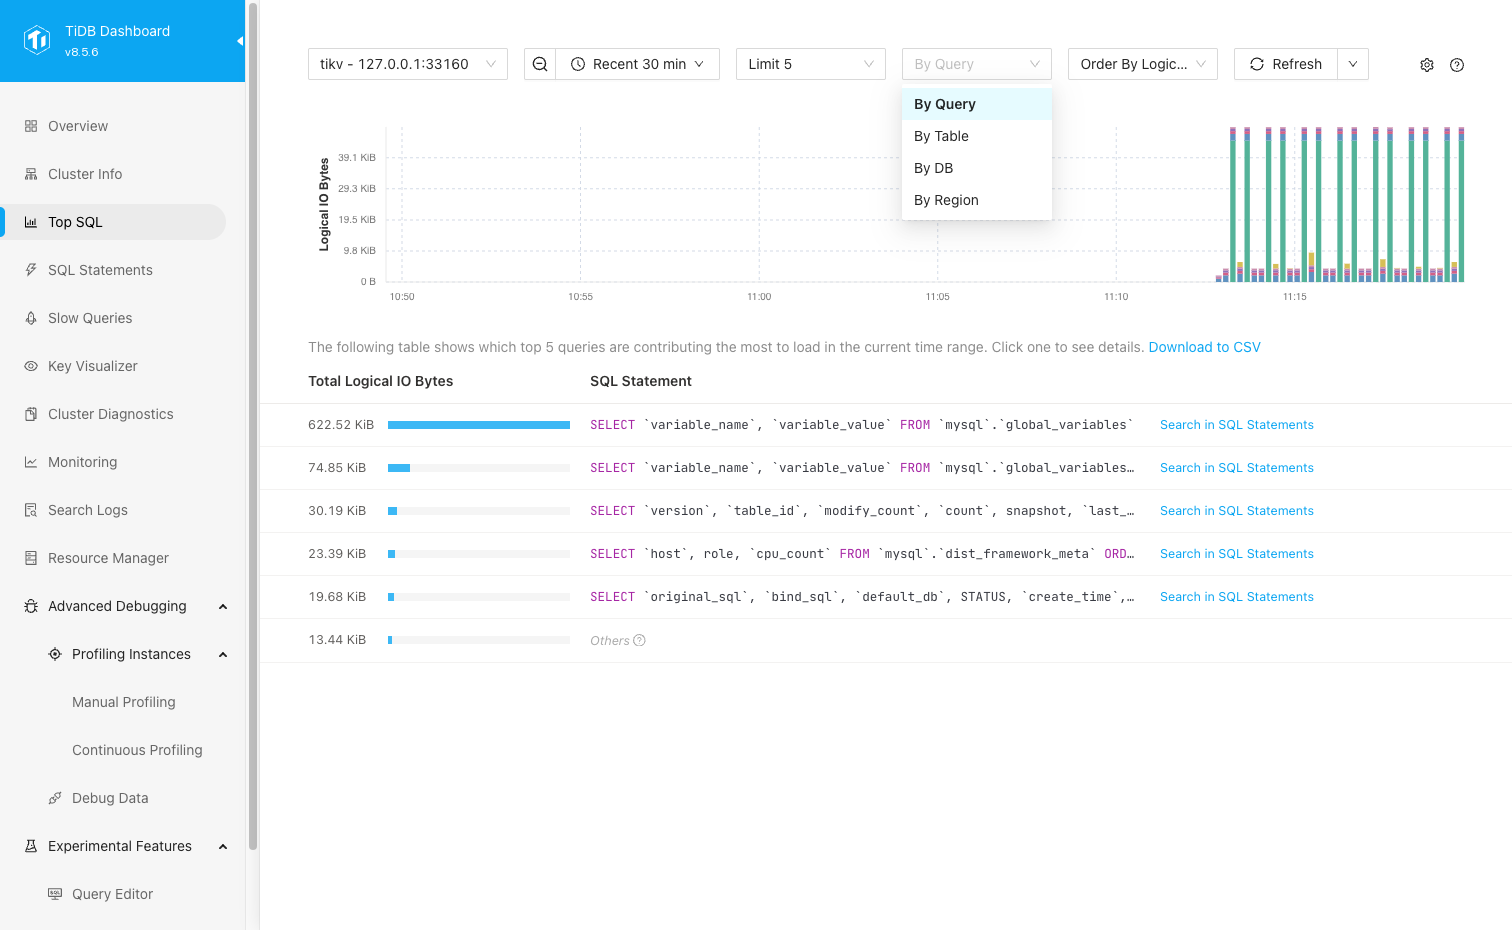
The default sort order is
Order By CPU(sorted by CPU time). If you select a TiKV node and have enabled TiKV Network IO collection (multi-dimensional), you can also selectOrder By Network(sorted by network bytes) orOrder By Logical IO(sorted by logical IO bytes).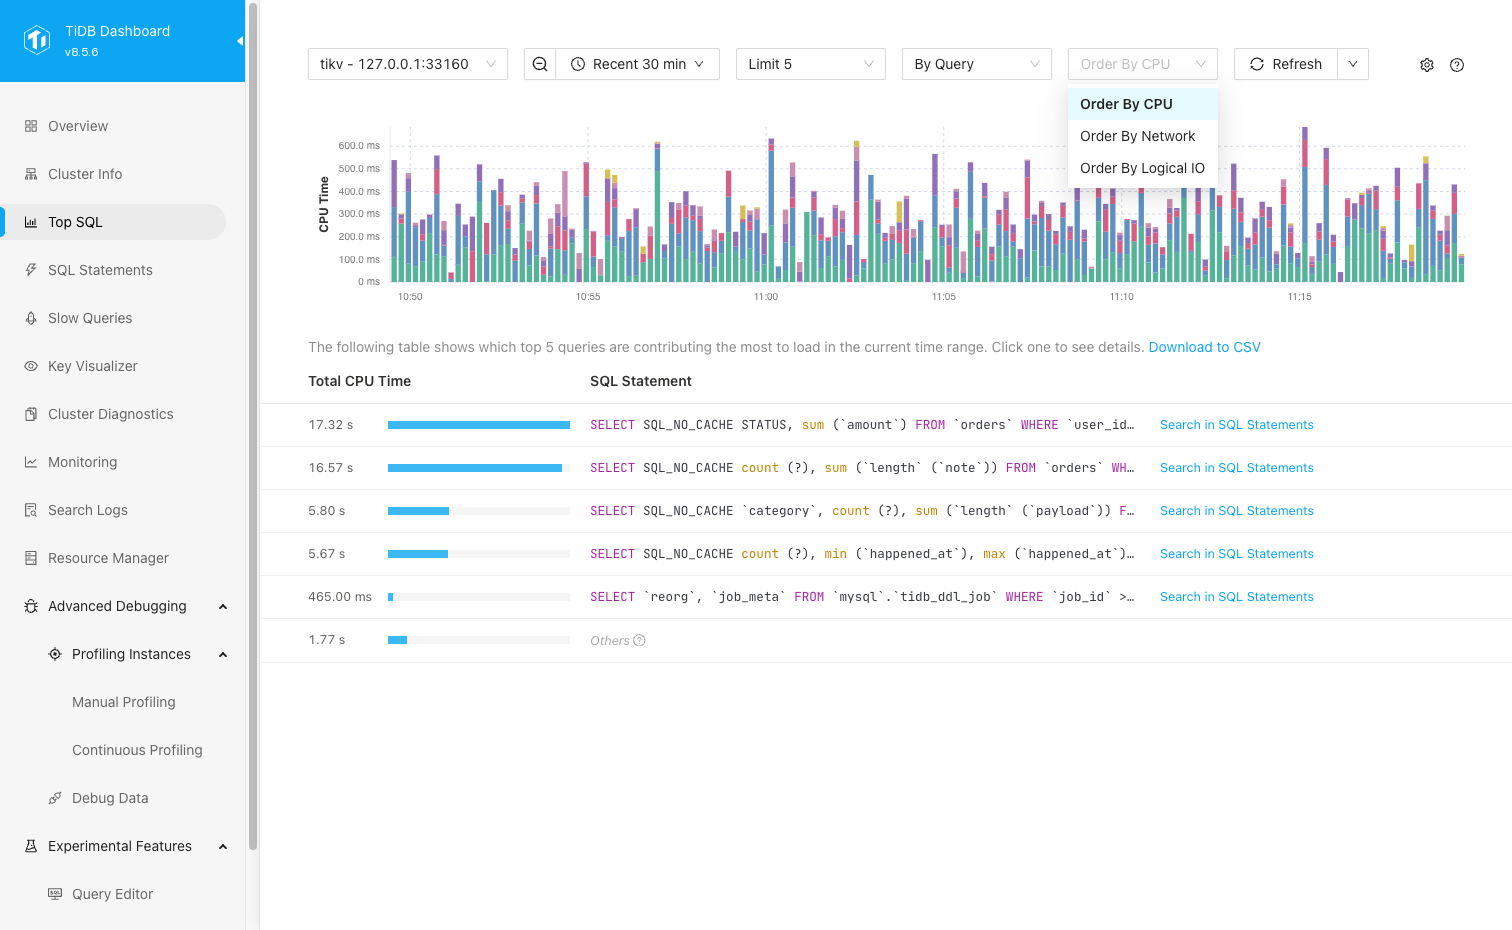
Observe the resource consumption hotspot records in the chart and table.
The bar chart shows resource consumption under the current sort dimension, with different colors representing different records. The table displays cumulative values according to the current sort dimension, and provides an
Othersrow at the end to summarize all non-Top N records.In the
By Queryview, click a row in the table to view the execution plan details for that type of SQL.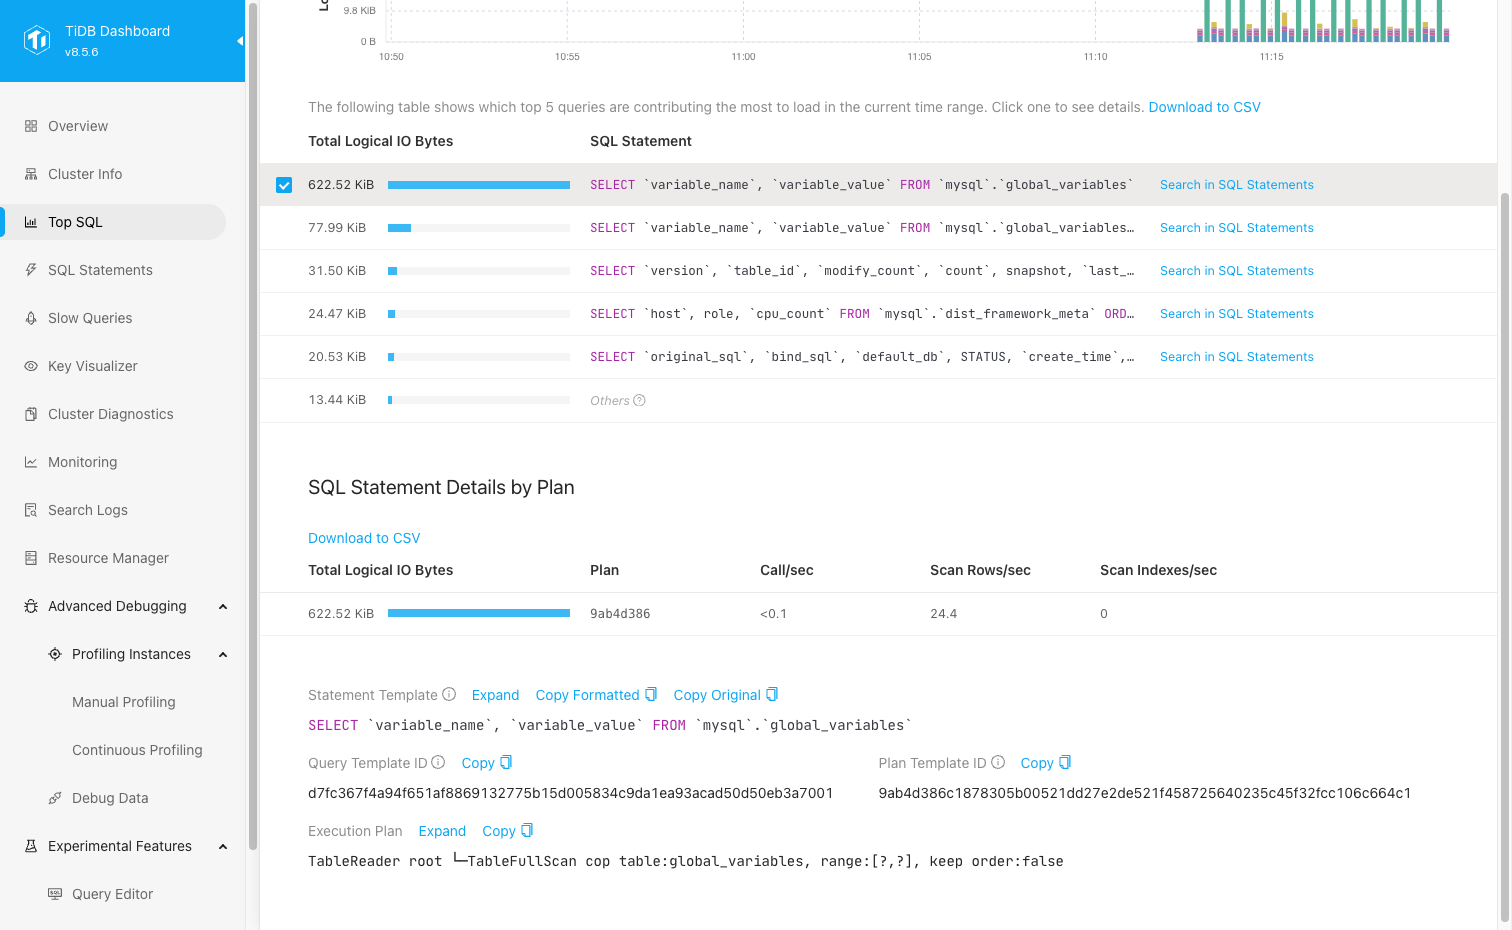
In the SQL statement details, you can view the corresponding SQL template, Query template ID, Plan template ID, and execution plan text. The SQL statement details table displays different metrics depending on the node type:
- TiDB nodes usually show
Call/secandLatency/call. - TiKV nodes usually show
Call/sec,Scan Rows/sec, andScan Indexes/sec.
In the
By Queryview, you can also click Search in SQL Statements in the Top SQL table to jump to the corresponding SQL Statement Analysis page. If you need to analyze the current table results offline, you can click Download to CSV above the table to export the current table data.- TiDB nodes usually show
On TiKV nodes, if you need to locate hotspots from a higher dimension, you can switch to
By Table,By DB, orBy Regionto view the aggregated results.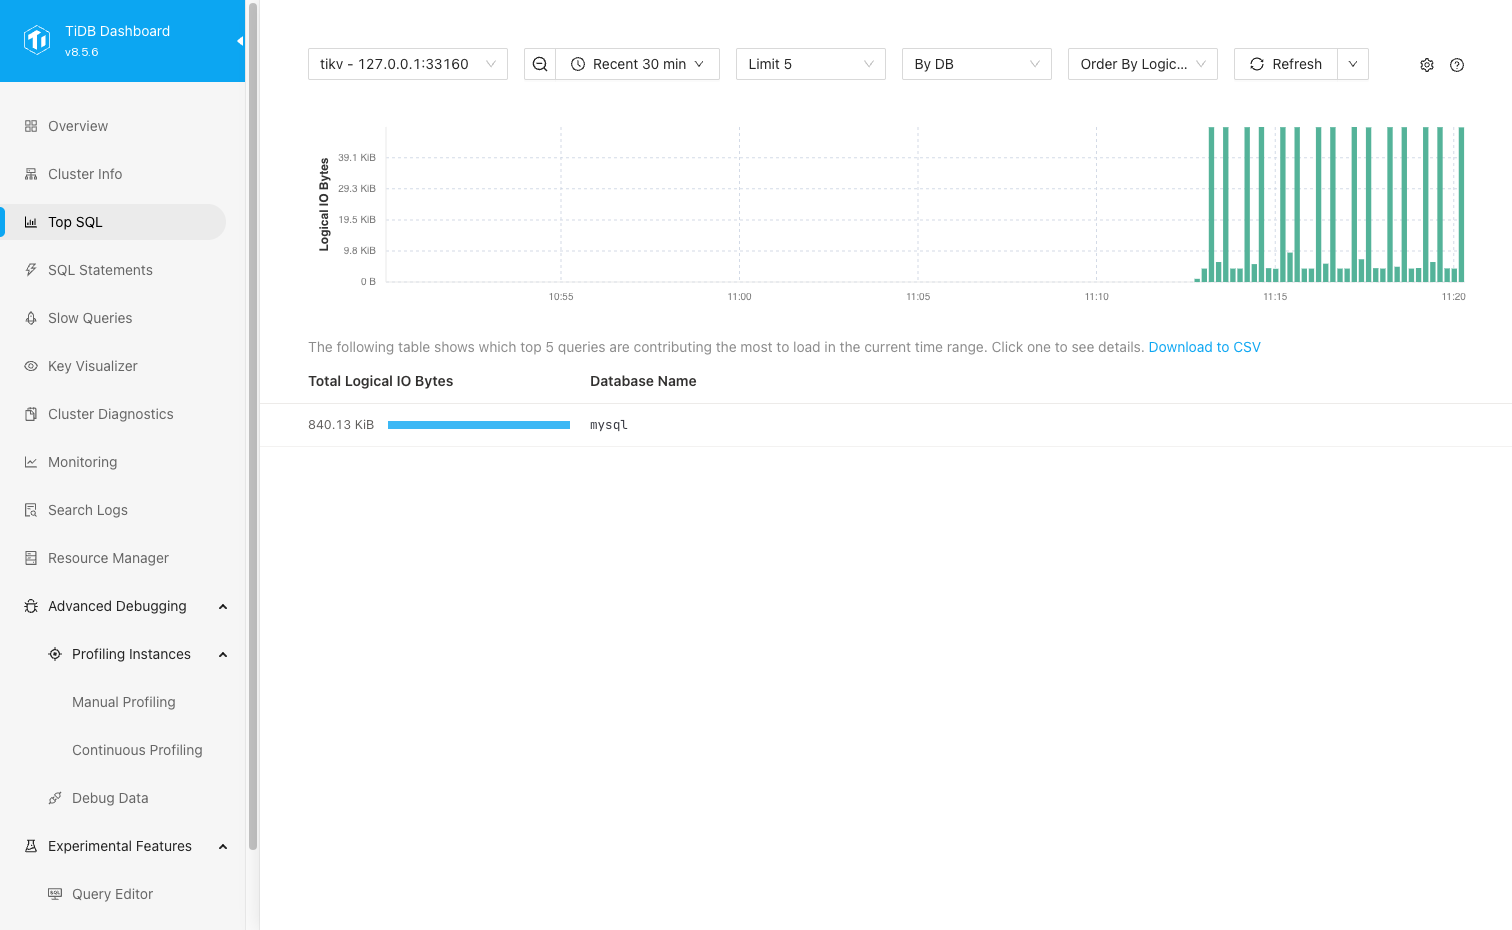
Based on these initial clues, you can further analyze the root cause using the SQL Statement or Slow Queries page.
Disable Top SQL
You can disable this feature by following these steps:
- Visit the Top SQL page.
- Click the gear icon in the upper right corner to open the settings pane and disable the Enable Feature switch.
- Click Save.
- In the popped-up dialog box, click Disable.
After you disable Top SQL, new Top SQL data collection will stop, but historical data can still be viewed before it expires.
In addition to the UI, you can also disable the Top SQL feature by setting the TiDB system variable tidb_enable_top_sql:
SET GLOBAL tidb_enable_top_sql = 0;
Disable TiKV Network IO collection
If you only want to stop collecting multi-dimensional data such as Network Bytes and Logical IO Bytes for TiKV, while retaining the CPU dimension analysis capability of Top SQL, disable the Enable TiKV Network IO collection (multi-dimensional) switch in the Top SQL settings panel.
After disabling:
- The Top SQL page can still display previously collected, unexpired historical network IO and logical IO data.
- New network IO and logical IO data, as well as
By Regiondata, will no longer be collected.
Frequently asked questions
1. Top SQL cannot be enabled and the UI displays "required component NgMonitoring is not started".
See TiDB Dashboard FAQ.
2. Will performance be affected after enabling Top SQL?
Enabling Top SQL has a slight impact on cluster performance. According to measurements, the average performance impact is less than 3%. If you also enable TiKV Network IO collection (multi-dimensional), there will be additional storage and query overhead.
3. What is the status of this feature?
It is now a generally available (GA) feature and can be used in production environments.
4. What does Others mean in the UI?
Others represents the summary result of all non-Top N records under the current sort dimension. You can use it to understand how much of the total workload comes from the Top N records.
5. What is the relationship between the CPU overhead displayed by Top SQL and the actual CPU usage of the process?
Their correlation is strong but they are not exactly the same thing. For example, the cost of writing multiple replicas is not counted in the TiKV CPU overhead displayed by Top SQL. In general, SQL statements with higher CPU usage result in higher CPU overhead displayed in Top SQL.
6. What does the Y-axis of the Top SQL chart mean?
The Y-axis of the Top SQL chart represents the resource consumption under the current sort dimension.
- When
Order By CPUis selected, the Y-axis represents CPU time. - When
Order By Networkis selected, the Y-axis represents network bytes. - When
Order By Logical IOis selected, the Y-axis represents logical IO bytes.
7. Does Top SQL collect running (unfinished) SQL statements?
Yes. After you enable Top SQL, TiDB Dashboard collects resource consumption for all running SQL statements, including unfinished ones.
8. Why is there no new data for Order By Network, Order By Logical IO, or By Region?
These views depend on TiKV Network IO collection (multi-dimensional). You can check the following items:
- You have selected a TiKV node.
- The Enable TiKV Network IO collection (multi-dimensional) switch in the Top SQL settings panel is enabled.
- The relevant TiKV nodes in the cluster have all successfully enabled this configuration. If only some nodes enable this configuration, the Top SQL page prompts that new data might be incomplete.
- For newly added TiKV nodes, you need to manually enable the Enable TiKV Network IO collection (multi-dimensional) switch in the Top SQL settings panel and save again. To make this setting automatically enabled for newly added nodes, also enable
resource-metering.enable-network-io-collectionin the TiKV default configuration of TiUP.