Slow Queries Page of TiDB Dashboard
On the Slow Queries page of TiDB Dashboard, you can search and view all slow queries in the cluster.
By default, SQL queries with an execution time of more than 300 milliseconds are considered as slow queries. These queries are recorded in the slow query logs and can be searched via TiDB Dashboard. You can adjust the threshold of slow queries through the tidb_slow_log_threshold session variable or the instance.tidb_slow_log_threshold TiDB parameter.
Access the page
You can use one of the following two methods to access the slow query page:
After logging in to TiDB Dashboard, click Slow Queries in the left navigation menu.
Visit http://127.0.0.1:2379/dashboard/#/slow_query in your browser. Replace
127.0.0.1:2379with the actual PD address and port.
All data displayed on the slow query page comes from TiDB slow query system tables and slow query logs. See slow query logs for details.
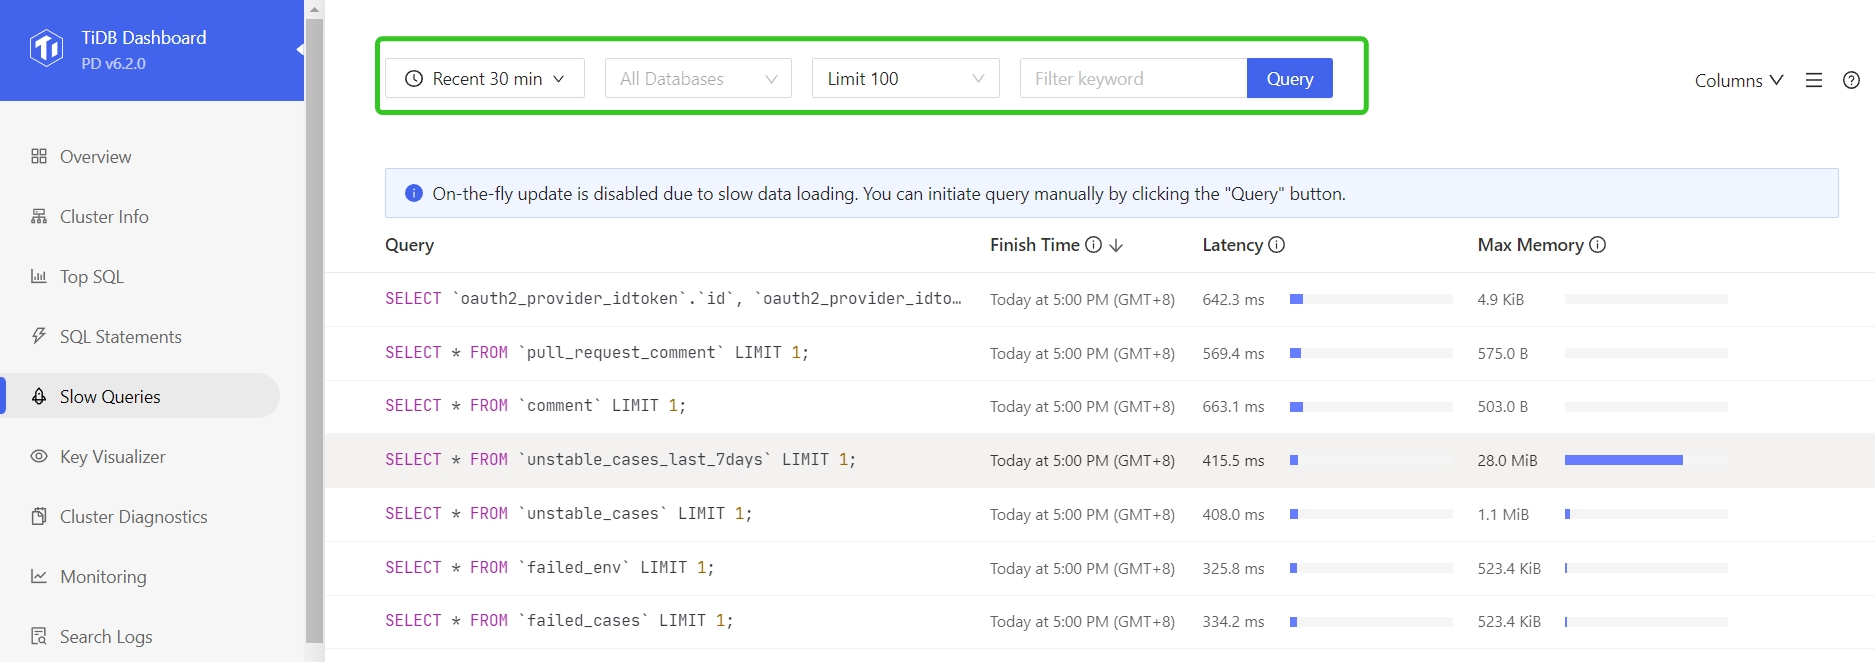
Change filters
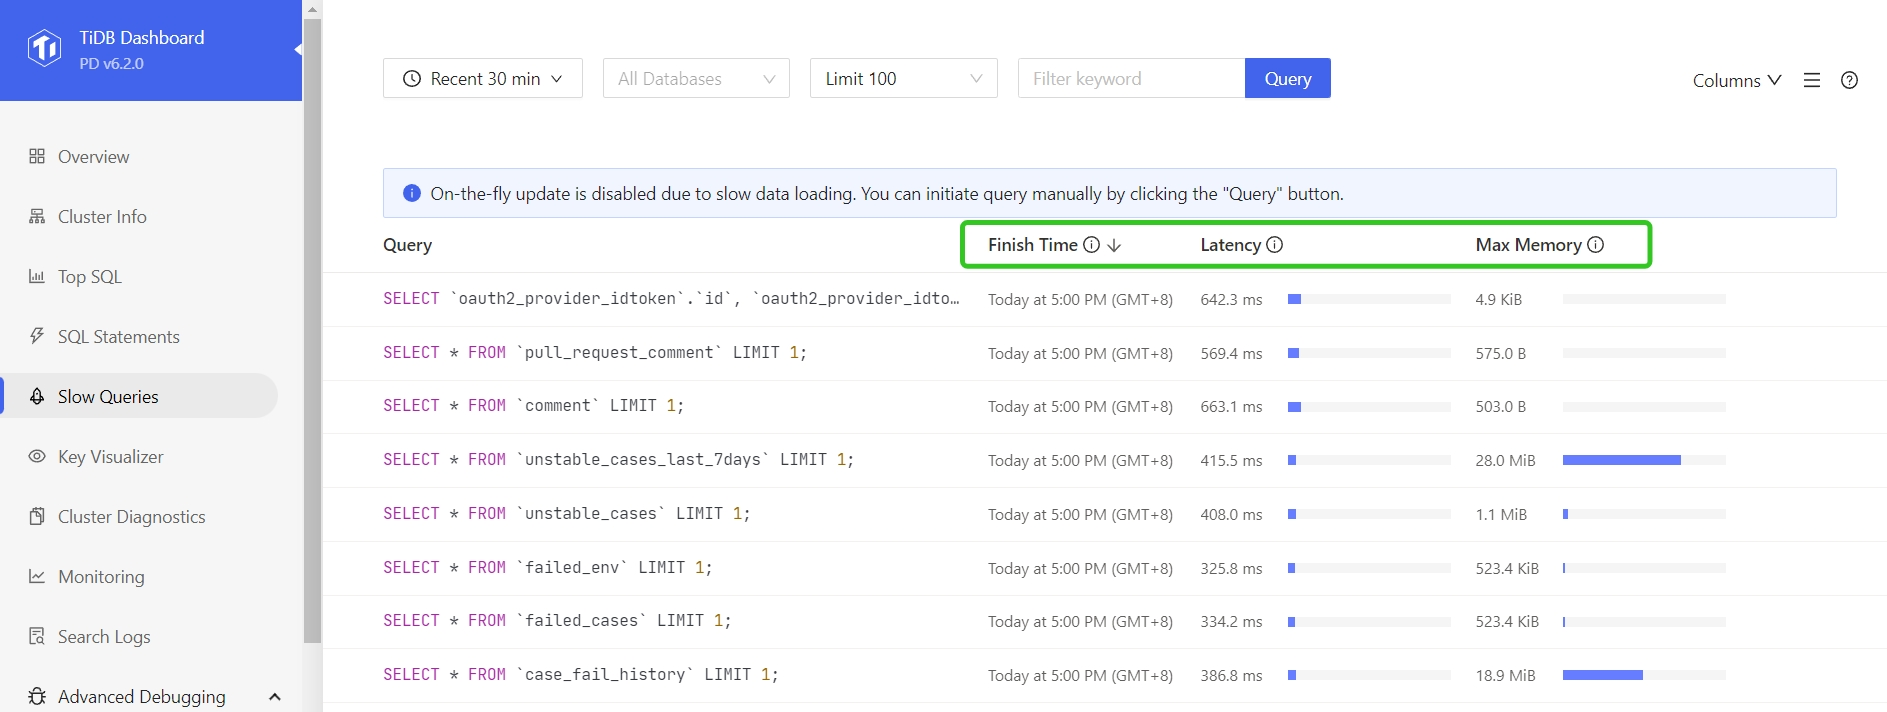
You can filter slow queries based on the time range, the related database, SQL keywords, SQL types, the number of slow queries to be displayed. In the image below, 100 slow queries over the recent 30 minutes are displayed by default.
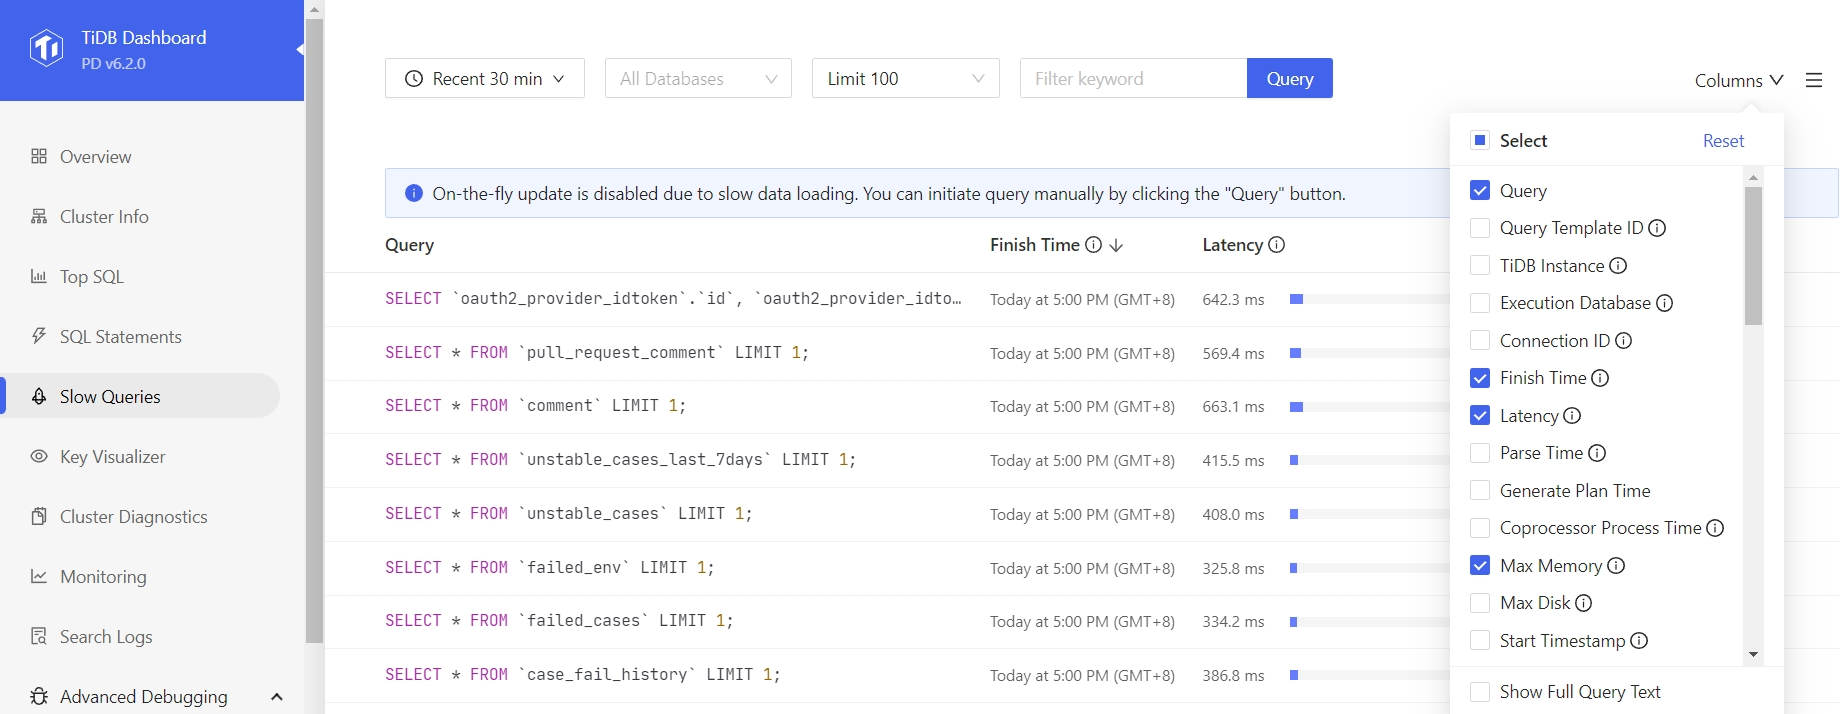
Display more columns
Click Columns on the page and you can choose to see more columns. You can move your mouse to the (i) icon at the right side of a column name to view the description of this column:
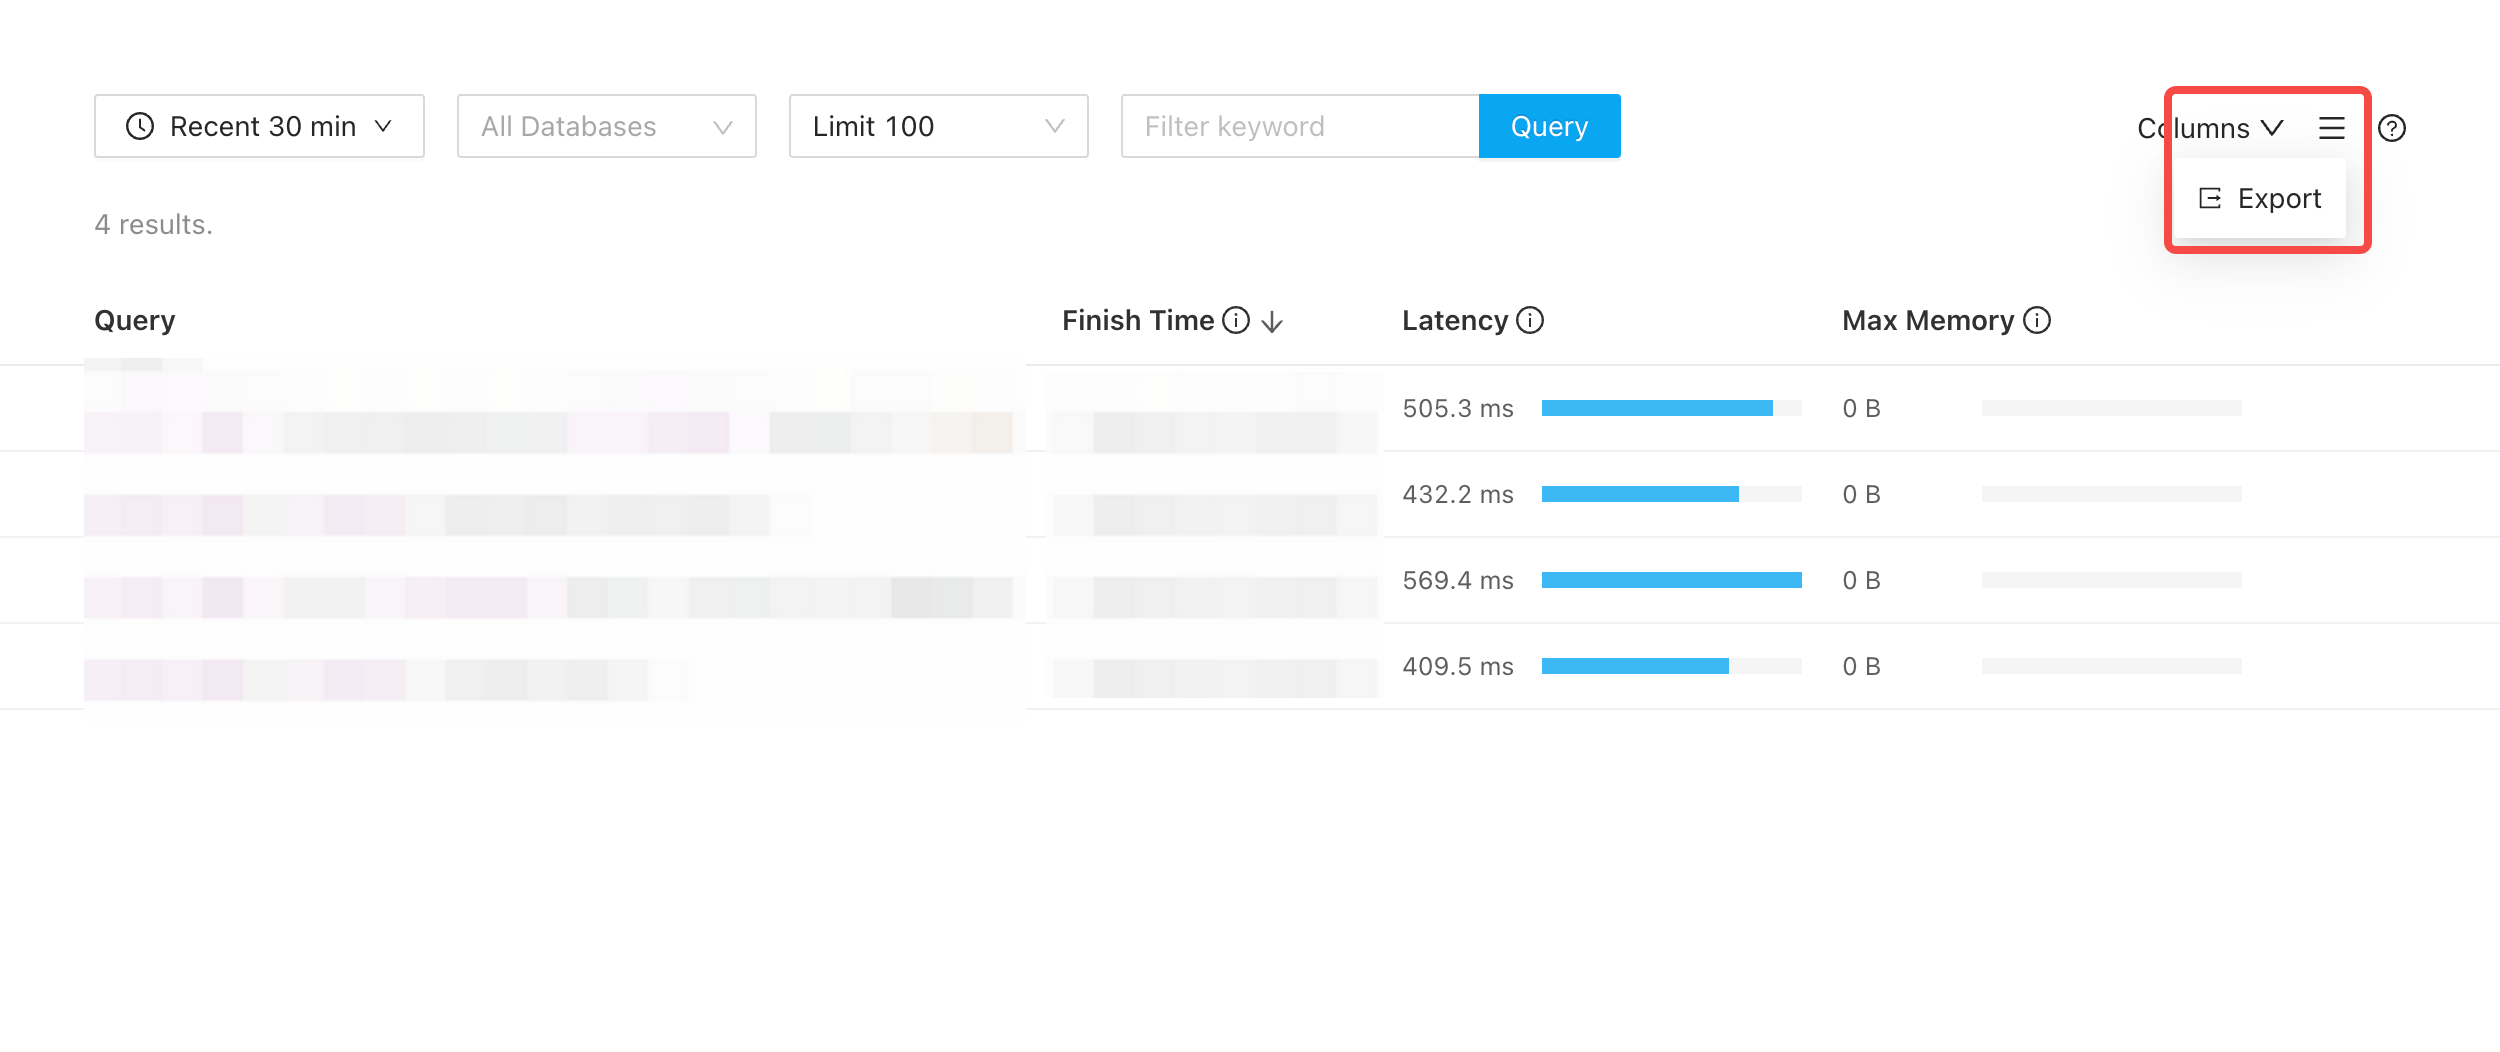
Export slow queries locally
Click ☰ (More) in the upper-right corner of the page to display the Export option. After you click Export, TiDB Dashboard exports slow queries in the current list as a CSV file.
Sort by column
By default, the list is sorted by Finish Time in the descending order. Click column headings to sort by the column or switch the sorting order:
View execution details
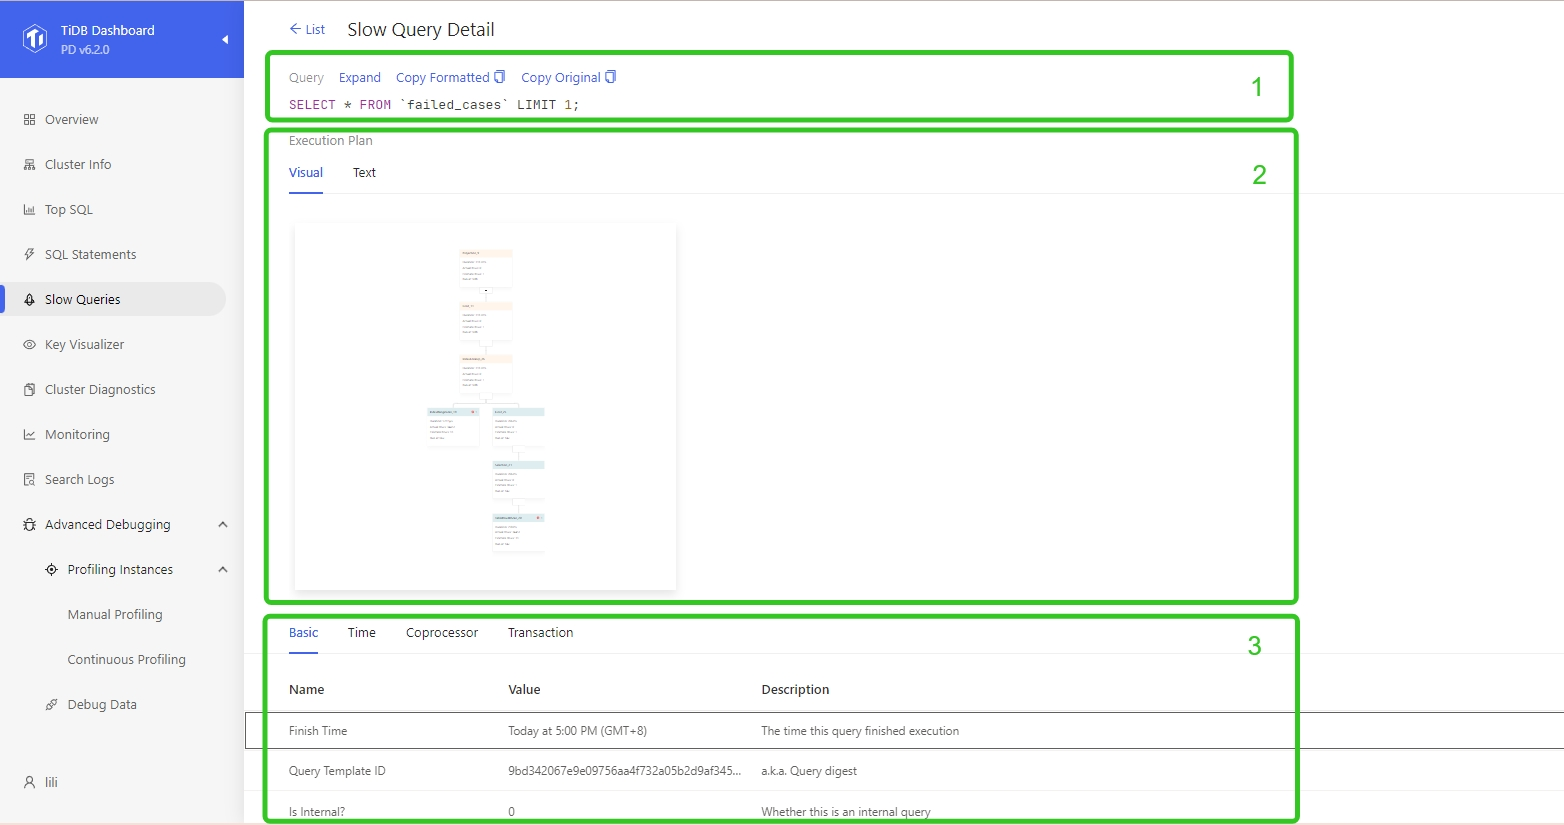
Click any item in the list to display detailed execution information of the slow query, including:
- Query: The text of the SQL statement (area 1 in the following figure)
- Plan: The execution plan of the slow query (area 2 in the following figure)
- Other sorted SQL execution information (area 3 in the following figure)
SQL
Click the Expand button to view the detailed information of an item. Click the Copy button to copy the detailed information to the clipboard.
Execution plans
On TiDB Dashboard, you can view execution plans in three ways: table, text, and graph. To learn how to read an execution plan, see Understand the query execution plan.
Execution plan in table format
The table format provides detailed information about the execution plan, which helps you quickly identify abnormal operator metrics and compare the status of different operators. The following figure shows an execution plan in table format:
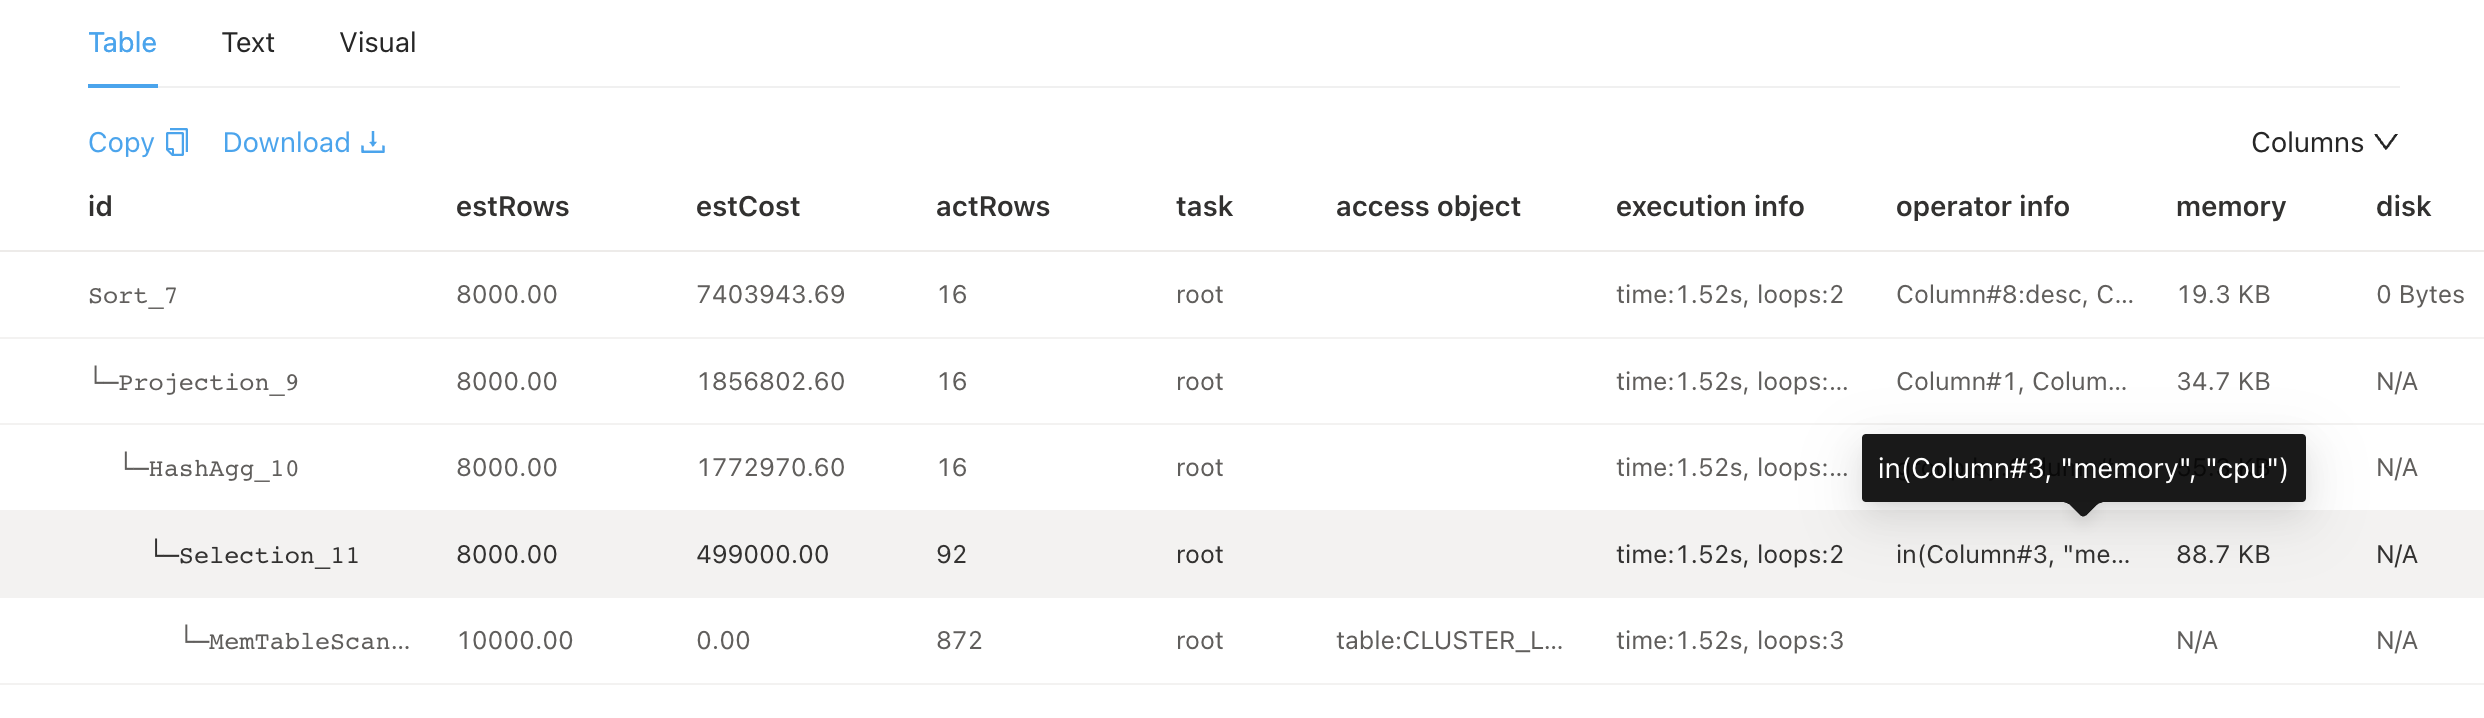
The table format displays similar information to the text format but provides more user-friendly interactions:
- You can adjust the column width freely.
- When content exceeds the column width, it is automatically truncated and a tooltip is shown for the full information.
- If the execution plan is large, you can download it as a text file for local analysis.
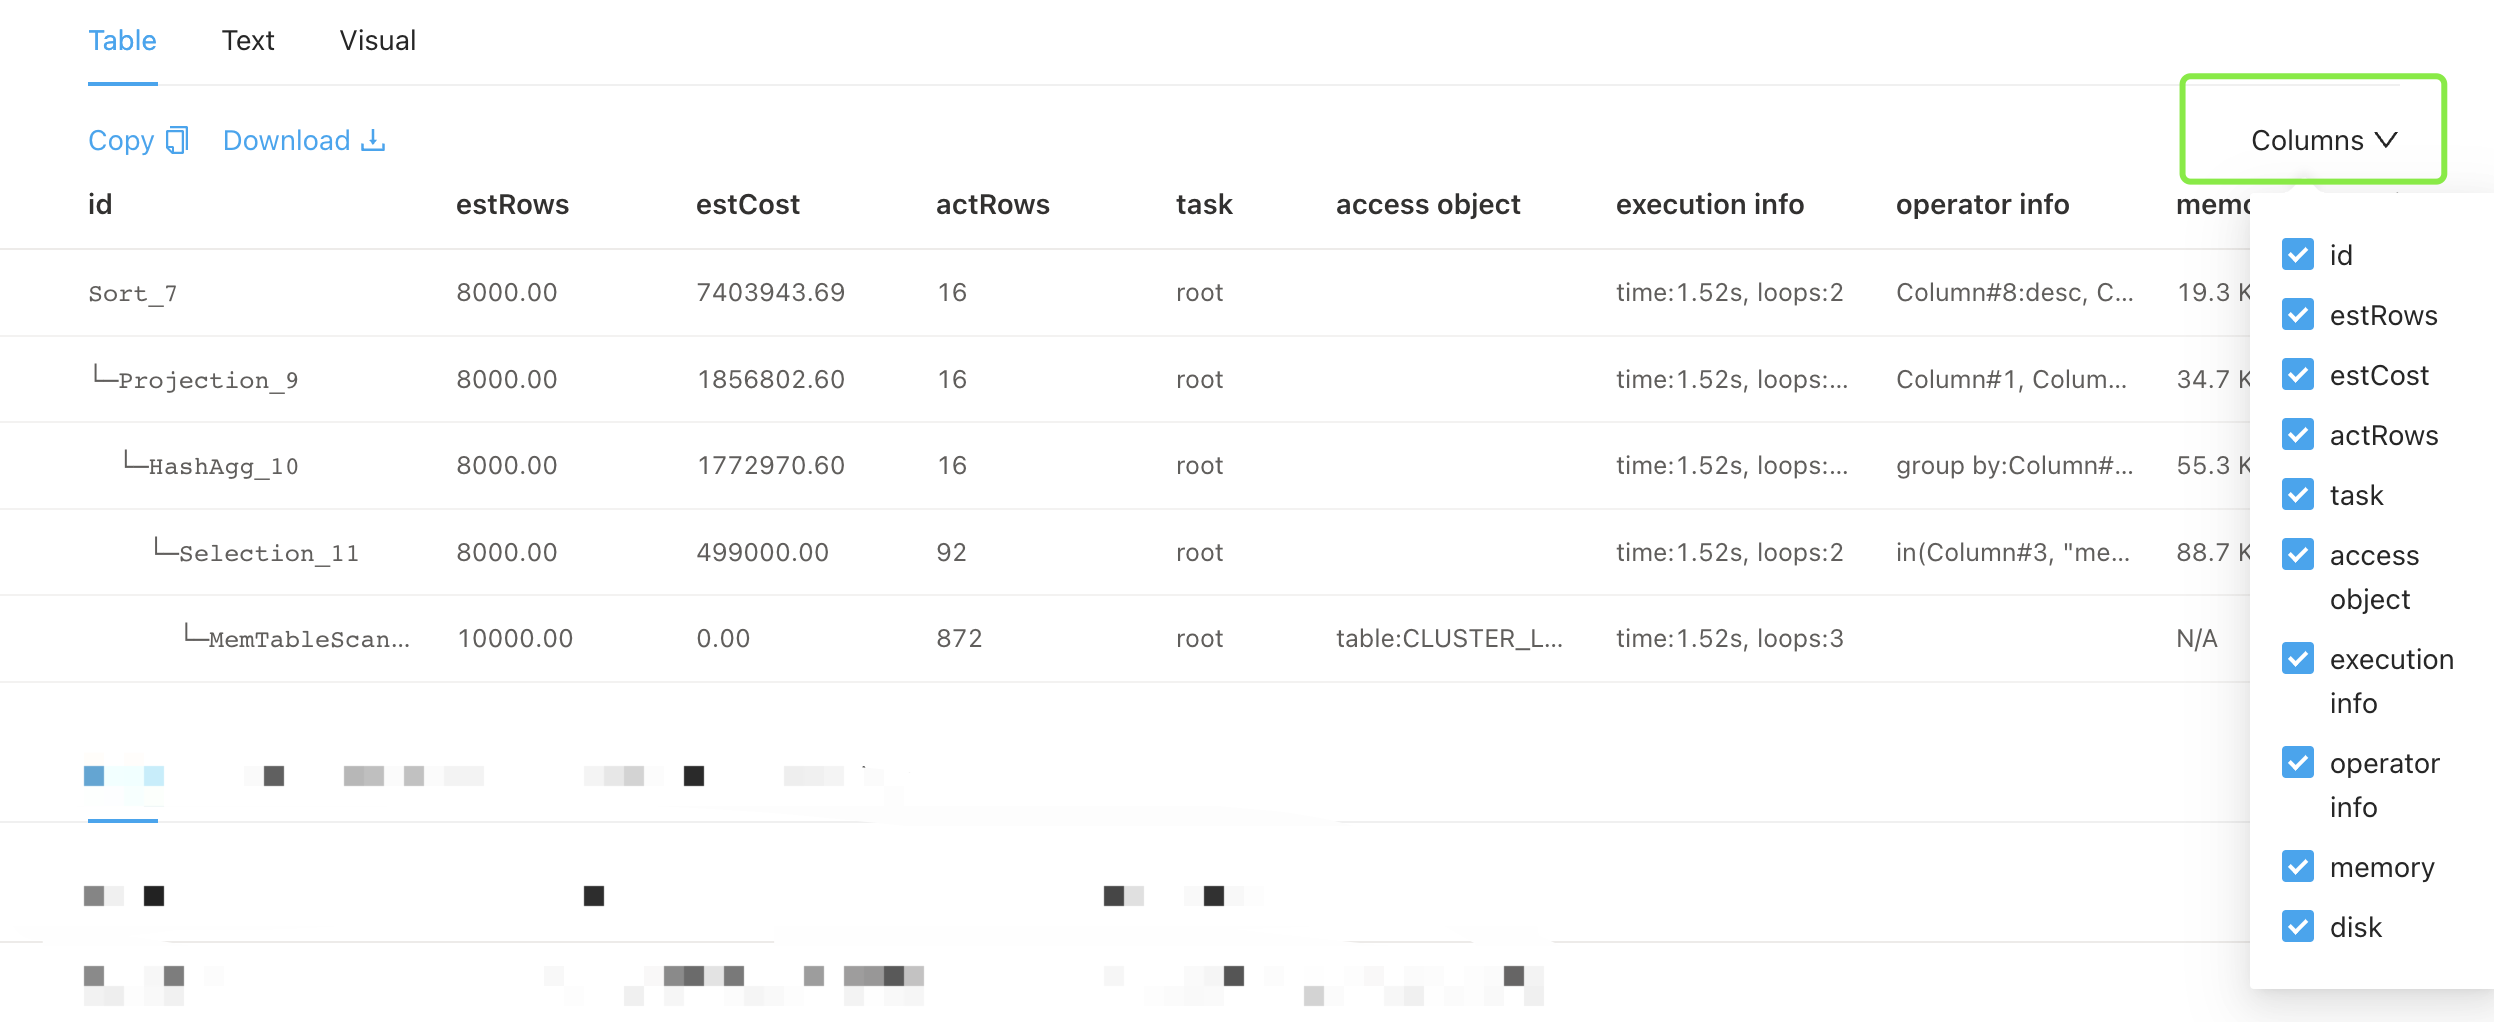
- You can hide and manage columns using the column picker.
Execution plan in graph format
The graph format is more suitable for viewing the execution plan tree of a complex SQL statement and understanding each operator and its corresponding content in detail. The following figure shows an execution plan in graph format:
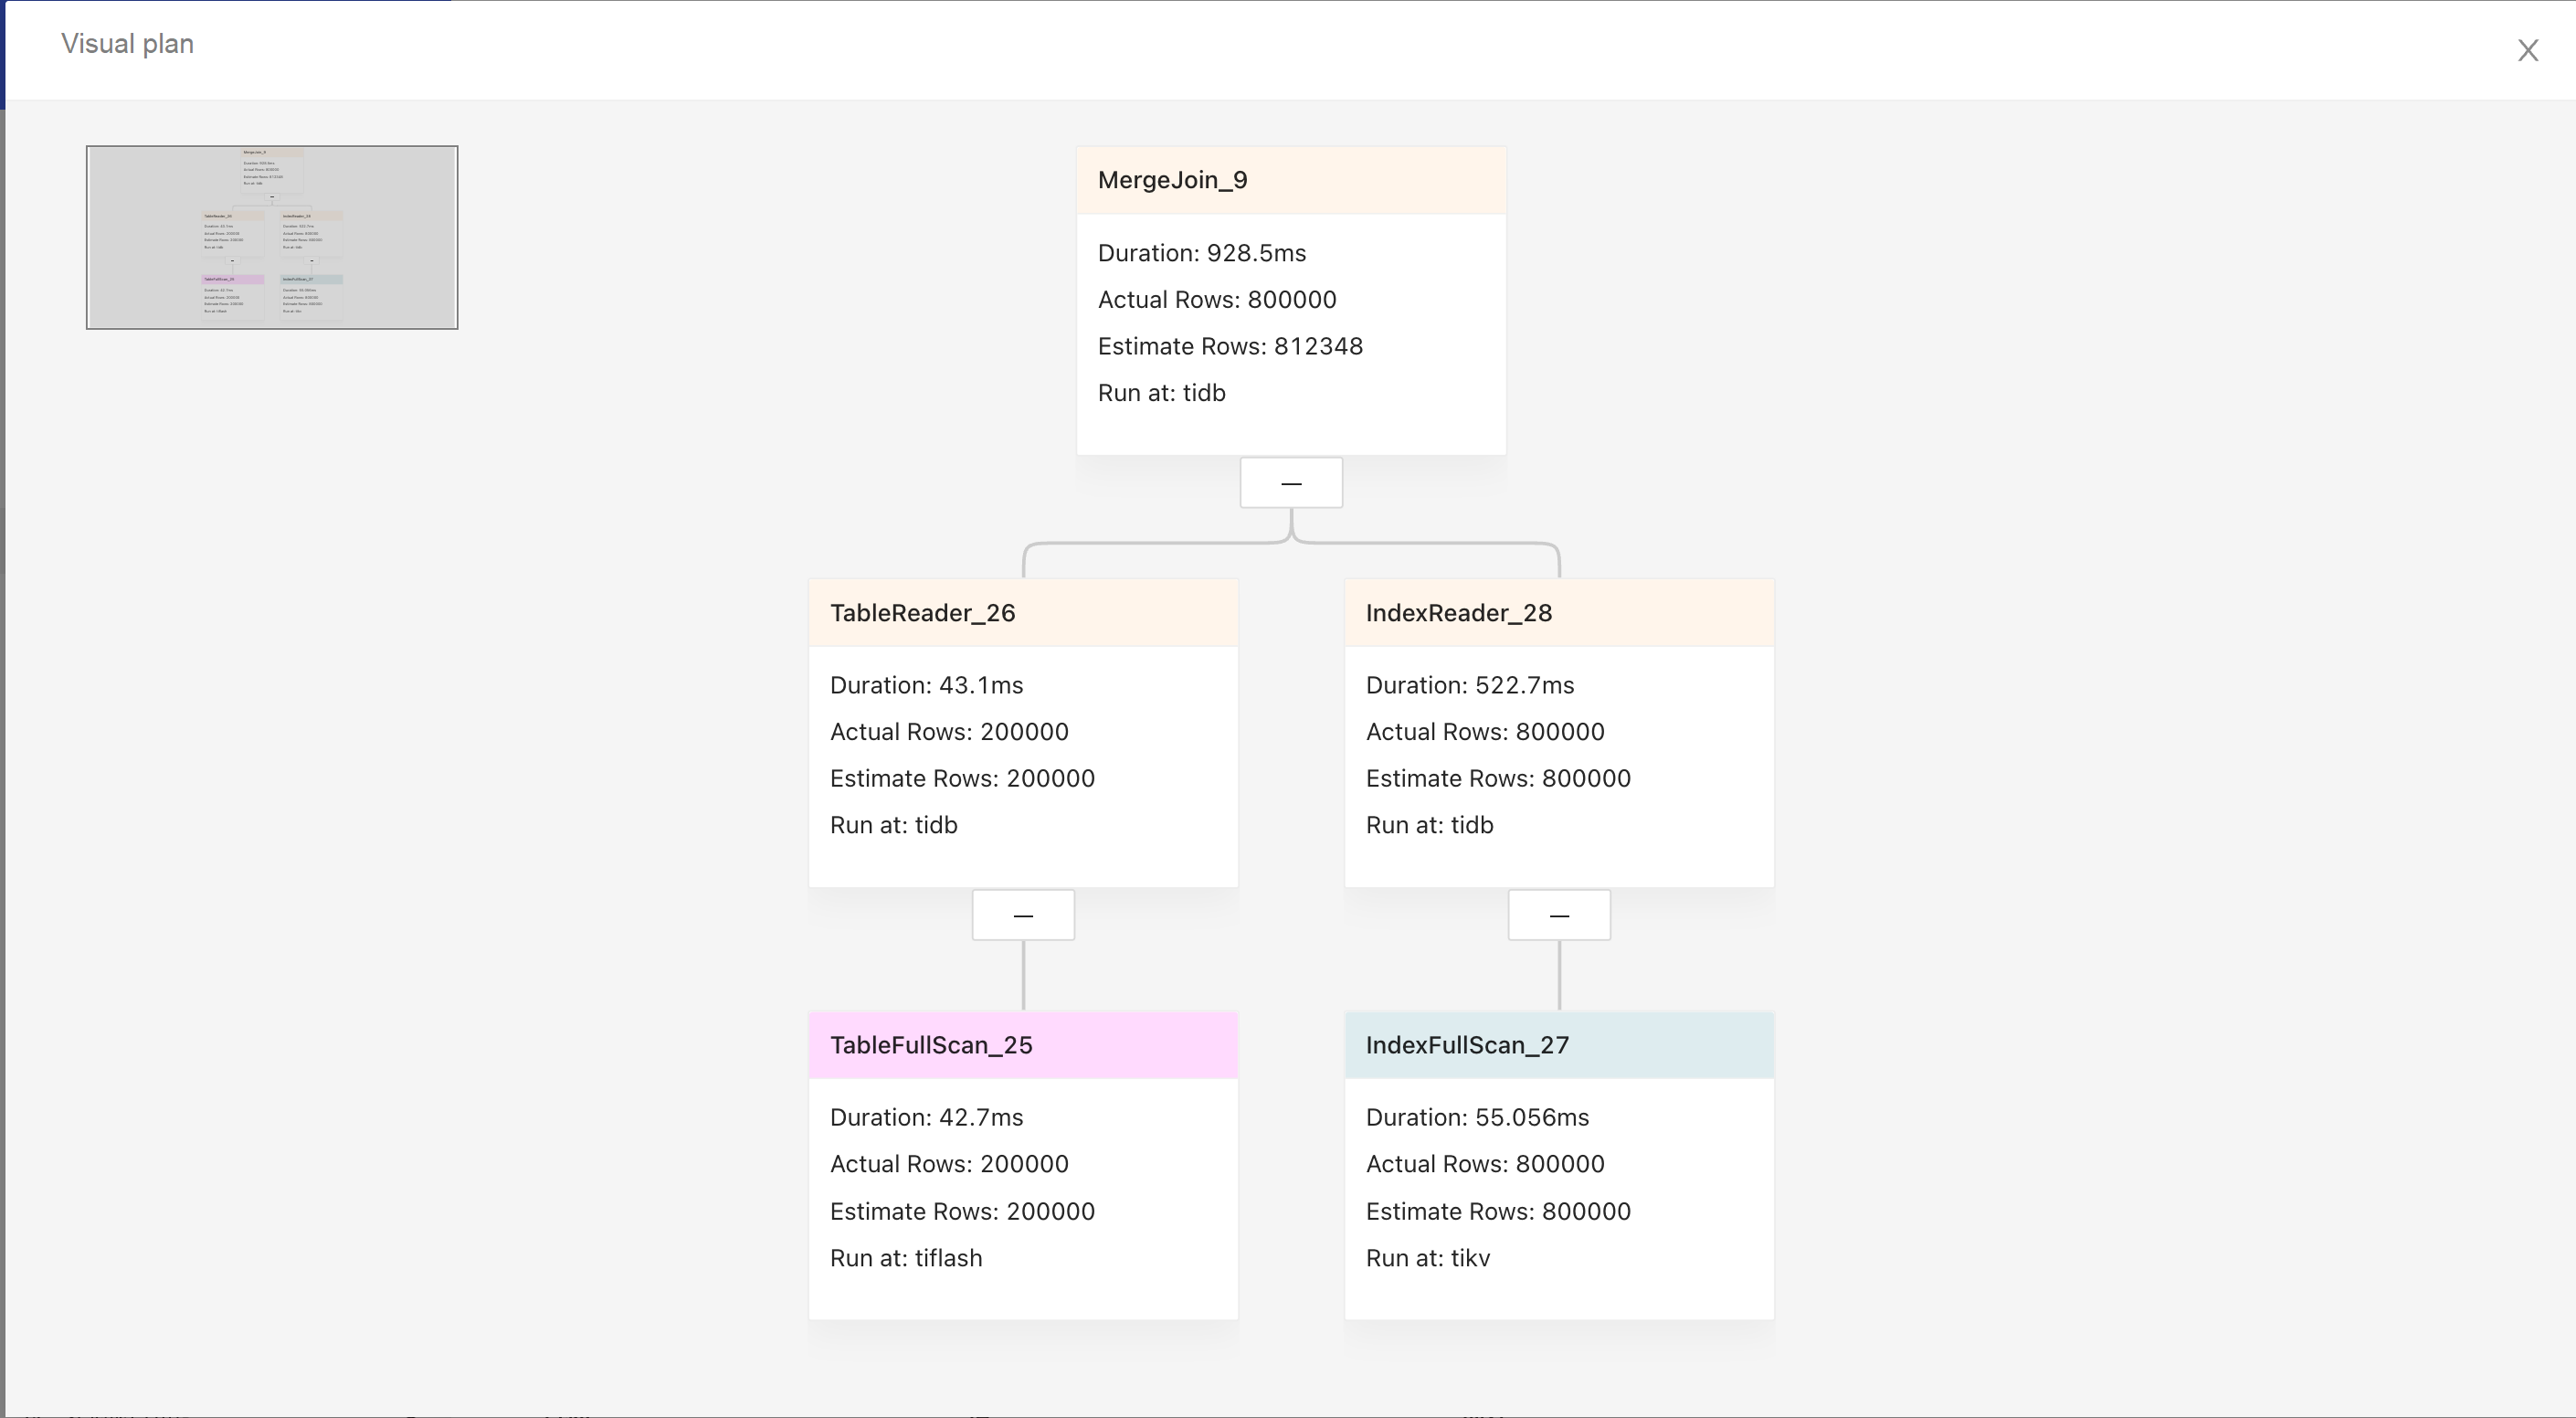
- The graph shows the execution from left to right, and from top to bottom.
- Upper nodes are parent operators and lower nodes are child operators.
- The color of the title bar indicates the component where the operator is executed: yellow stands for TiDB, blue stands for TiKV, and pink stands for TiFlash.
- The title bar shows the operator name and the text shown below is the basic information of the operator.
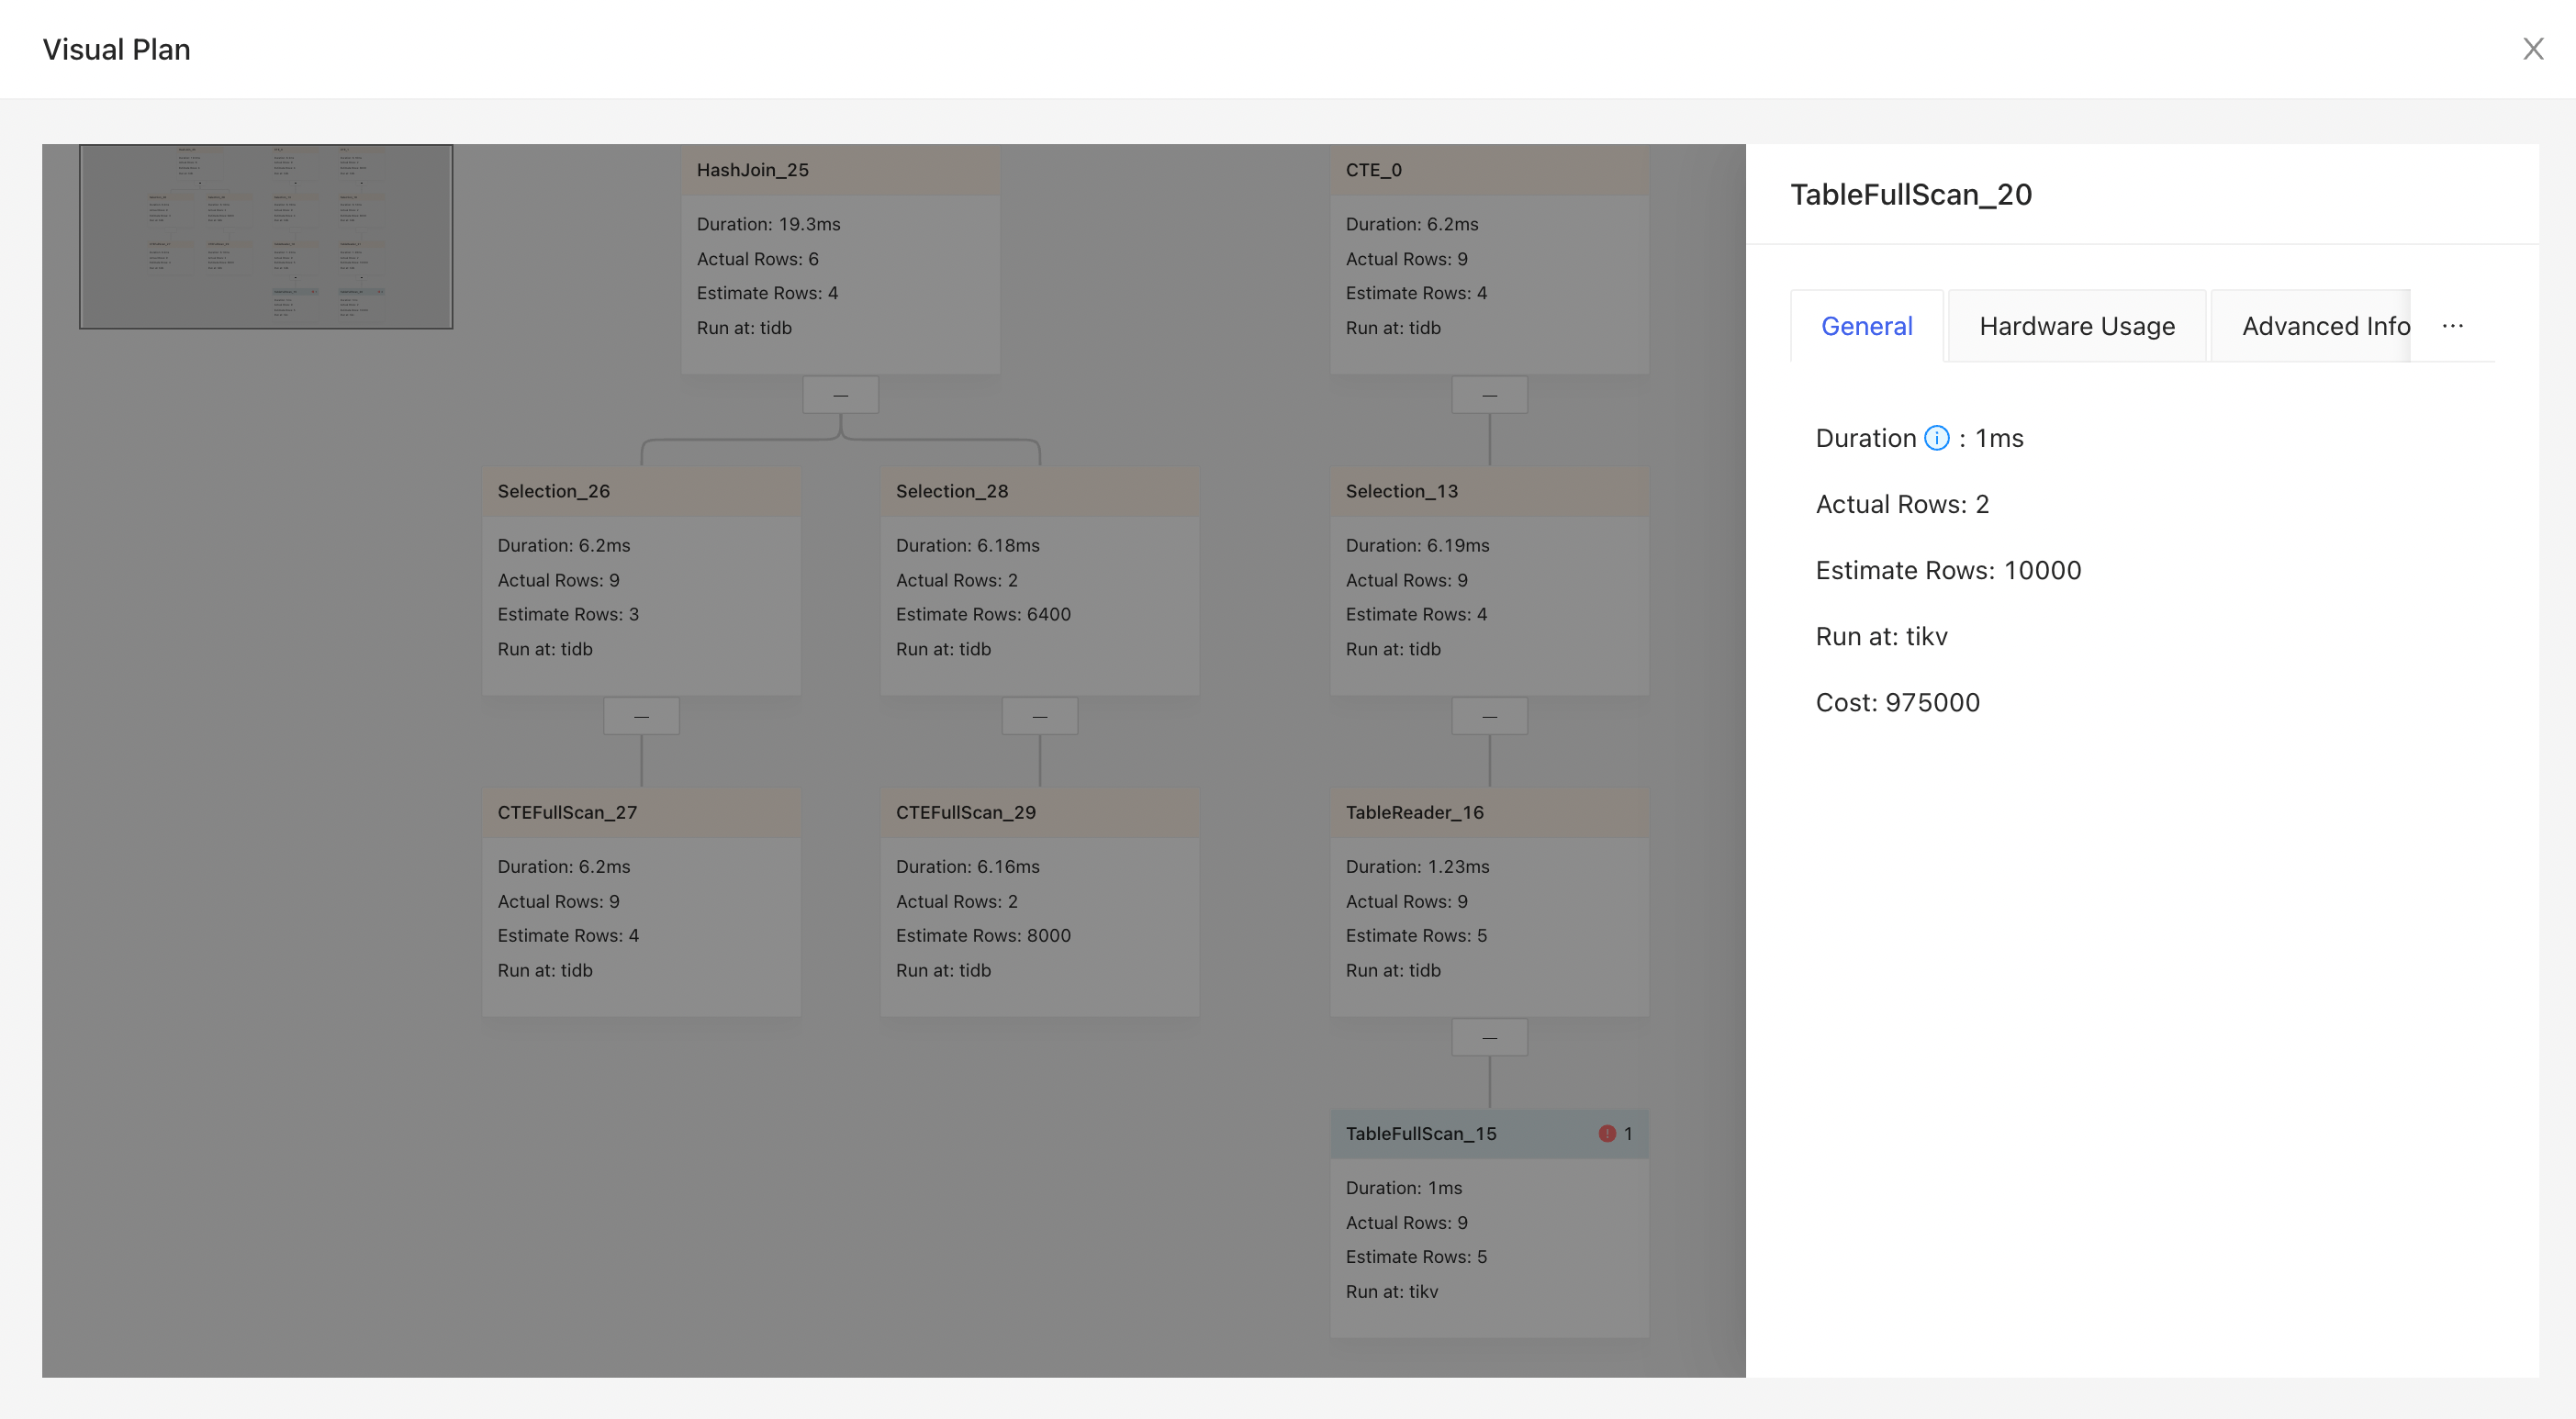
Click the node area, and the detailed operator information is displayed on the right sidebar.
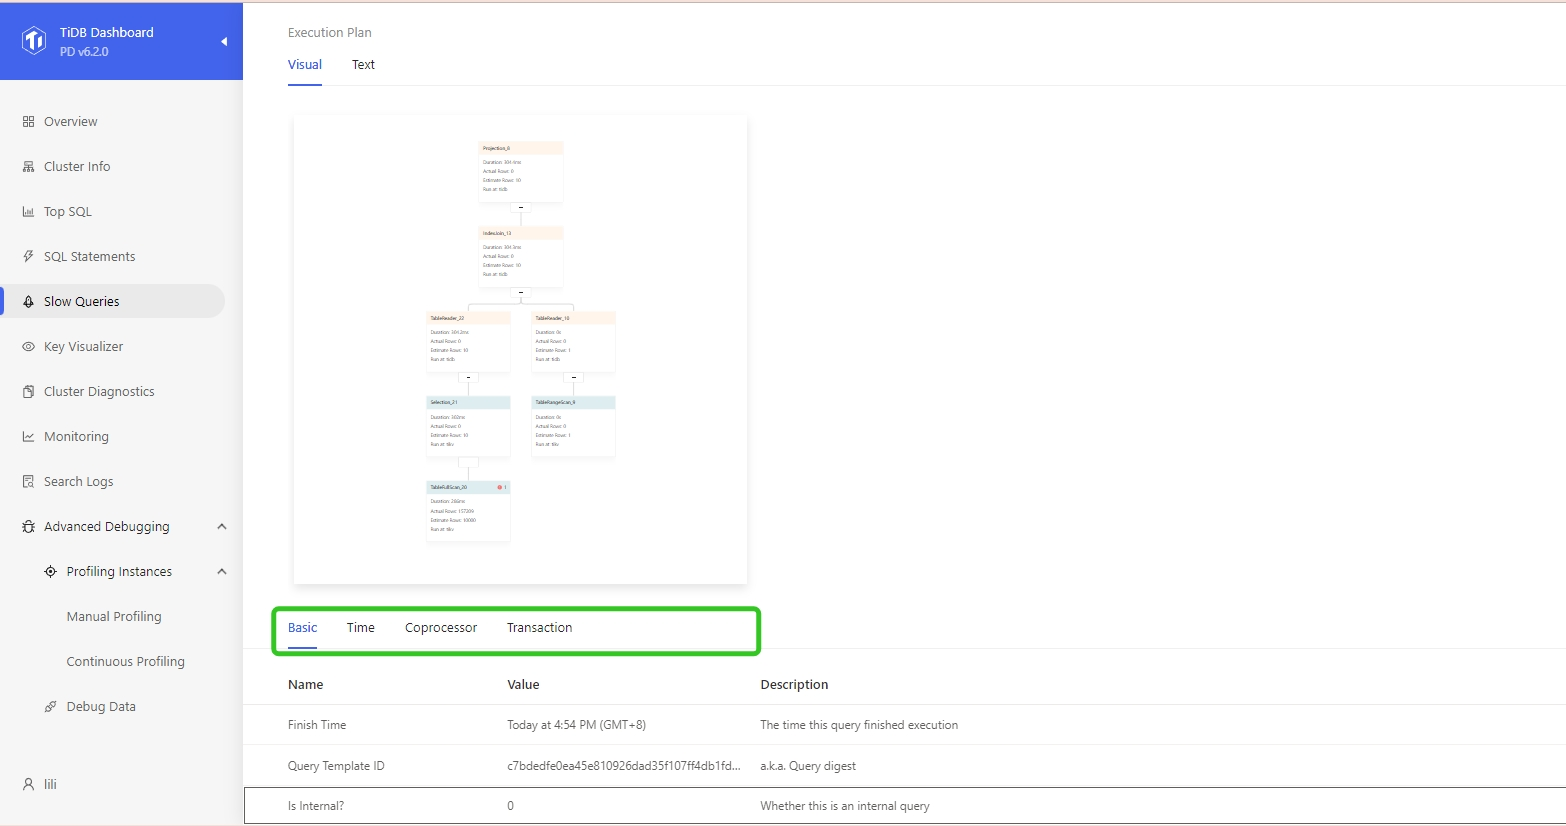
SQL execution details
For basic information, execution time, Coprocessor read, transaction, and slow query of the SQL statement, you can click the corresponding tab titles to switch among different information.
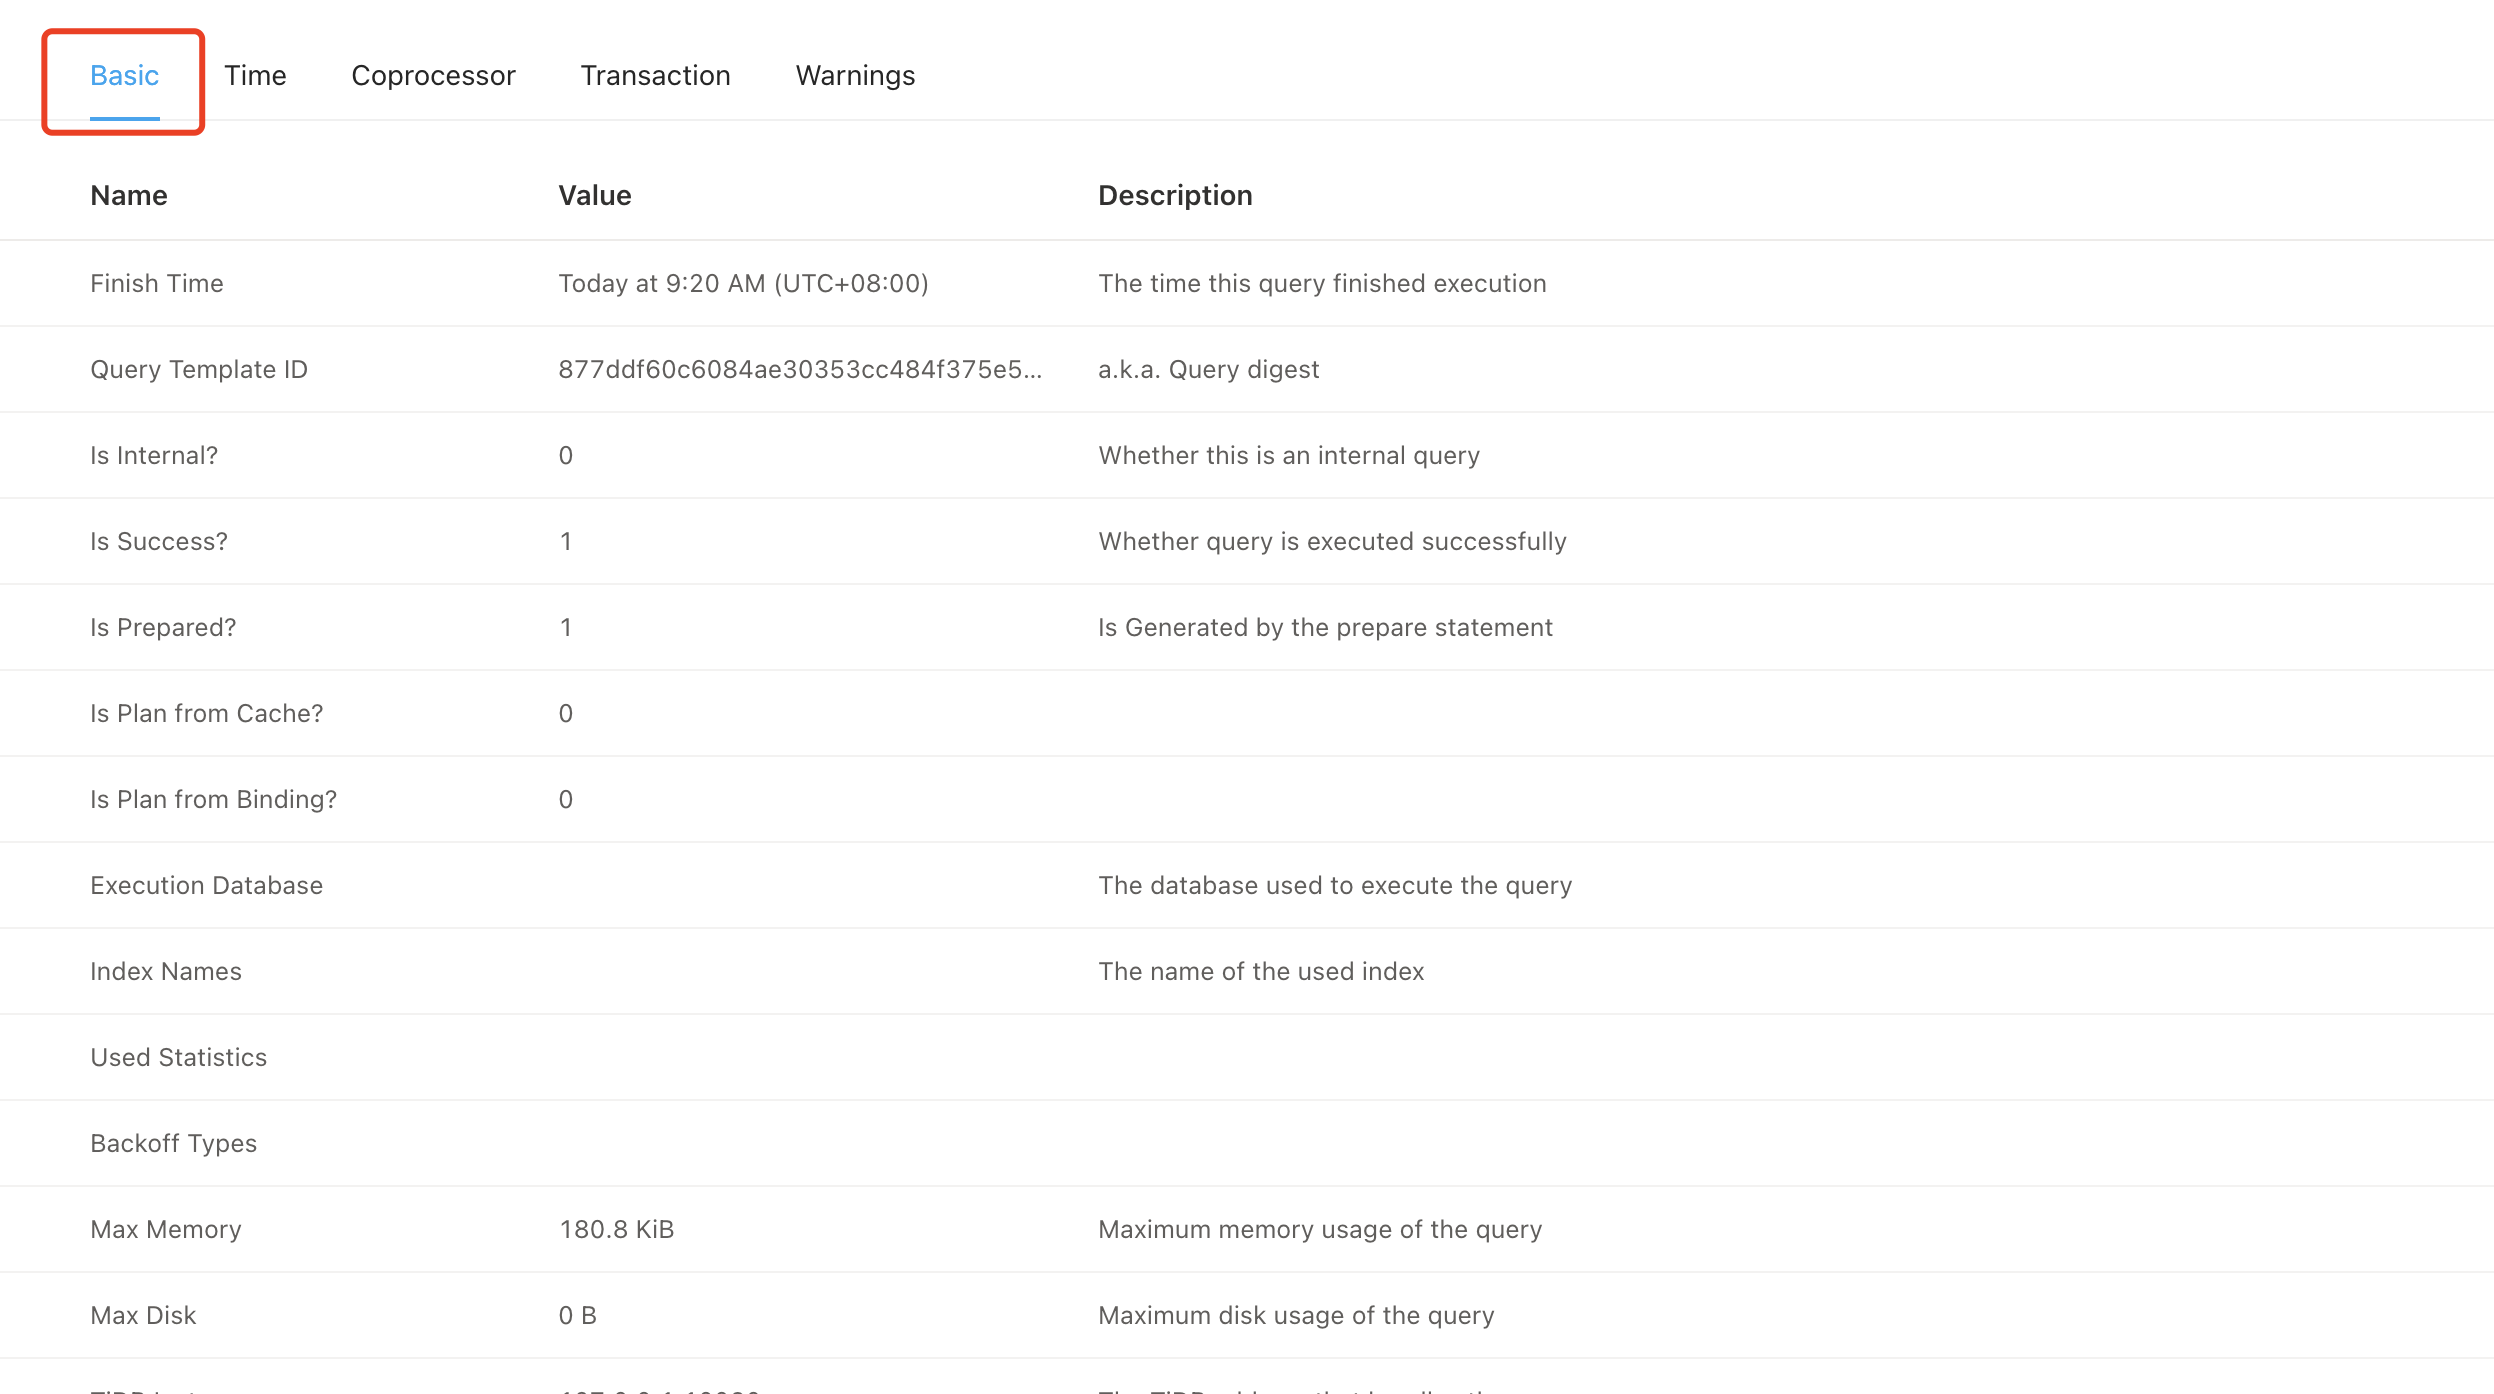
Basic tab
The basic information of a SQL execution includes the table names, index name, execution count, and total latency. The Description column provides detailed description of each field.
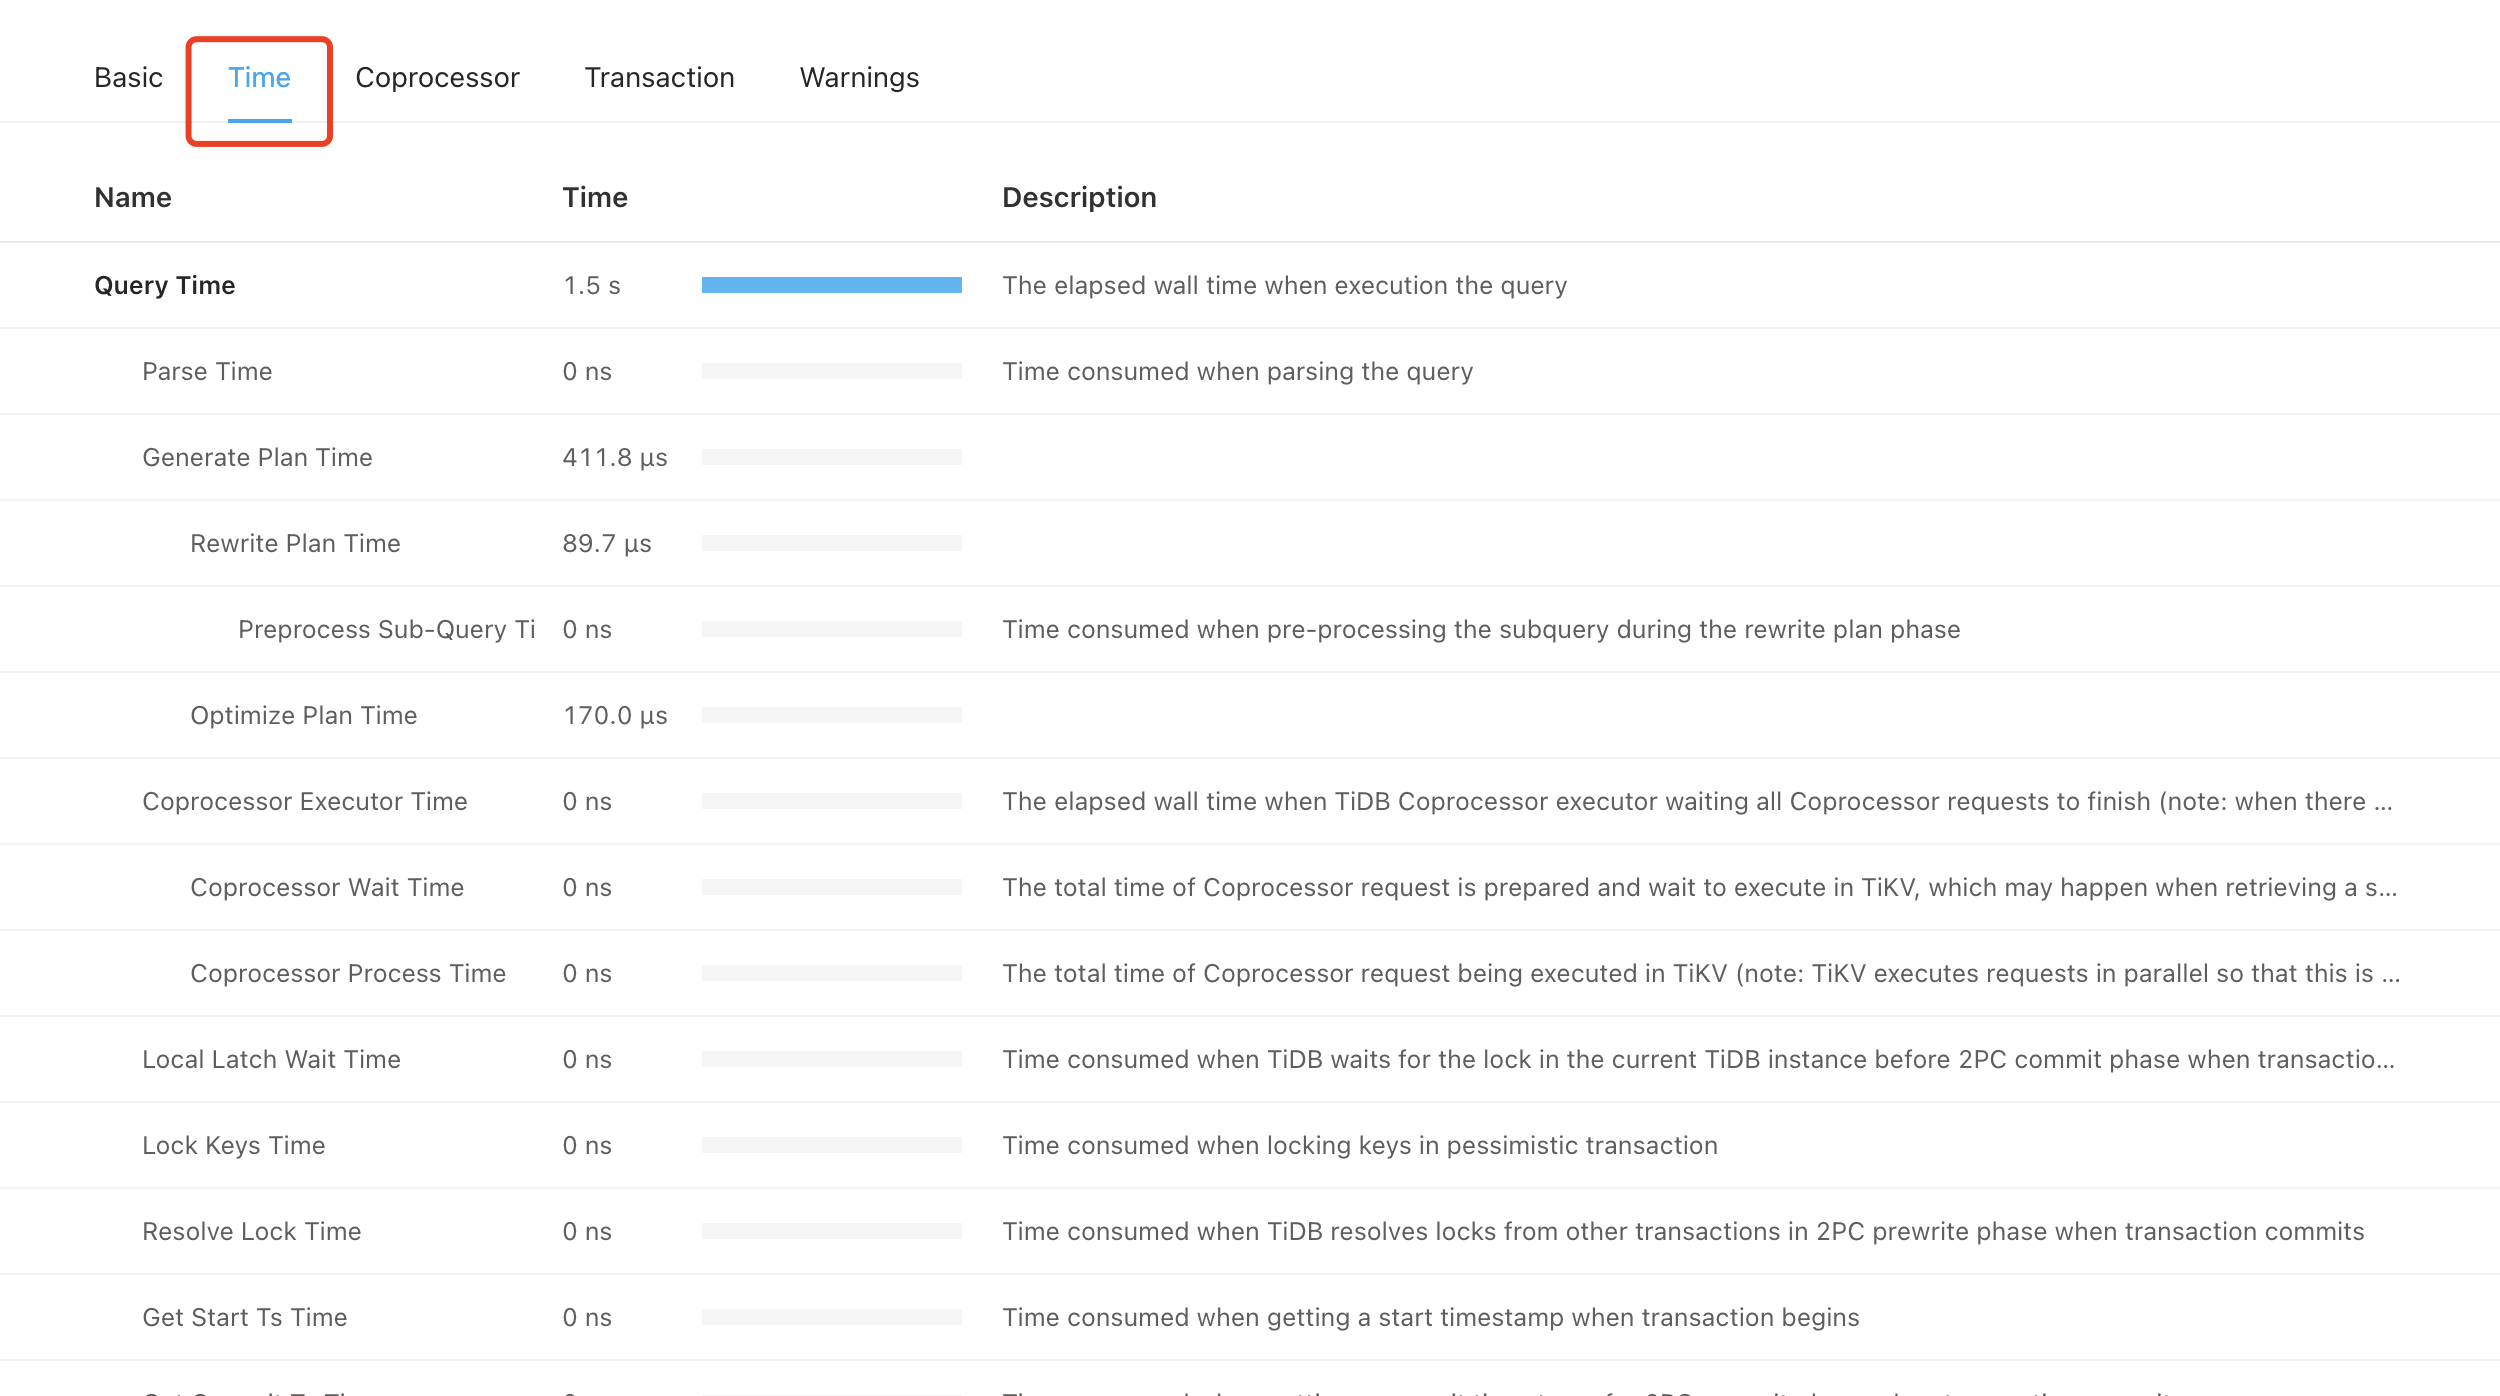
Time tab
Click the Time tab, and you can see how long each stage of the execution plan lasts.
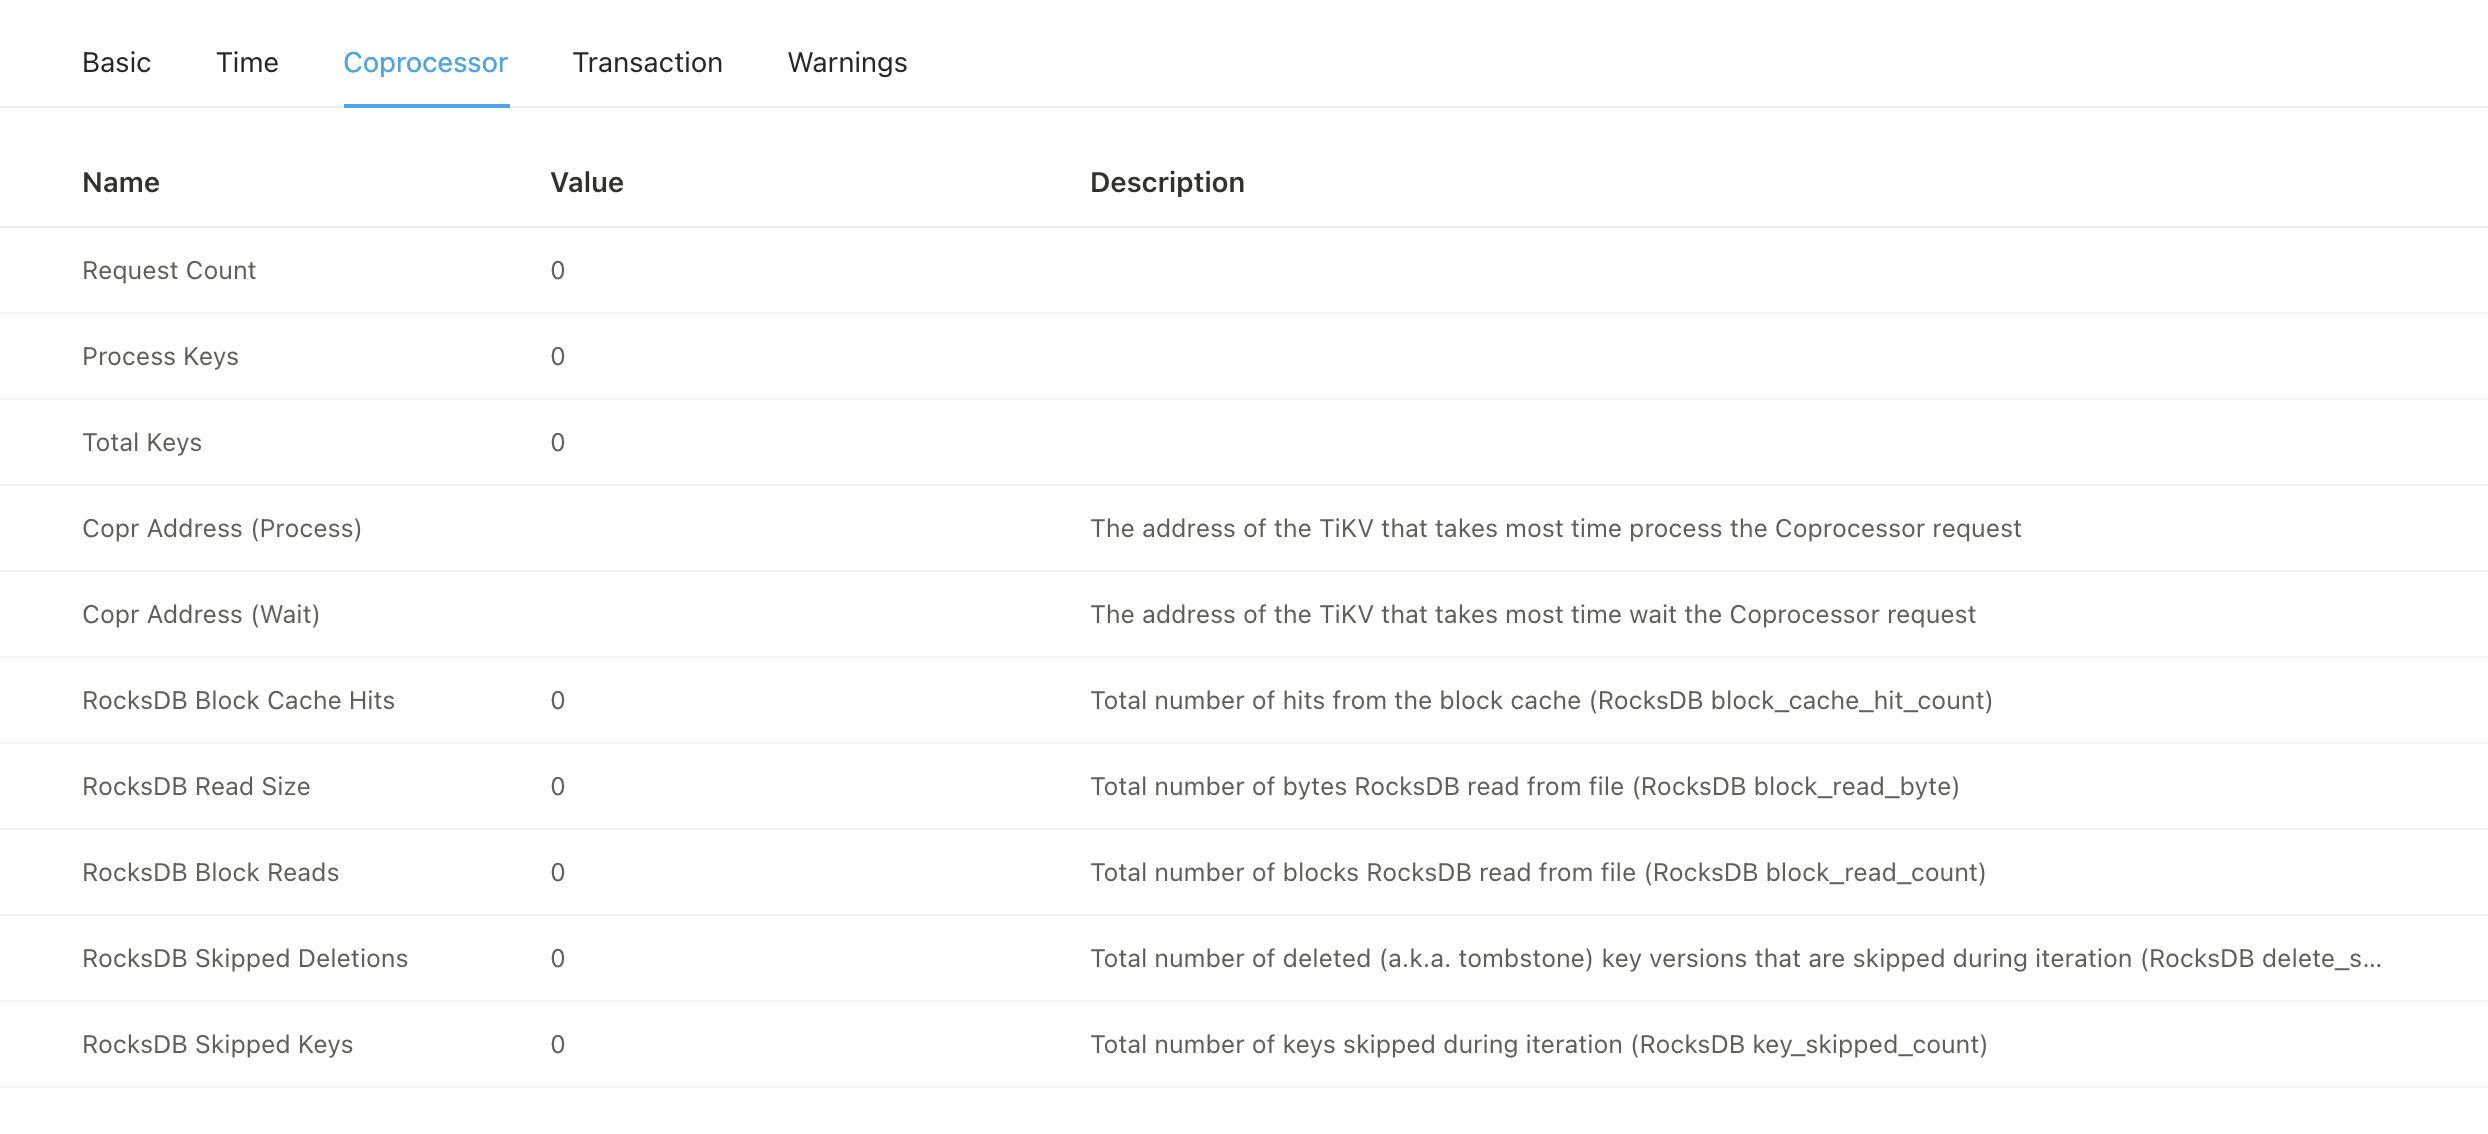
Coprocessor tab
Click the Coprocessor tab, and you can see information related to Coprocessor read.
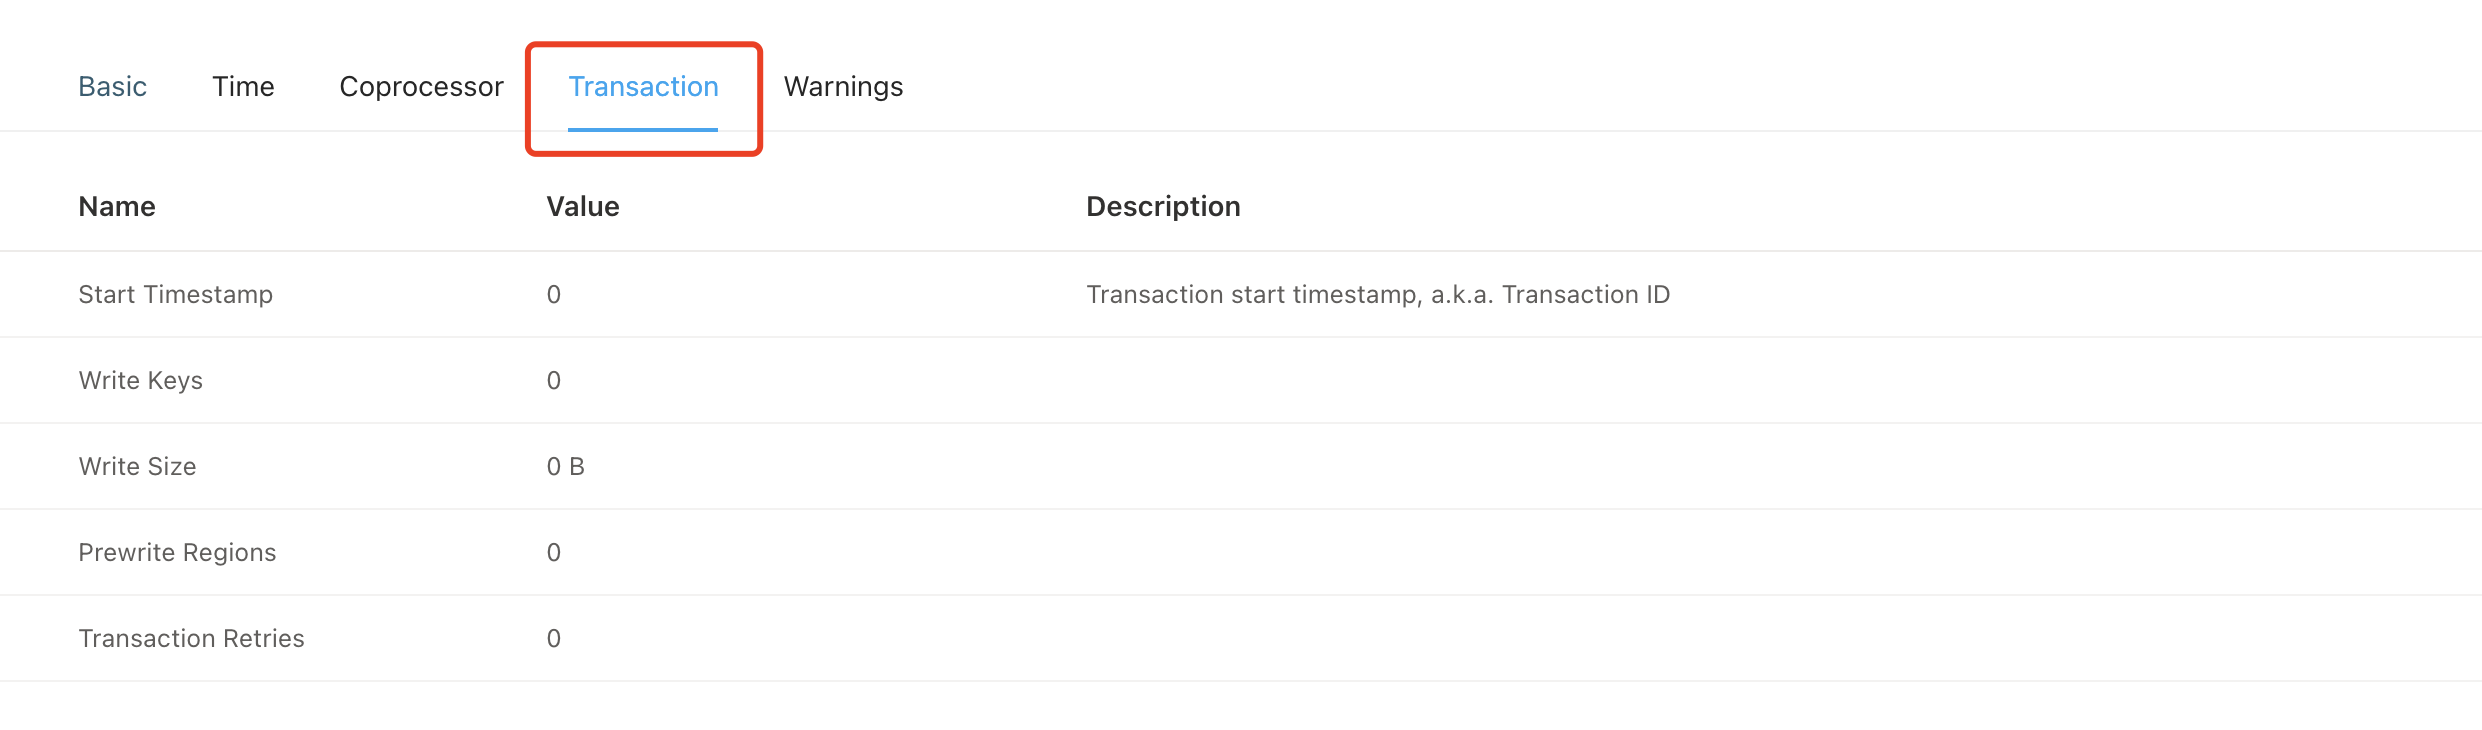
Transaction tab
Click the Transaction tab, and you can see information related to execution plans and transactions, such as the average number of written keys or the maximum number of written keys.