TiProxy Traffic Replay
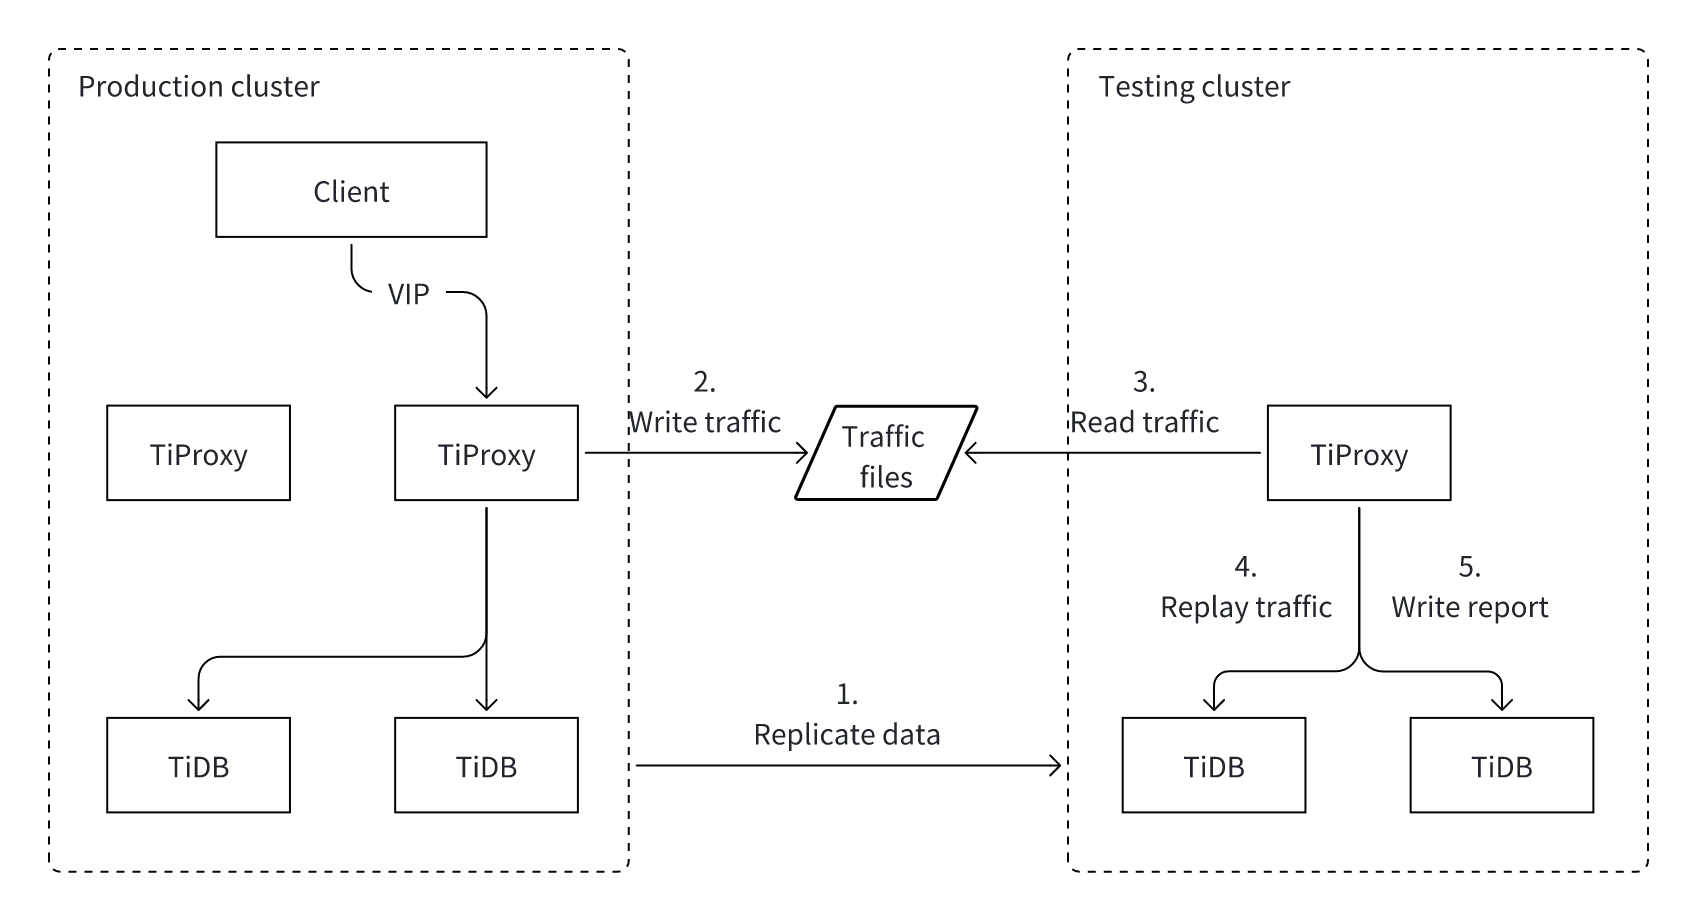
Starting from TiProxy v1.3.0, you can use TiProxy to capture access traffic in a TiDB production cluster and replay it in a test cluster at a specified rate. This feature enables you to reproduce actual workloads from the production cluster in a test environment, verifying SQL statement execution results and performance. Starting from v1.4.0, the TiProxy traffic replay feature becomes generally available (GA).
Use cases
Traffic replay is suitable for the following scenarios:
- Verify TiDB version upgrades: Replay production traffic on a test cluster with a new TiDB version to verify that the new TiDB version can successfully execute all SQL statements.
- Assess change impact: Simulate production traffic on a test cluster to verify the impact of changes on the cluster. For example, verify the effects before modifying configuration items or system variables, altering table schemas, or enabling new TiDB features.
- Validate performance before TiDB scaling: Replay traffic at corresponding rates on a test cluster with a new scale to validate whether the performance meets requirements. For example, to plan a 50% cluster downscale for cost savings, replay traffic at half speed to validate if SQL latency meets requirements after scaling.
- Test performance limits: Replay traffic multiple times on a test cluster of the same scale, increasing the replay rate each time to test the throughput limit of that scale and assess whether performance meets future business growth needs.
Traffic replay is not suitable for the following scenarios:
- Verify SQL compatibility between TiDB and MySQL: TiProxy only supports reading traffic files it generates and cannot capture traffic from MySQL for replay on TiDB.
- Compare SQL execution results between TiDB versions: TiProxy only verifies if SQL statements execute successfully but does not compare results.
Usage
Before TiDB v9.0.0, only tiproxyctl is supported to connect to TiProxy for traffic capture and replay. Starting from TiDB v9.0.0, it is recommended to use SQL statements to capture and replay traffic.
Prepare the test environment:
- Create a test cluster. For more information, see Deploy a TiDB Cluster Using TiUP.
- Replicate data from the production cluster to the test cluster. For more information, see Data Migration Overview.
- Run the
ANALYZEstatement in the test cluster to update statistics.
Use the
TRAFFIC CAPTUREstatement to capture traffic.TiProxy supports capturing traffic to local and external storage. When capturing traffic to local, you need to manually copy the traffic file to the TiProxy cluster for replay after capturing the traffic, but when using external storage, there is no need to manually copy. TiProxy supports external storage including Amazon S3, Google Cloud Storage (GCS), Azure Blob Storage, or other S3-compatible file storage services. For more information about external storage, see URI formats of external storage services.
To capture traffic, the current user must have the
SUPERorTRAFFIC_CAPTURE_ADMINprivilege.For example, the following statement enables all TiProxy instances to capture traffic for one hour and save the traffic to the
/tmp/trafficdirectory of each TiProxy instance:TRAFFIC CAPTURE TO "/tmp/traffic" DURATION="1h"Traffic files are automatically rotated and compressed. For more options, see
TRAFFIC CAPTURE.If the traffic files are captured to the TiProxy local storage, copy the traffic file directory to the TiProxy instances in the test cluster.
Use the
TRAFFIC REPLAYstatement to replay traffic.Replaying traffic requires the current user to have the
SUPERorTRAFFIC_REPLAY_ADMINprivilege.By default, SQL statements are executed at the same rate as in the production cluster, and each database connection corresponds to a connection in the production cluster to simulate the production load.
For example, the following statement connects to all TiProxy instances with username
u1and password123456, reads the traffic files from the/tmp/trafficdirectory of each instance, and replays the traffic:TRAFFIC REPLAY FROM "/tmp/traffic" USER="u1" PASSWORD="123456"Because all traffic runs under user
u1, ensureu1can access all databases and tables. If no such user exists, create one. If the production cluster has a resource group, TiProxy automatically sets the resource group of each session to the same as when it was captured. Therefore, configure theSET RESOURCE GROUPprivilege foru1.If you replay all statements, before replaying again, you may need to restore the data to before the last replay to avoid errors caused by data duplication. You can also add the
READ_ONLY=trueoption to replay only read-only statements to avoid restoring data before each replay.For more information, see
TRAFFIC REPLAY.
Prepare the test environment:
- Create a test cluster. For more information, see Deploy a TiDB Cluster Using TiUP.
- Install
tiproxyctland ensure the host withtiproxyctlcan connect to TiProxy instances in both production and test clusters. For more information, see Install TiProxy Control. - Replicate data from the production cluster to the test cluster. For more information, see Data Migration Overview.
- Run the
ANALYZEstatement in the test cluster to update statistics.
Use the
tiproxyctl traffic capturecommand to connect to the production cluster's TiProxy instance and start capturing traffic.TiProxy supports capturing traffic to local and external storage. When capturing traffic to local, you need to manually copy the traffic file to the TiProxy cluster for replay after capturing the traffic, but when using external storage, there is no need to manually copy. TiProxy supports external storage including Amazon S3, Google Cloud Storage (GCS), Azure Blob Storage, or other file storage services that implement the S3 protocol. For more information about external storage, see URI formats of external storage services.
For example, the following command connects to the TiProxy instance at
10.0.1.10:3080, captures traffic for one hour, and saves it to the/tmp/trafficdirectory on the TiProxy instance:tiproxyctl traffic capture --host 10.0.1.10 --port 3080 --output="/tmp/traffic" --duration=1hTraffic files are automatically rotated and compressed. For more options, see
tiproxyctl traffic capture.If the traffic files are captured to the TiProxy local storage, copy the traffic file directory to the TiProxy instances in the test cluster.
Use
tiproxyctl traffic replayto connect to the test cluster's TiProxy instance and start replaying traffic.By default, SQL statements are executed at the same rate as in the production cluster, and each database connection corresponds to a connection in the production cluster to simulate the production load.
For example, the following command connects to the TiProxy instance at
10.0.1.10:3080using usernameu1and password123456, reads traffic files from the/tmp/trafficdirectory on the TiProxy instance, and replays the traffic:tiproxyctl traffic replay --host 10.0.1.10 --port 3080 --username="u1" --password="123456" --input="/tmp/traffic"Because all traffic runs under user
u1, ensureu1can access all databases and tables. If no such user exists, create one. If the production cluster has a resource group, TiProxy automatically sets the resource group of each session to the same as when it was captured. Therefore, configure theSET RESOURCE GROUPprivilege foru1.If you replay all statements, before replaying again, you might need to restore the data to before the last replay to avoid errors caused by data duplication. You can also add the
--read-only=trueoption to replay only read-only statements to avoid restoring data before each replay.For more information, see
tiproxyctl traffic replay.
View the replay report
After replay completion, the report is stored in the tiproxy_traffic_replay database on the test cluster. This database contains two tables: fail and other_errors.
The fail table stores failed SQL statements, with the following fields:
replay_start_time: the start time of the replay job, which is used to uniquely identify a replay job. It can be used to filter replay jobs.cmd_type: the type of a failed command, such asQuery(execute an ordinary statement),Prepare(prepare a statement), andExecute(execute a prepared statement).digest: the digest of the failed SQL statement.sample_stmt: the SQL text when the statement first failed.sample_err_msg: the error message when the SQL statement failed.sample_conn_id: the connection ID recorded in the traffic file for the SQL statement. You can use this to view the execution context in the traffic file.sample_capture_time: the execution time recorded in the traffic file for the SQL statement. You can use this to view the execution context in the traffic file.sample_replay_time: the time when the SQL statement failed during replay. You can use this to view error information in the TiDB log file.count: the number of times the SQL statement failed.
The following is an example output of the fail table:
SELECT * FROM tiproxy_traffic_replay.fail LIMIT 1\G
*************************** 1. row ***************************
  replay_start_time: 2024-10-17 13:05:03
           cmd_type: StmtExecute
             digest: 89c5c505772b8b7e8d5d1eb49f4d47ed914daa2663ed24a85f762daa3cdff43c
        sample_stmt: INSERT INTO new_order (no_o_id, no_d_id, no_w_id) VALUES (?, ?, ?) params=[3077 6 1]
     sample_err_msg: ERROR 1062 (23000): Duplicate entry '1-6-3077' for key 'new_order.PRIMARY'
     sample_conn_id: 1356
sample_capture_time: 2024-10-17 12:59:15
 sample_replay_time: 2024-10-17 13:05:05
              count: 4
The other_errors table stores unexpected errors, such as network errors or database connection errors, with the following fields:
replay_start_time: the start time of the replay job, which is used to uniquely identify a replay job. It can be used to filter replay jobs.err_type: the type of error, presented as a brief error message. For example,i/o timeout.sample_err_msg: the complete error message when the error first occurred.sample_replay_time: the time when the error occurred during replay. You can use this to view error information in the TiDB log file.count: the number of occurrences for this error.
The following is an example output of the other_errors table:
SELECT * FROM tiproxy_traffic_replay.other_errors LIMIT 1\G
*************************** 1. row ***************************
 replay_start_time: 2024-10-17 12:57:35
          err_type: failed to read the connection: EOF
    sample_err_msg: this is an error from the backend connection: failed to read the connection: EOF
sample_replay_time: 2024-10-17 12:57:39
             count: 1
Test throughput
To test cluster throughput, use the SPEED option to adjust the replay rate.
For example, SPEED=2 executes SQL statements at twice the rate, reducing the total replay time by half:
TRAFFIC REPLAY FROM "/tmp/traffic" USER="u1" PASSWORD="123456" SPEED=2
To test cluster throughput, use the --speed option to adjust the replay rate.
For example, --speed=2 executes SQL statements at twice the rate, reducing the total replay time by half:
tiproxyctl traffic replay --host 10.0.1.10 --port 3080 --username="u1" --password="123456" --input="/tmp/traffic" --speed=2
Increasing the replay rate only reduces idle time between SQL statements and does not increase the number of connections. When session idle time is already short, increasing the speed might not effectively improve throughput. In such cases, you can deploy multiple TiProxy instances to replay the same traffic files simultaneously, increasing concurrency to improve throughput.
View and manage jobs
During capture and replay, jobs automatically stop if unknown errors occur. To view the current job progress or error information from the last job, use the SHOW TRAFFIC JOBS statement:
SHOW TRAFFIC JOBS
The shown results vary depending on the privileges the current user has.
- If the user has the
TRAFFIC_CAPTURE_ADMINprivilege, this statement shows traffic capture jobs. - If the user has the
TRAFFIC_REPLAY_ADMINprivilege, this statement shows traffic replay jobs. - If the user has the
SUPERprivilege or both above privileges, this statement shows both traffic capture and traffic replay jobs.
For example, the following output indicates that 2 TiProxy instances are capturing traffic:
+----------------------------+----------+----------------+---------+----------+---------+-------------+----------------------------------------------------------------------------+
| START_TIME                 | END_TIME | INSTANCE       | TYPE    | PROGRESS | STATUS  | FAIL_REASON | PARAMS                                                                     |
+----------------------------+----------+----------------+---------+----------+---------+-------------+----------------------------------------------------------------------------+
| 2024-12-17 10:54:41.000000 |          | 10.1.0.10:3080 | capture | 45%      | running |             | OUTPUT="/tmp/traffic", DURATION="90m", COMPRESS=true, ENCRYPTION_METHOD="" |
| 2024-12-17 10:54:41.000000 |          | 10.1.0.11:3080 | capture | 45%      | running |             | OUTPUT="/tmp/traffic", DURATION="90m", COMPRESS=true, ENCRYPTION_METHOD="" |
+----------------------------+----------+----------------+---------+----------+---------+-------------+----------------------------------------------------------------------------+
2 rows in set (0.01 sec)
For more information, see SHOW TRAFFIC JOBS.
To cancel the current capture or replay job, use the CANCEL TRAFFIC JOBS statement:
CANCEL TRAFFIC JOBS
Canceling traffic capture jobs requires the SUPER or TRAFFIC_CAPTURE_ADMIN privilege and canceling traffic replay jobs requires the SUPER or TRAFFIC_REPLAY_ADMIN privilege.
For more information, see CANCEL TRAFFIC JOBS.
During capture and replay, jobs automatically stop if unknown errors occur. To view the current job progress or error information from the last job, use the tiproxyctl traffic show command:
tiproxyctl traffic show --host 10.0.1.10 --port 3080
For example, the following output indicates a running capture job:
[
   {
      "type": "capture",
      "status": "running",
      "start_time": "2024-09-03T09:10:58.220644+08:00",
      "progress": "45%",
      "output": "/tmp/traffic",
      "duration": "2h"
   }
]
For more information, see tiproxyctl traffic show.
To cancel the current capture or replay job, use the tiproxyctl traffic cancel command:
tiproxyctl traffic cancel --host 10.0.1.10 --port 3080
For more information, see tiproxyctl traffic cancel.
Limitations
TiProxy only supports replaying traffic files captured by TiProxy and does not support other file formats. Therefore, make sure to capture traffic from the production cluster using TiProxy first.
TiProxy does not support replaying
LOAD DATAstatements.For security reasons, the following statements will not be captured and replayed:
CREATE USERstatementALTER USERstatementSET PASSWORDstatementGRANTstatementBACKUPstatementRESTOREstatementIMPORTstatement
More resources
For more information about the traffic replay of TiProxy, see the design document.