Statement Execution Details of TiDB Dashboard
Click any item in the list to enter the detail page of the SQL statement to view more detailed information. This information includes the following parts:
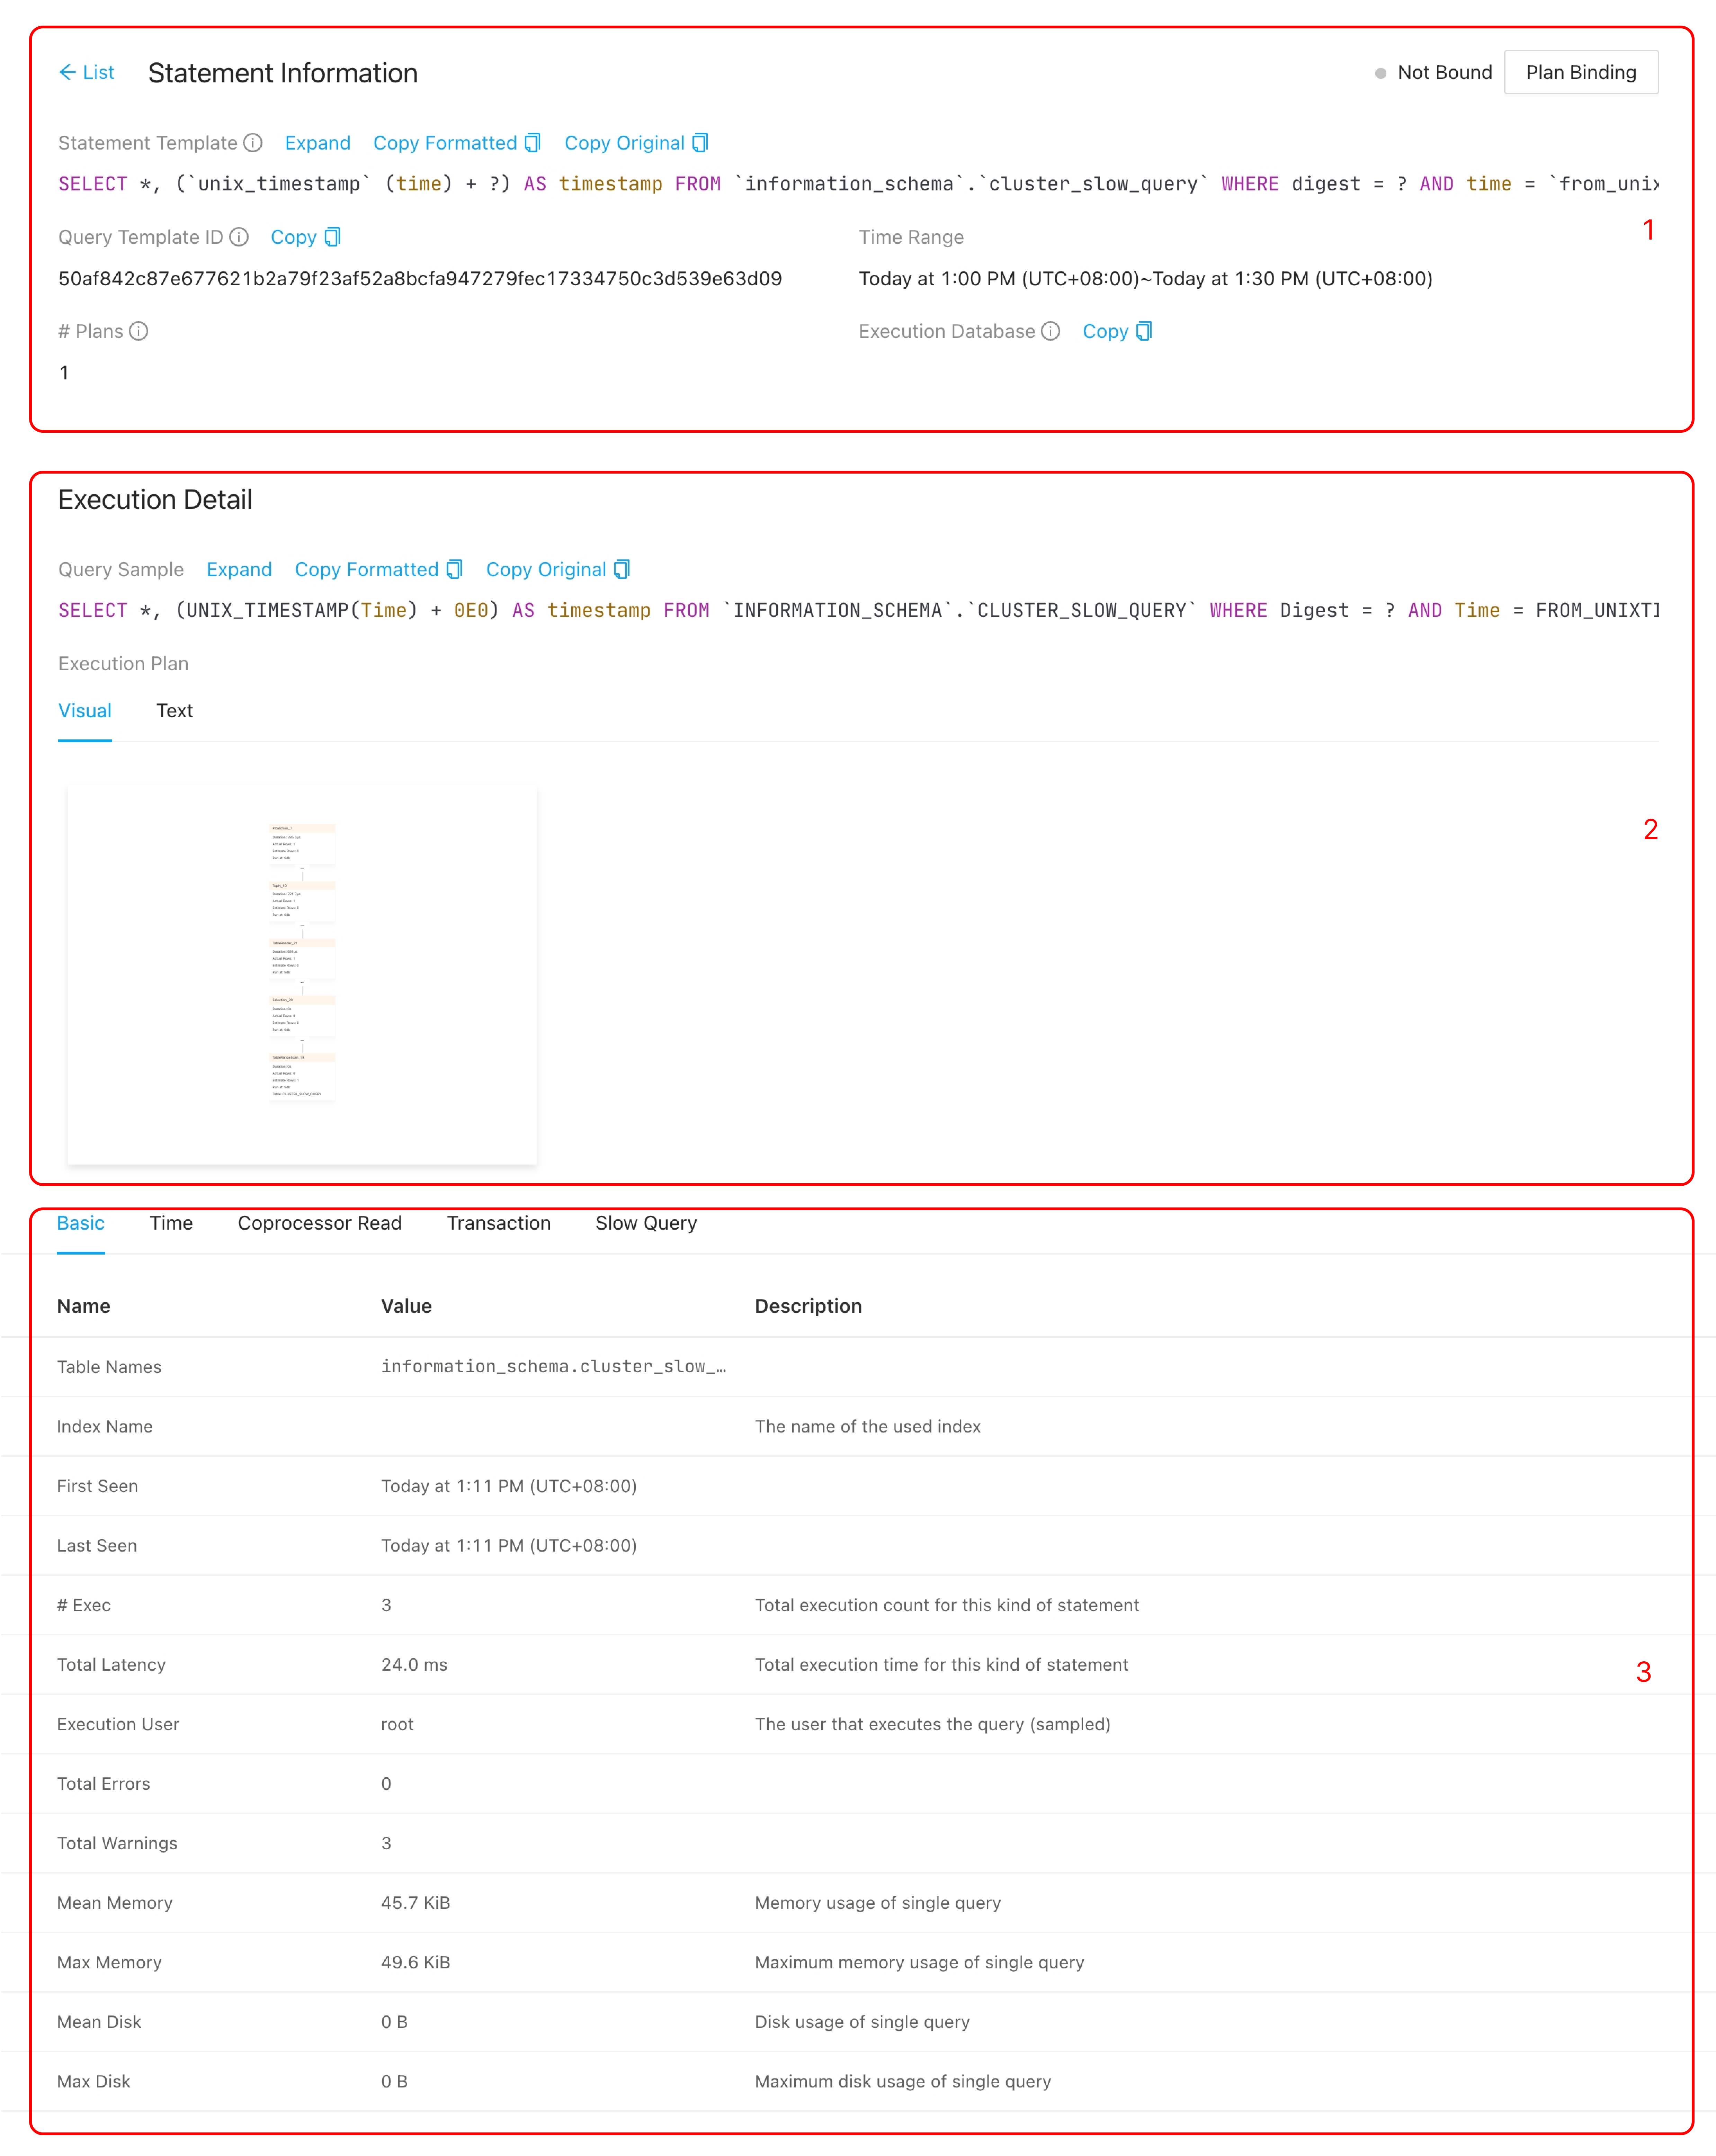
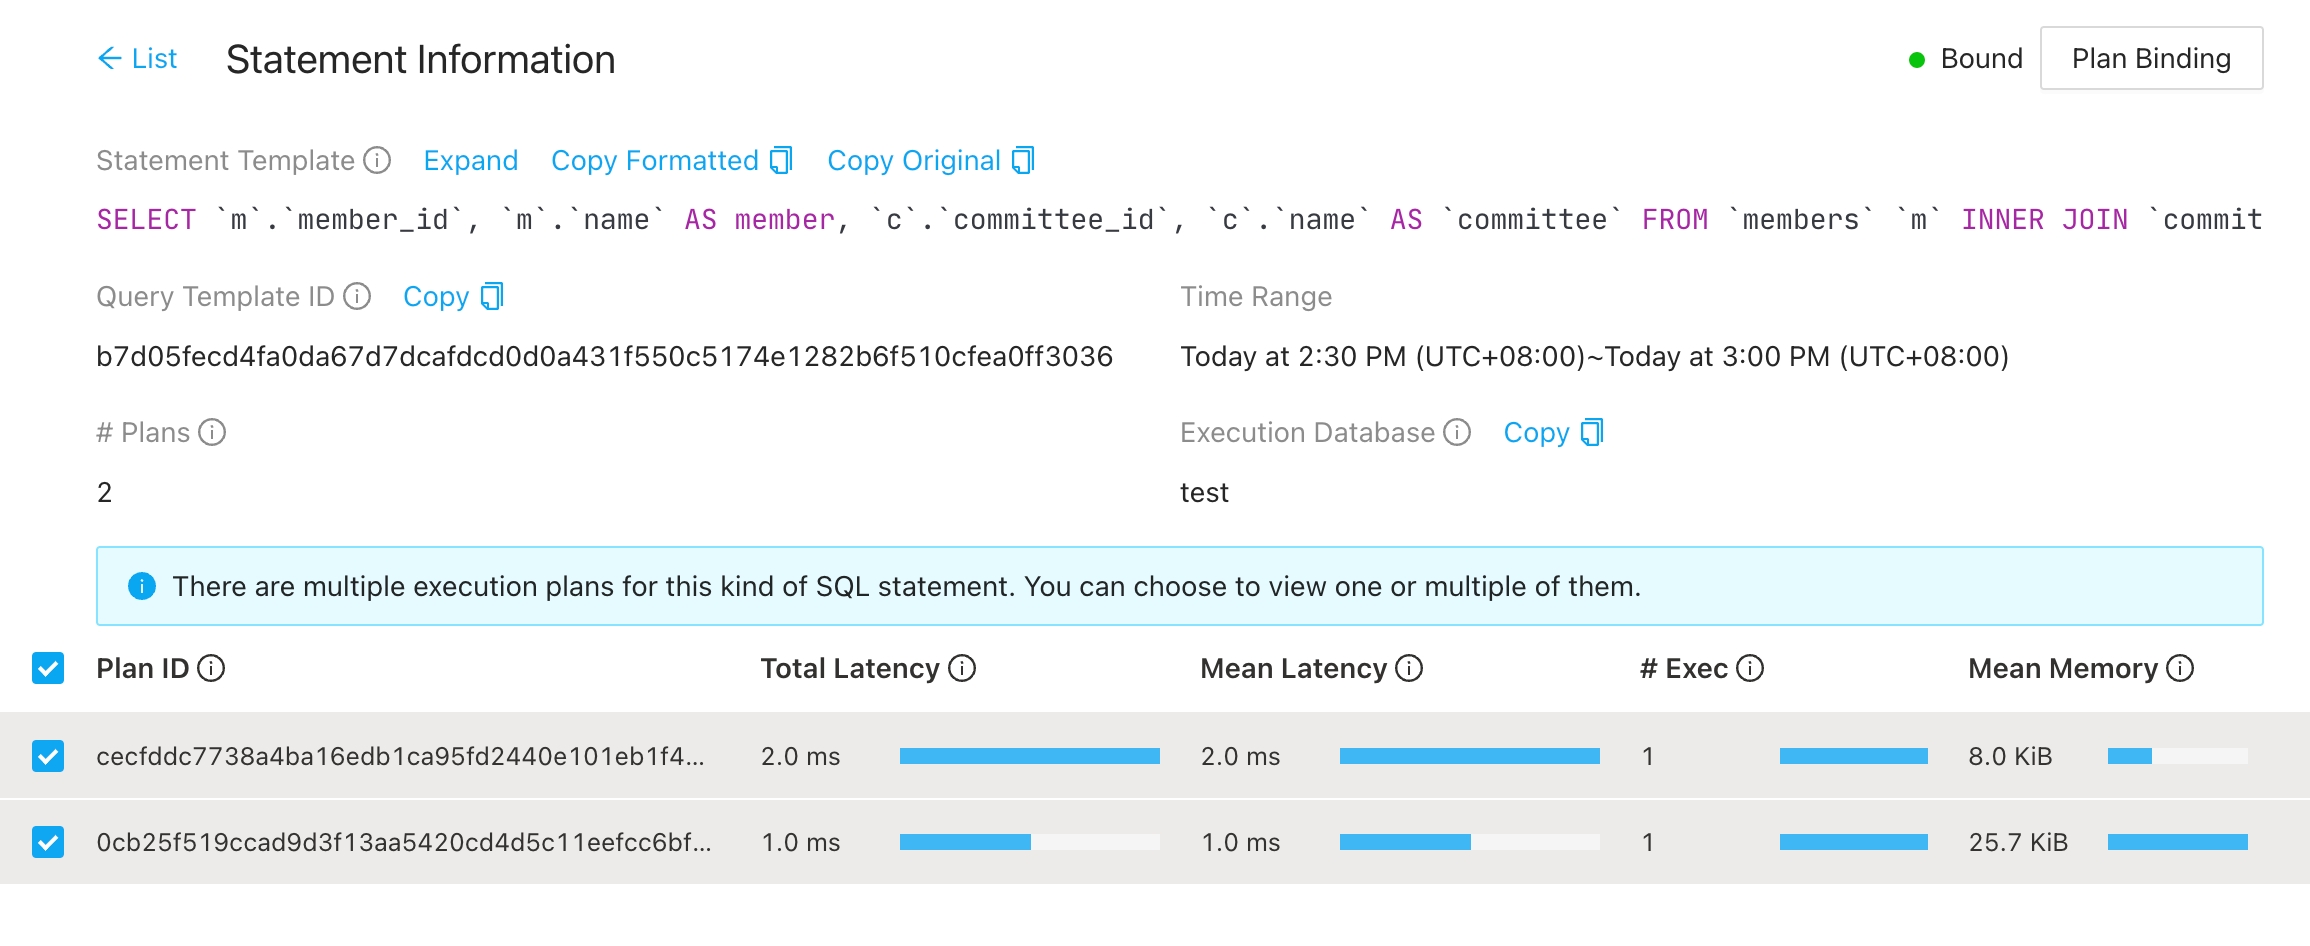
- The overview of SQL statements, which includes the SQL template, the SQL template ID, the current time range of displayed SQL executions, the number of execution plans, the database in which the SQL statement is executed, and the fast plan binding feature (area 1 in the following figure).
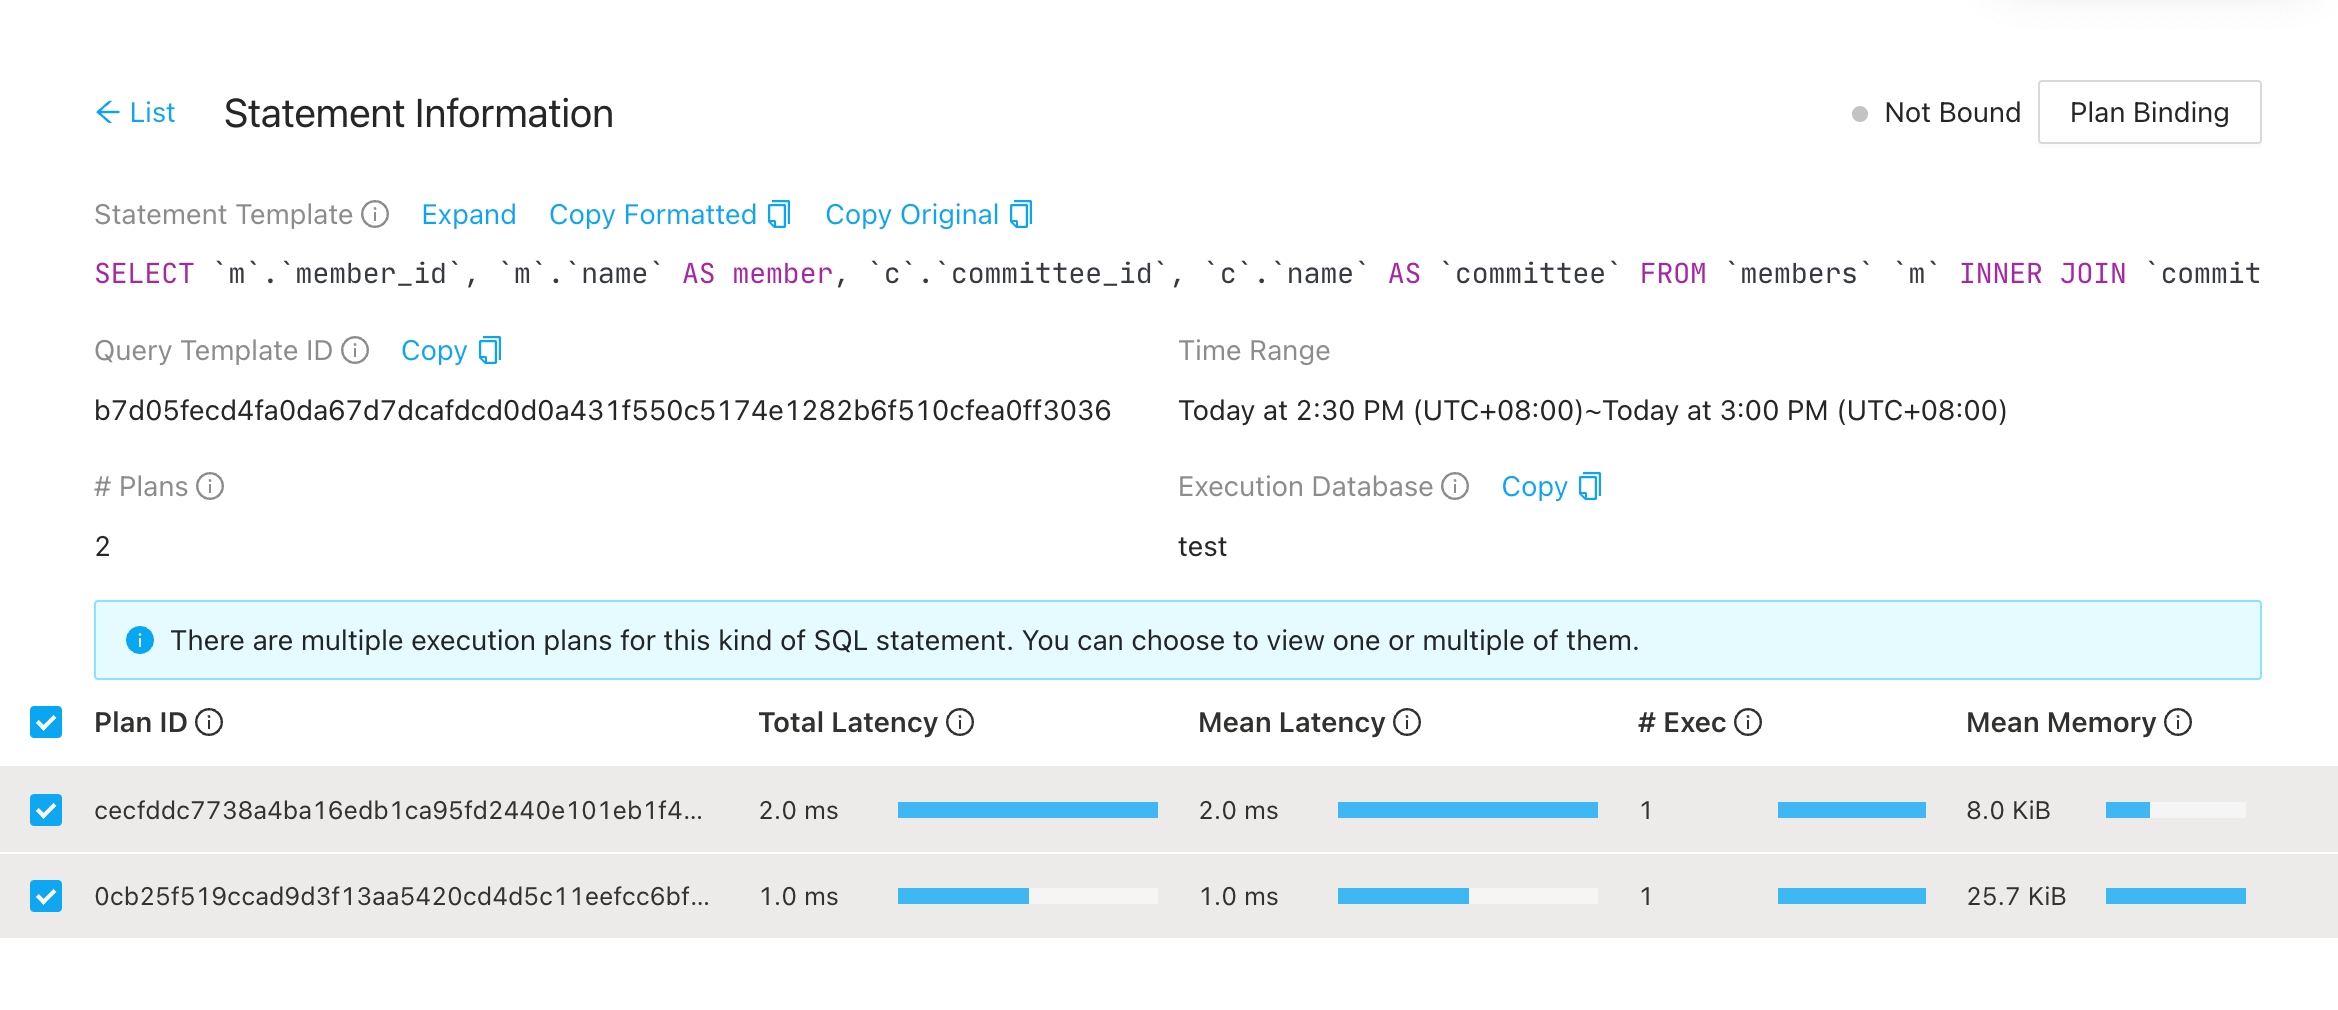
- The execution plan list: If a SQL statement has multiple execution plans, this list is displayed. Besides text information of execution plans, TiDB v6.2.0 introduces visual execution plans, through which you can learn each operator of a statement and detailed information more intuitively. You can select different execution plans, and the details of the selected plans are displayed below the list (area 2 in the following figure).
- Execution detail of plans, which displays the detailed information of the selected execution plans. See Execution plan in details (area 3 in the following figure).
Fast plan binding
Starting from v6.6.0, TiDB introduces the fast plan binding feature. You can quickly bind a SQL statement to a specific execution plan in TiDB Dashboard.
Usage
Bind an execution plan
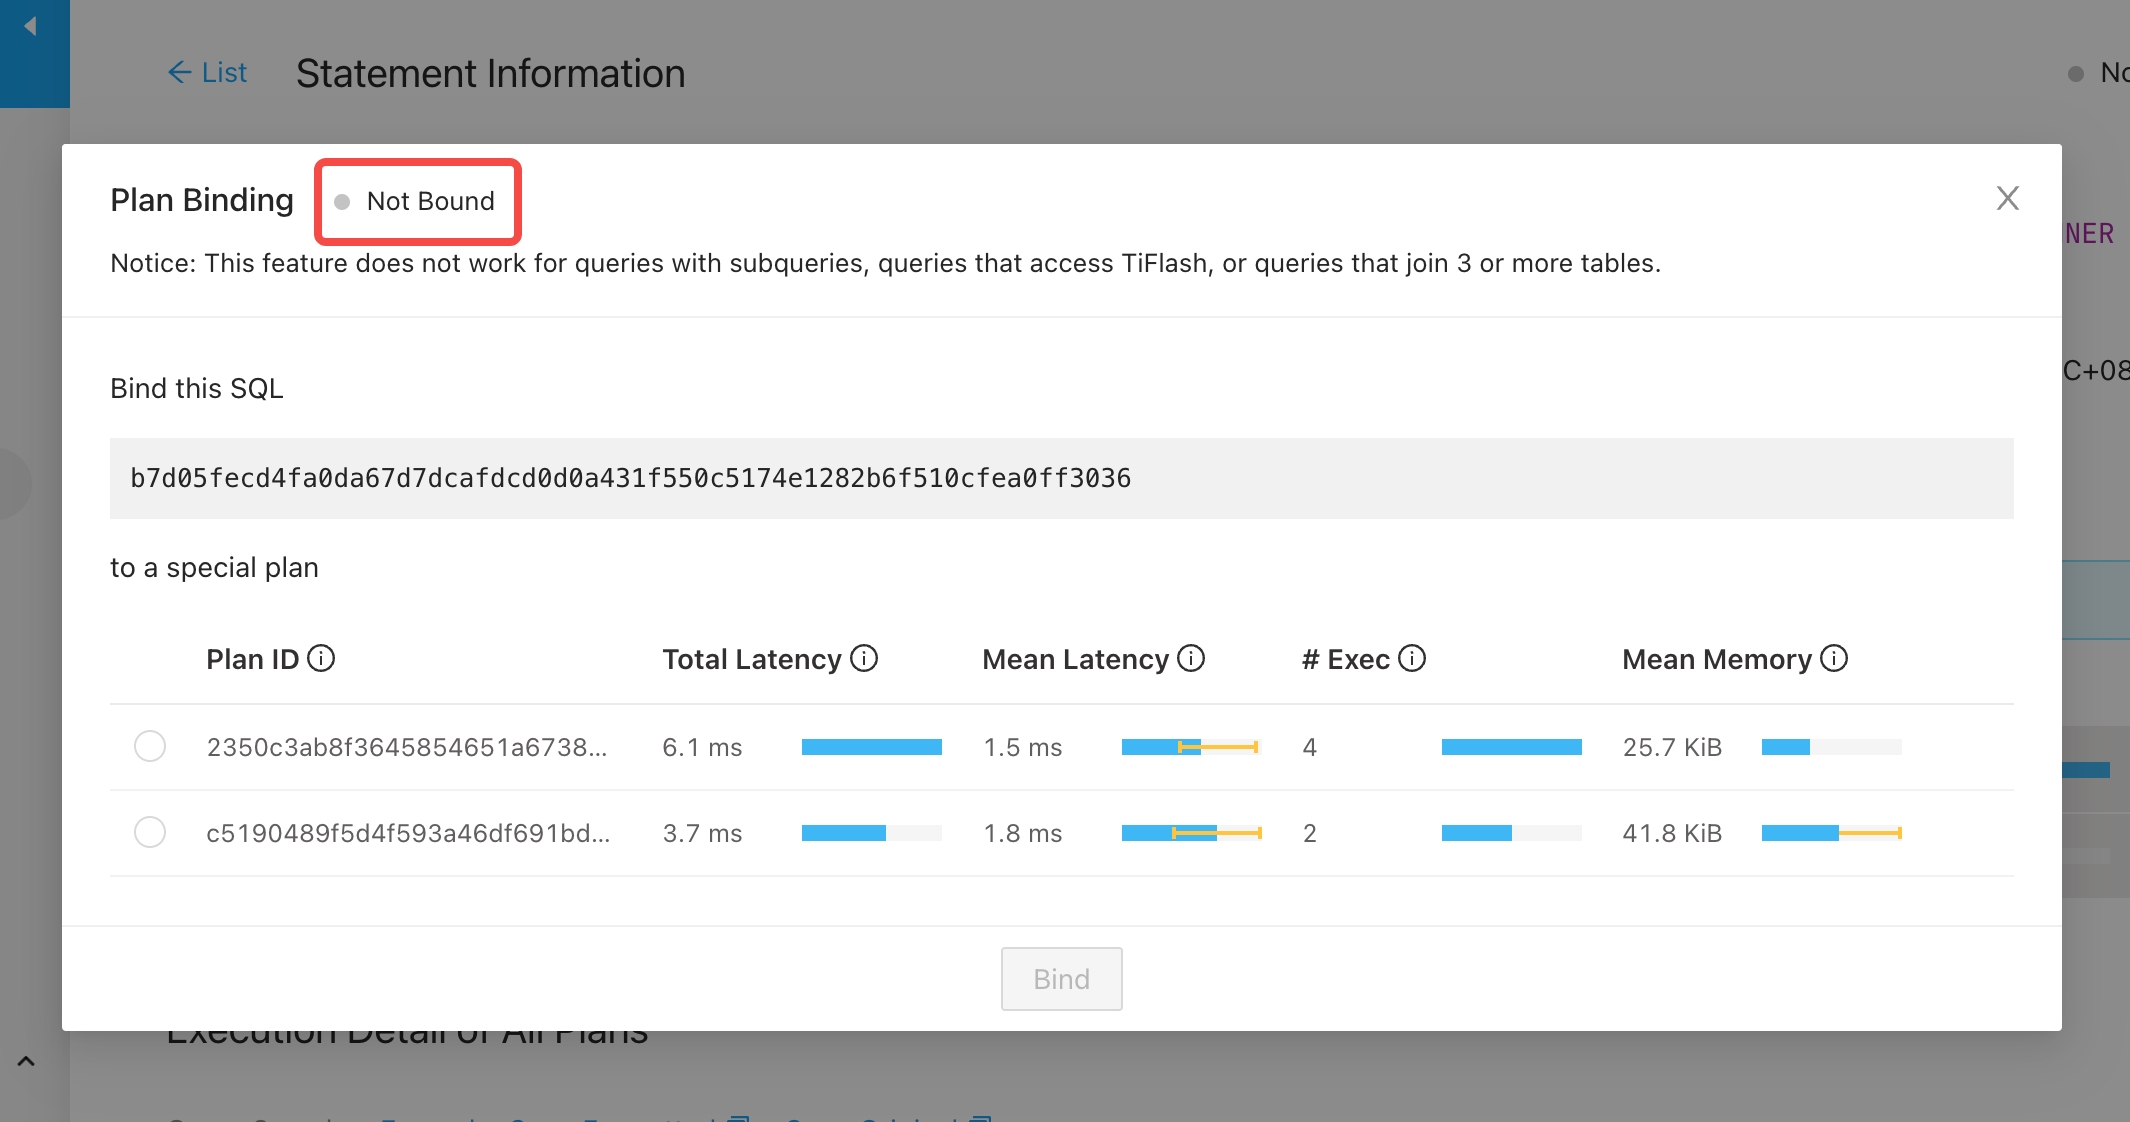
Click Plan Binding. The Plan Binding dialog box is displayed.
Select a plan that you want to bind and click Bind.
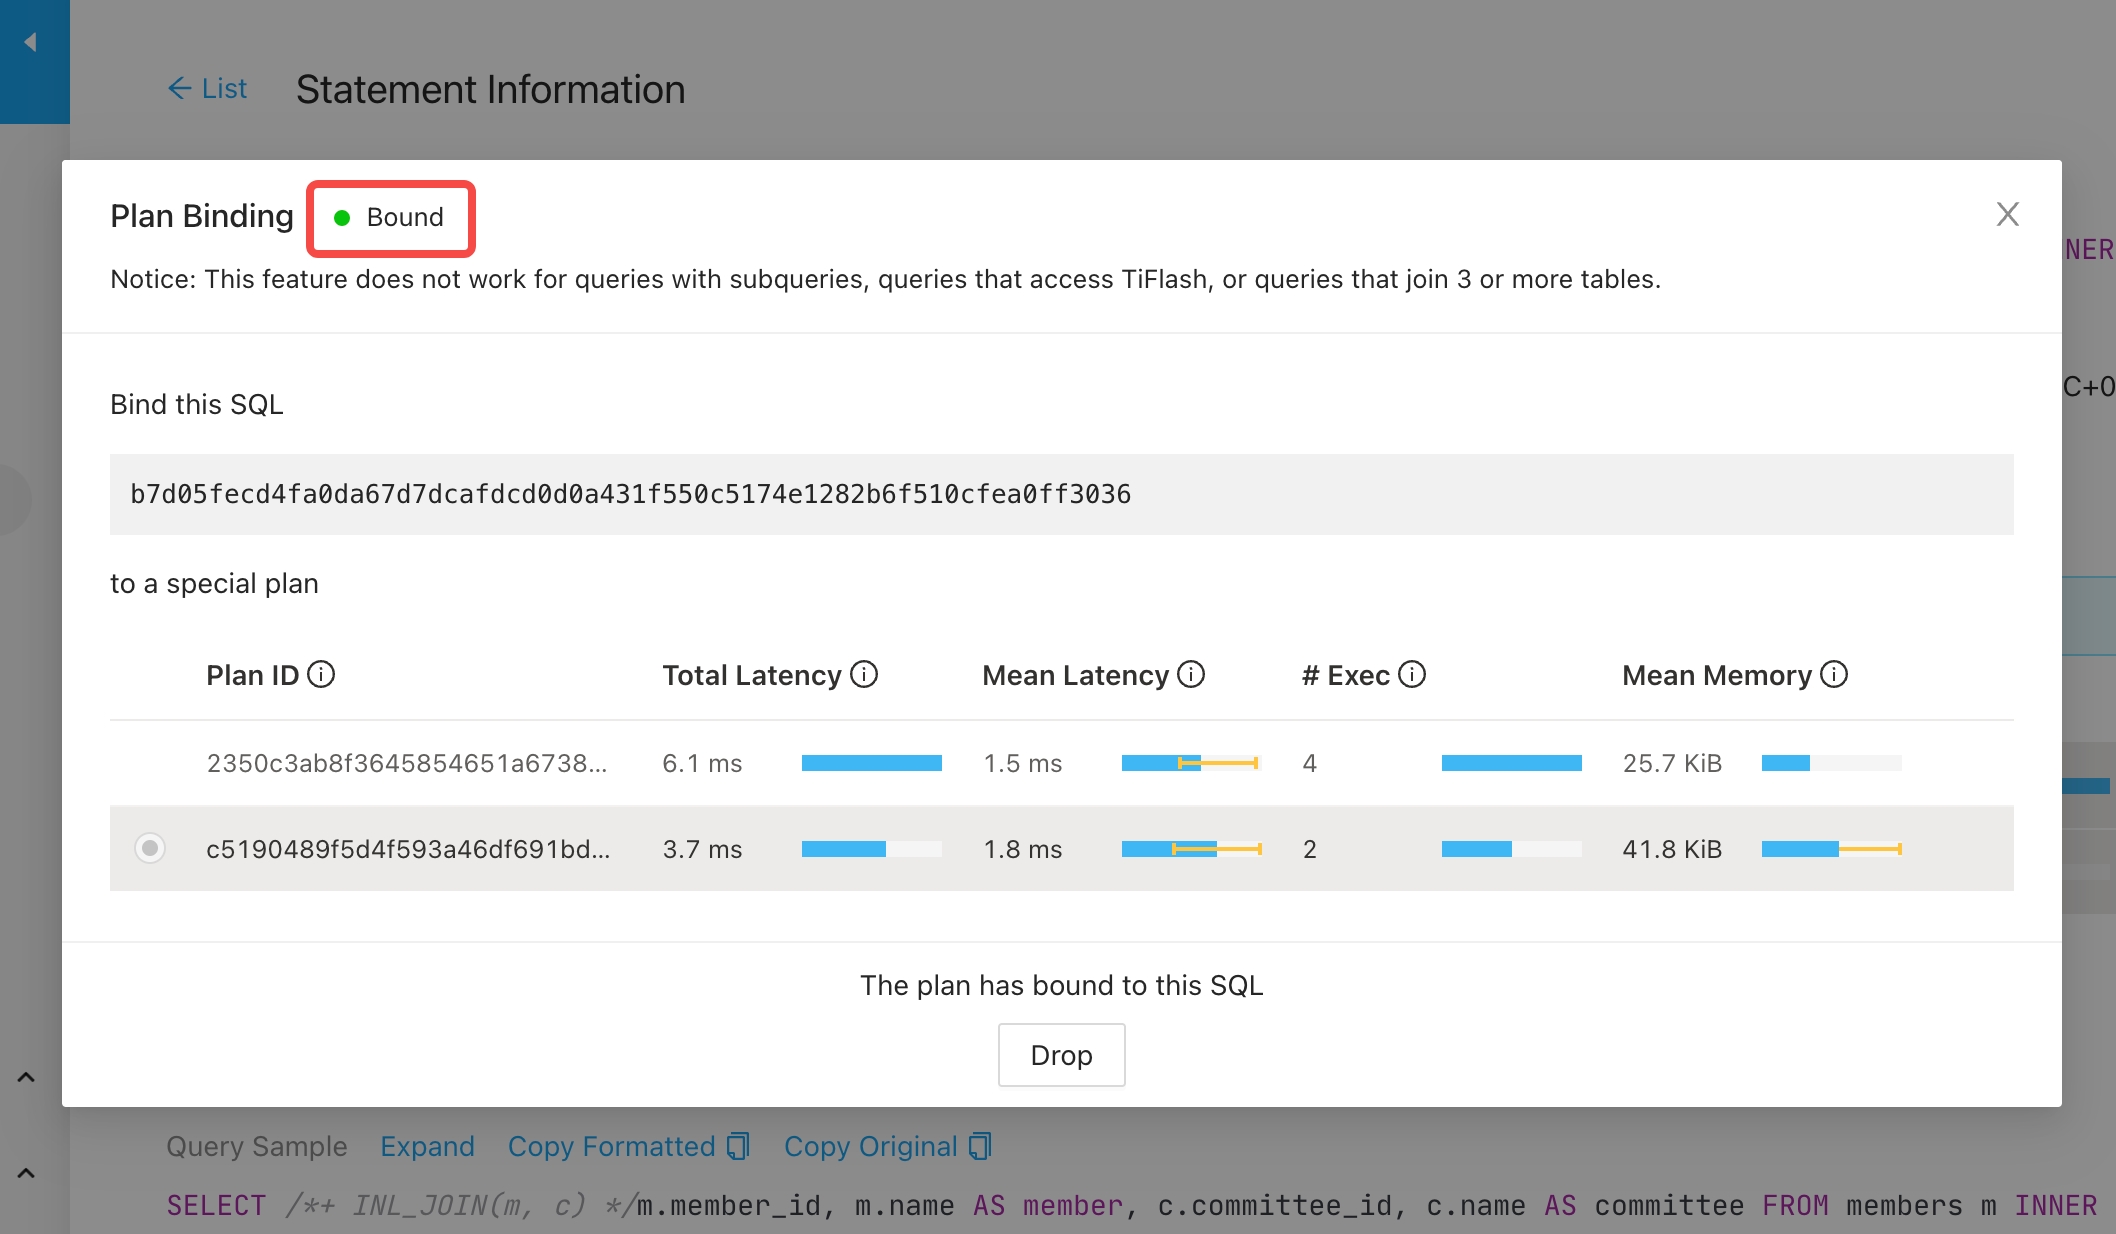
After the binding is completed, you can see the Bound label.
Drop an existing binding
On the page of a SQL statement that has an existing binding, click Plan Binding. The Plan Binding dialog box is displayed.
Click Drop.
After the binding is dropped, you can see the Not bound label.
Limitation
Currently, the fast plan binding feature does not support the following types of SQL statements:
- Statements that are not
SELECT,DELETE,UPDATE,INSERT, orREPLACE - Queries with subqueries
- Queries that access TiFlash
- Queries that join three or more tables
To use this feature, you must have the SUPER privilege. If you encounter permission issues while using it, refer to TiDB Dashboard User Management to add the necessary privileges.
Execution details of plans
The execution detail of plans includes the following information:
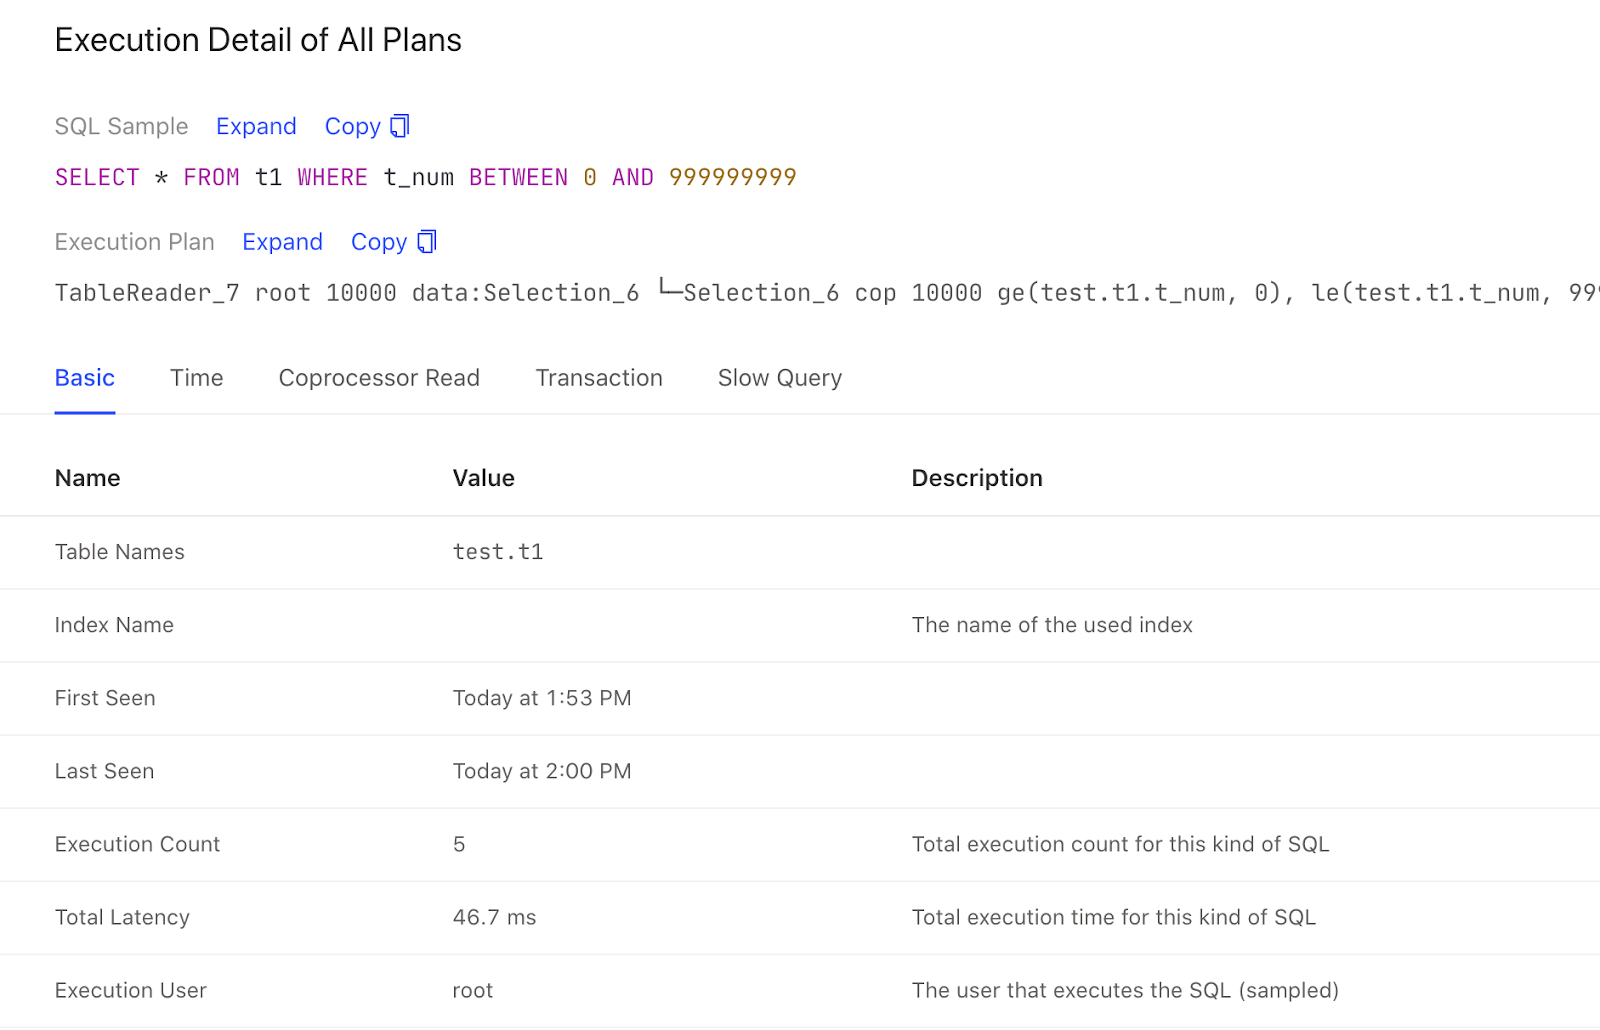
- SQL sample: The text of a certain SQL statement that is actually executed corresponding to the plan. Any SQL statement that has been executed within the time range might be used as a SQL sample.
- Execution plan: Complete information about execution plans, displayed in table, graph, and text. For details of the execution plan, see Understand the Query Execution Plan. If multiple execution plans are selected, only (any) one of them is displayed.
- For basic information, execution time, Coprocessor read, transaction, and slow query of the SQL statement, you can click the corresponding tab titles to switch among different information.
SQL sample
To view the detailed information of an item, you can click Expand. To copy the detailed information to the clipboard, click Copy.
Execution plans
On TiDB Dashboard, you can view execution plans in three ways: table, text, and graph. To learn how to read an execution plan, see Understand the query execution plan.
Execution plan in table format
The table format provides detailed information about the execution plan, which helps you quickly identify abnormal operator metrics and compare the status of different operators. The following figure shows an execution plan in table format:
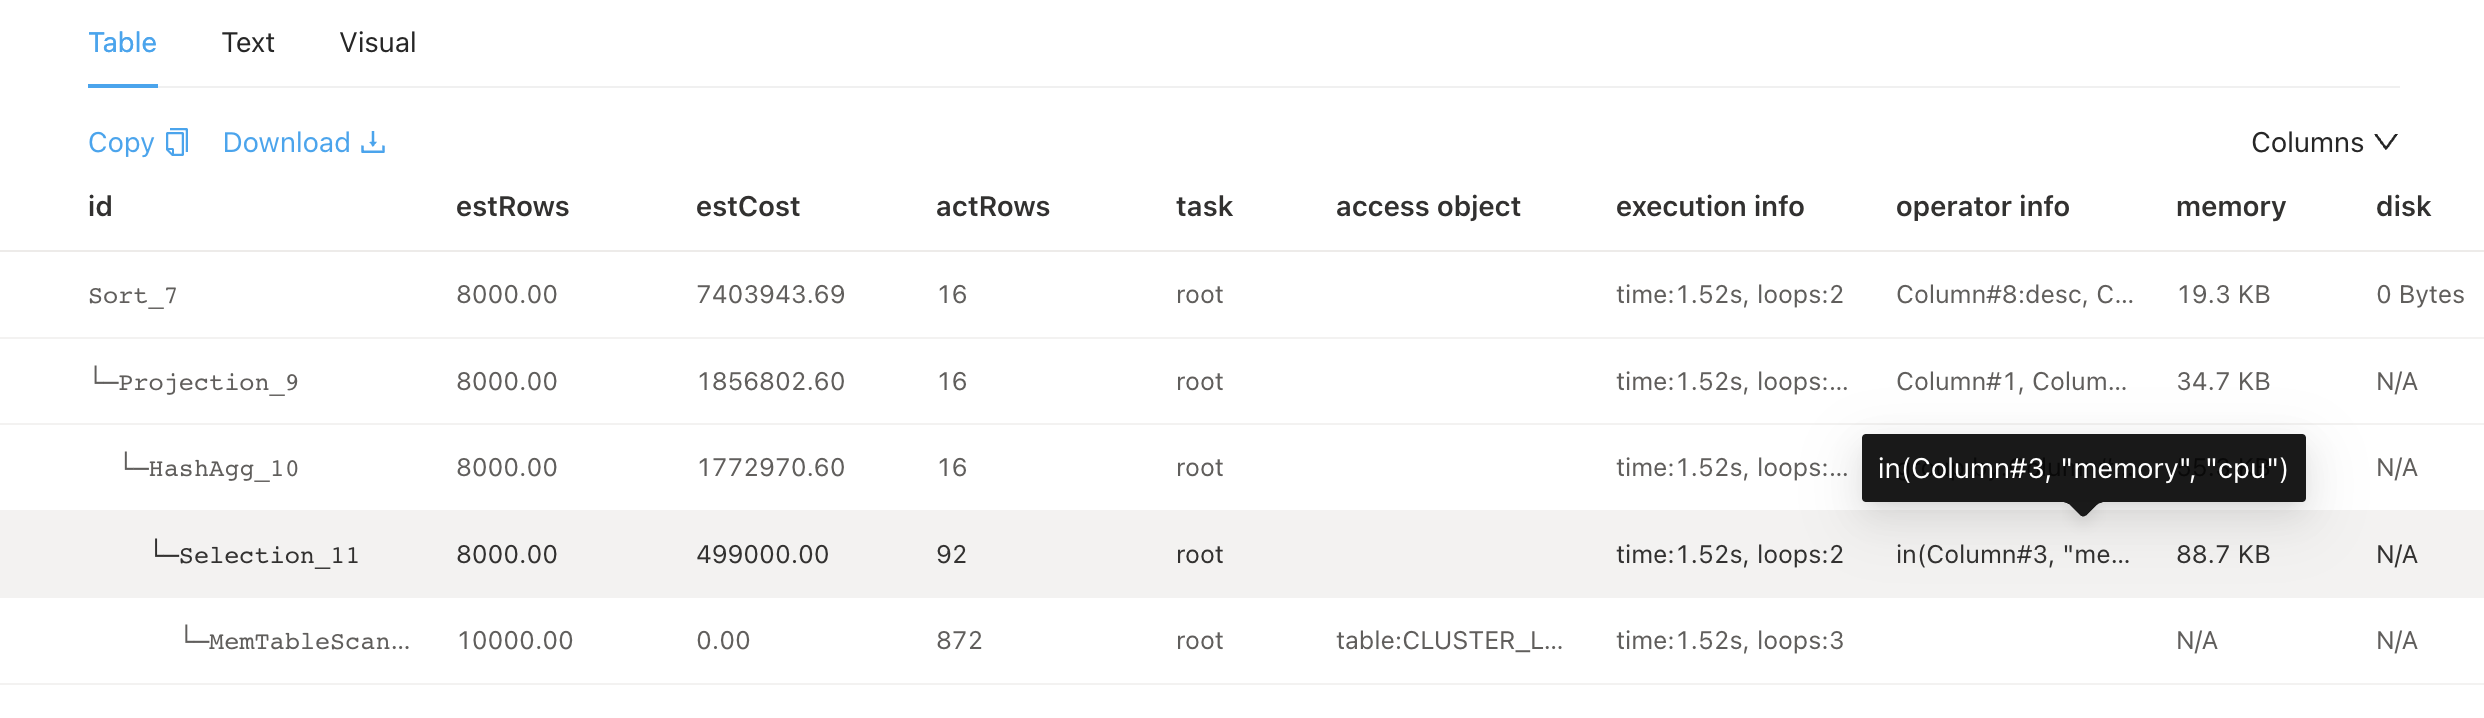
The table format displays similar information to the text format but provides more user-friendly interactions:
- You can adjust the column width freely.
- When content exceeds the column width, it is automatically truncated and a tooltip is shown for the full information.
- If the execution plan is large, you can download it as a text file for local analysis.
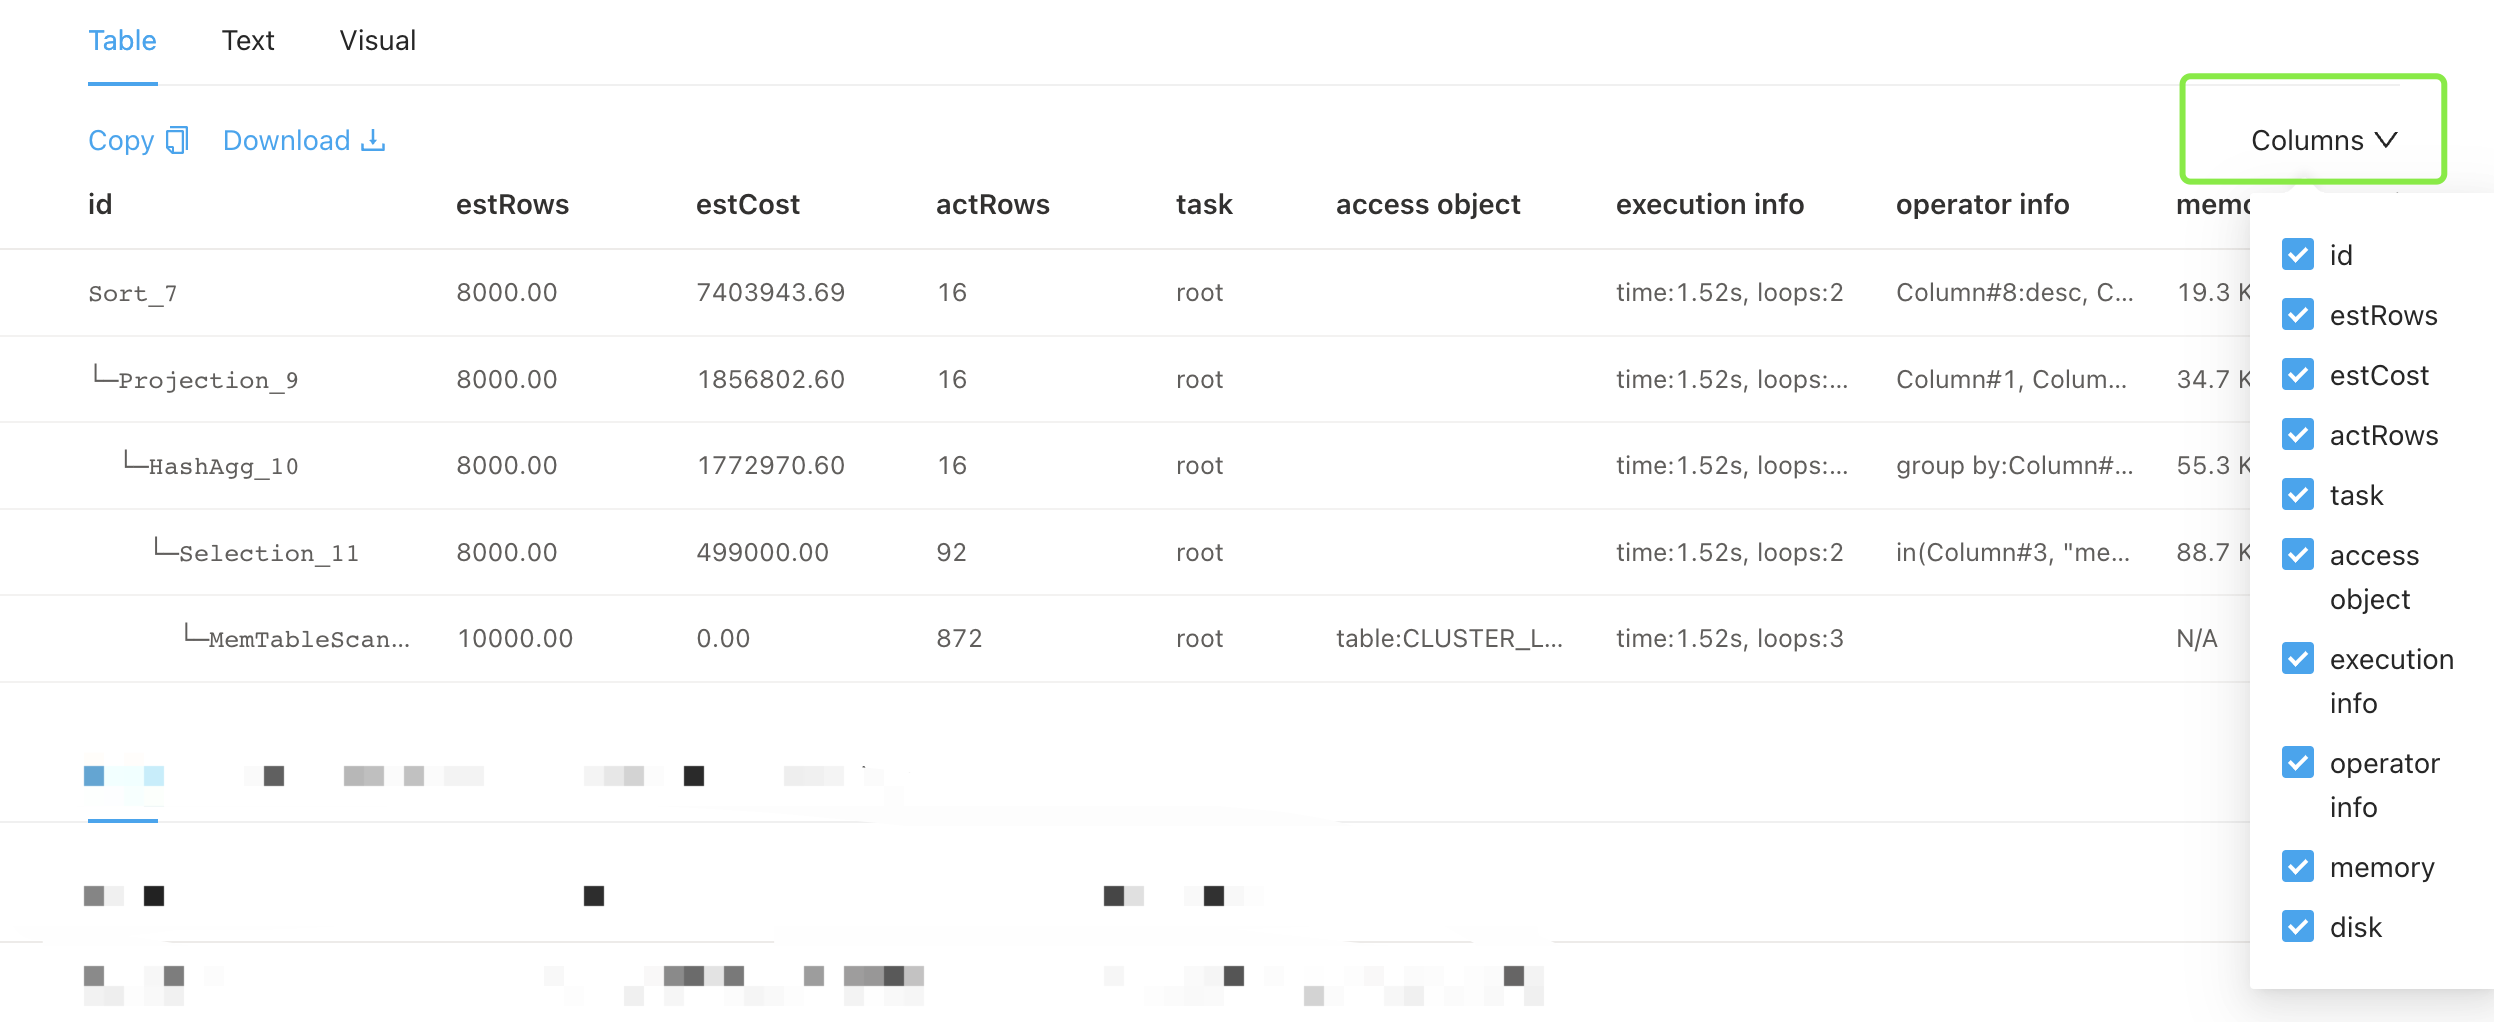
- You can hide and manage columns using the column picker.
Execution plan in graph format
The graph format is more suitable for viewing the execution plan tree of a complex SQL statement and understanding each operator and its corresponding content in detail. The following figure shows an execution plan in graph format:
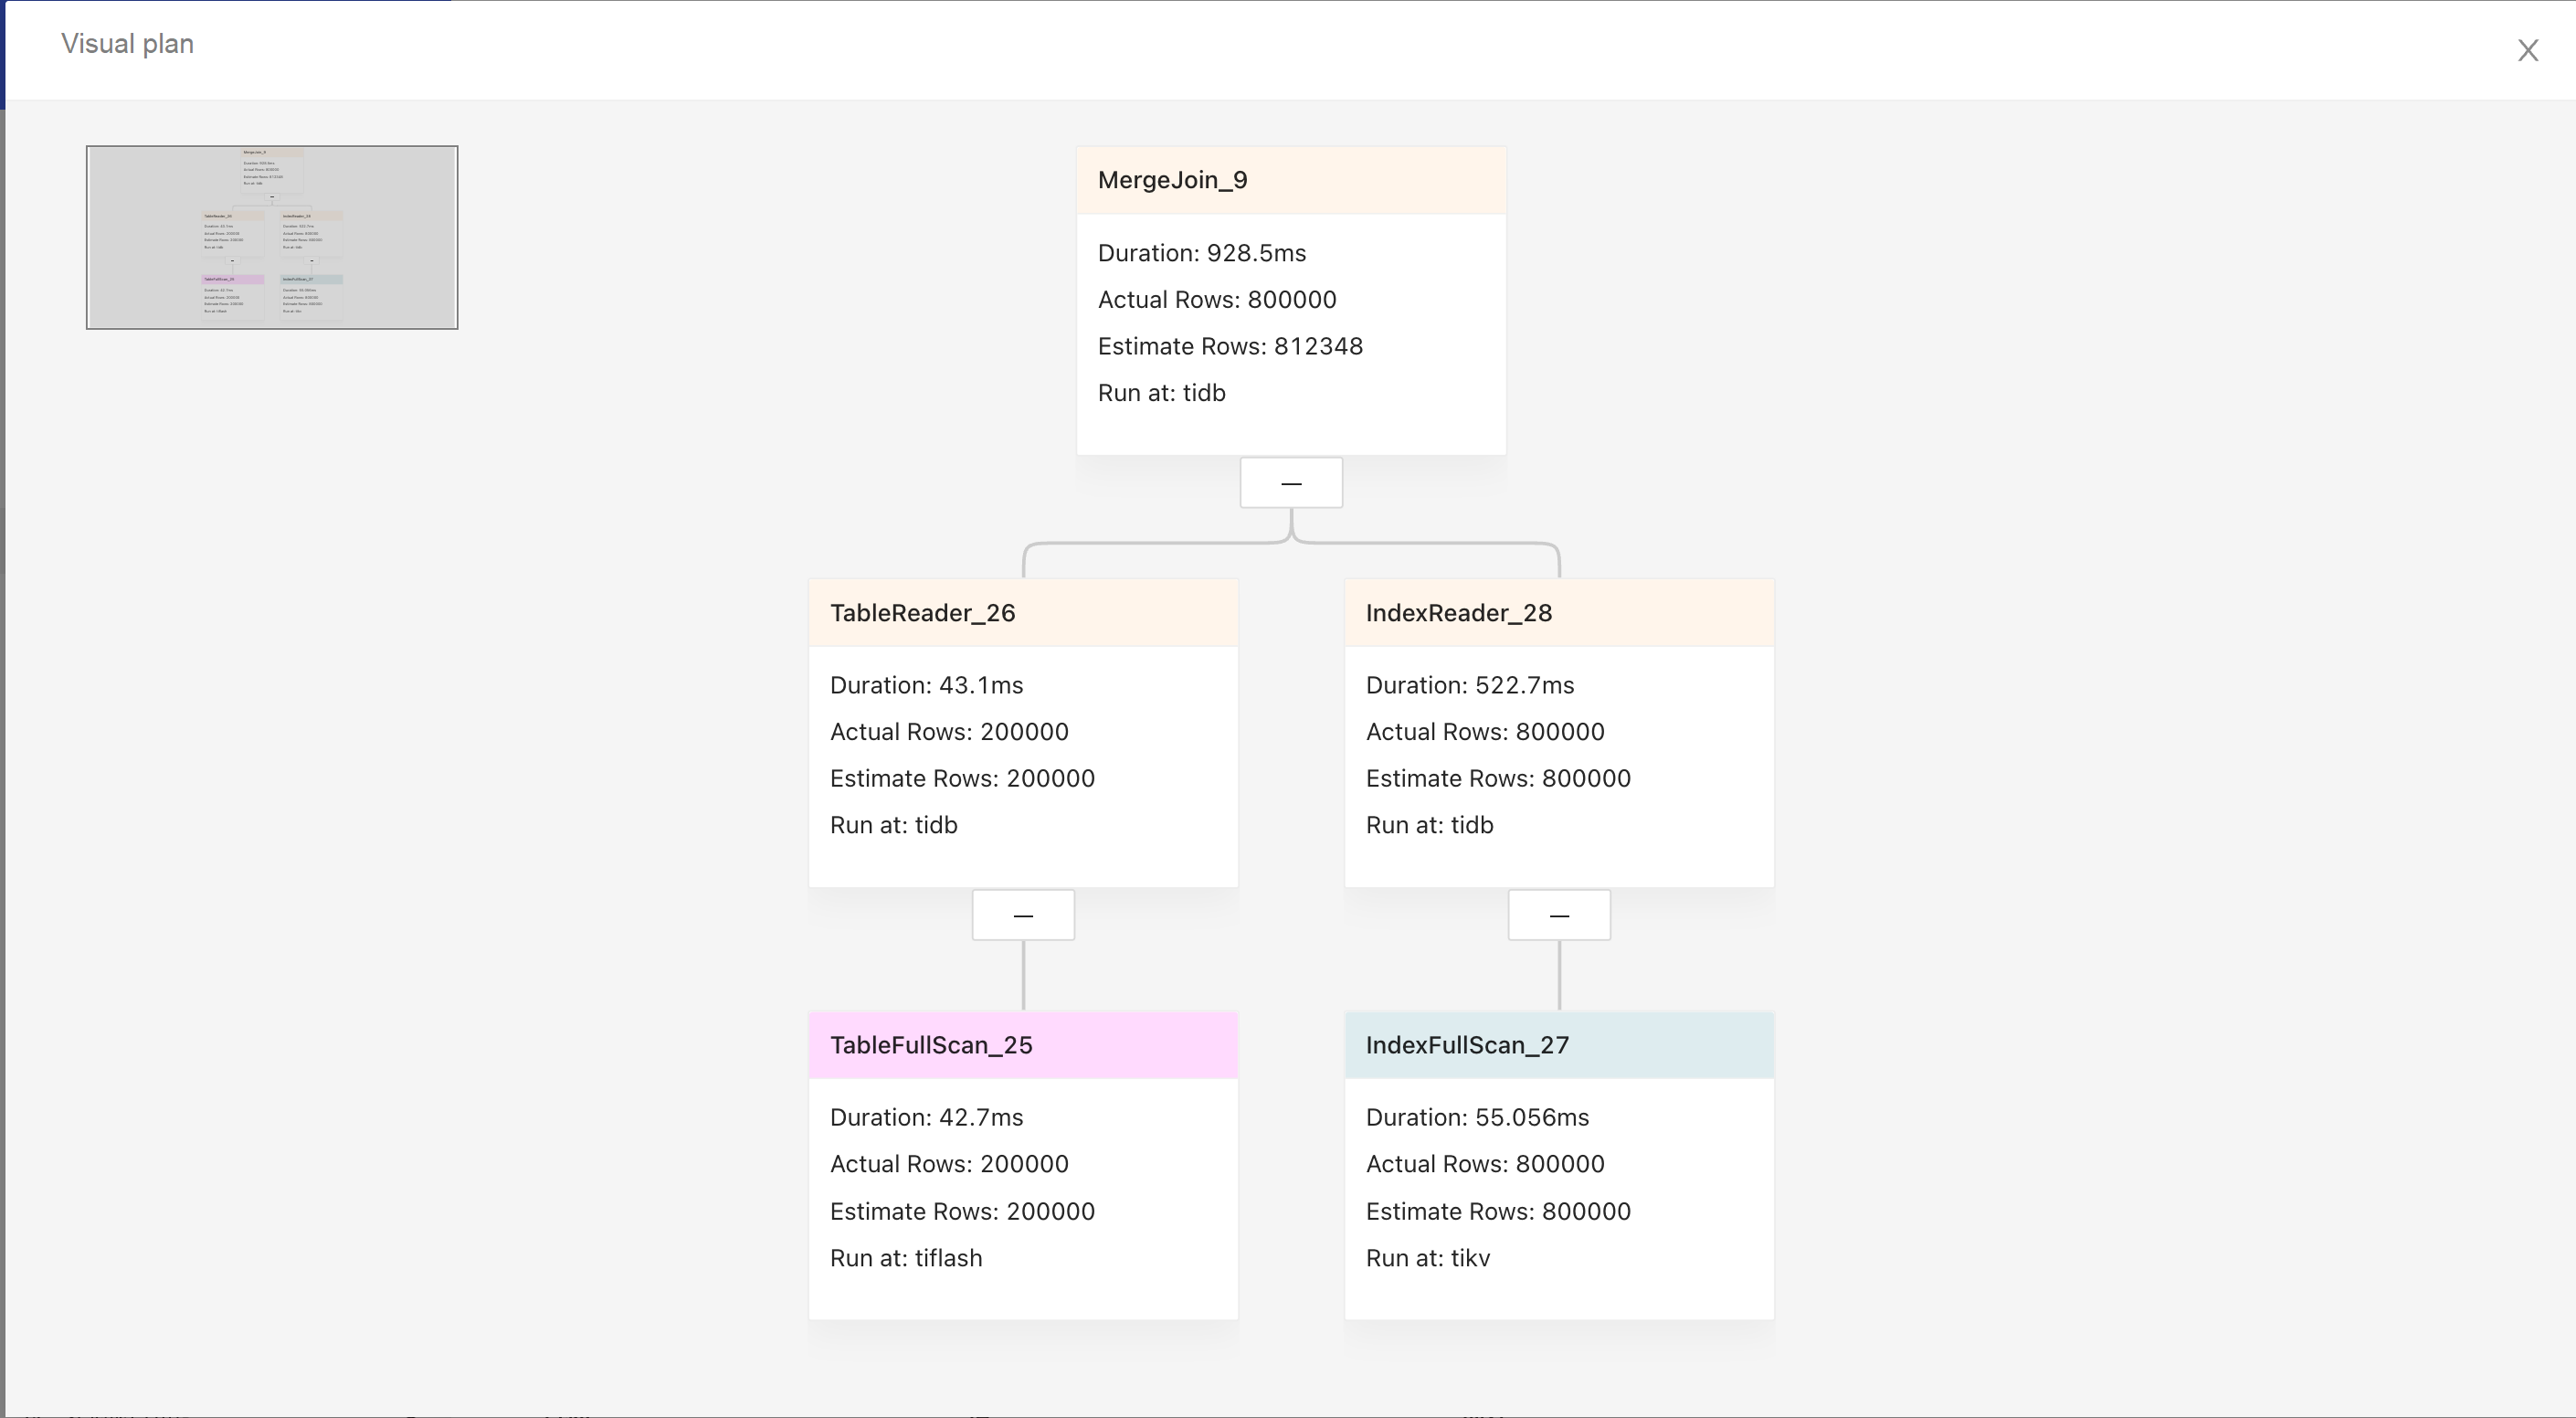
- The graph shows the execution from left to right, and from top to bottom.
- Upper nodes are parent operators and lower nodes are child operators.
- The color of the title bar indicates the component where the operator is executed: yellow stands for TiDB, blue stands for TiKV, and pink stands for TiFlash.
- The title bar shows the operator name and the text shown below is the basic information of the operator.
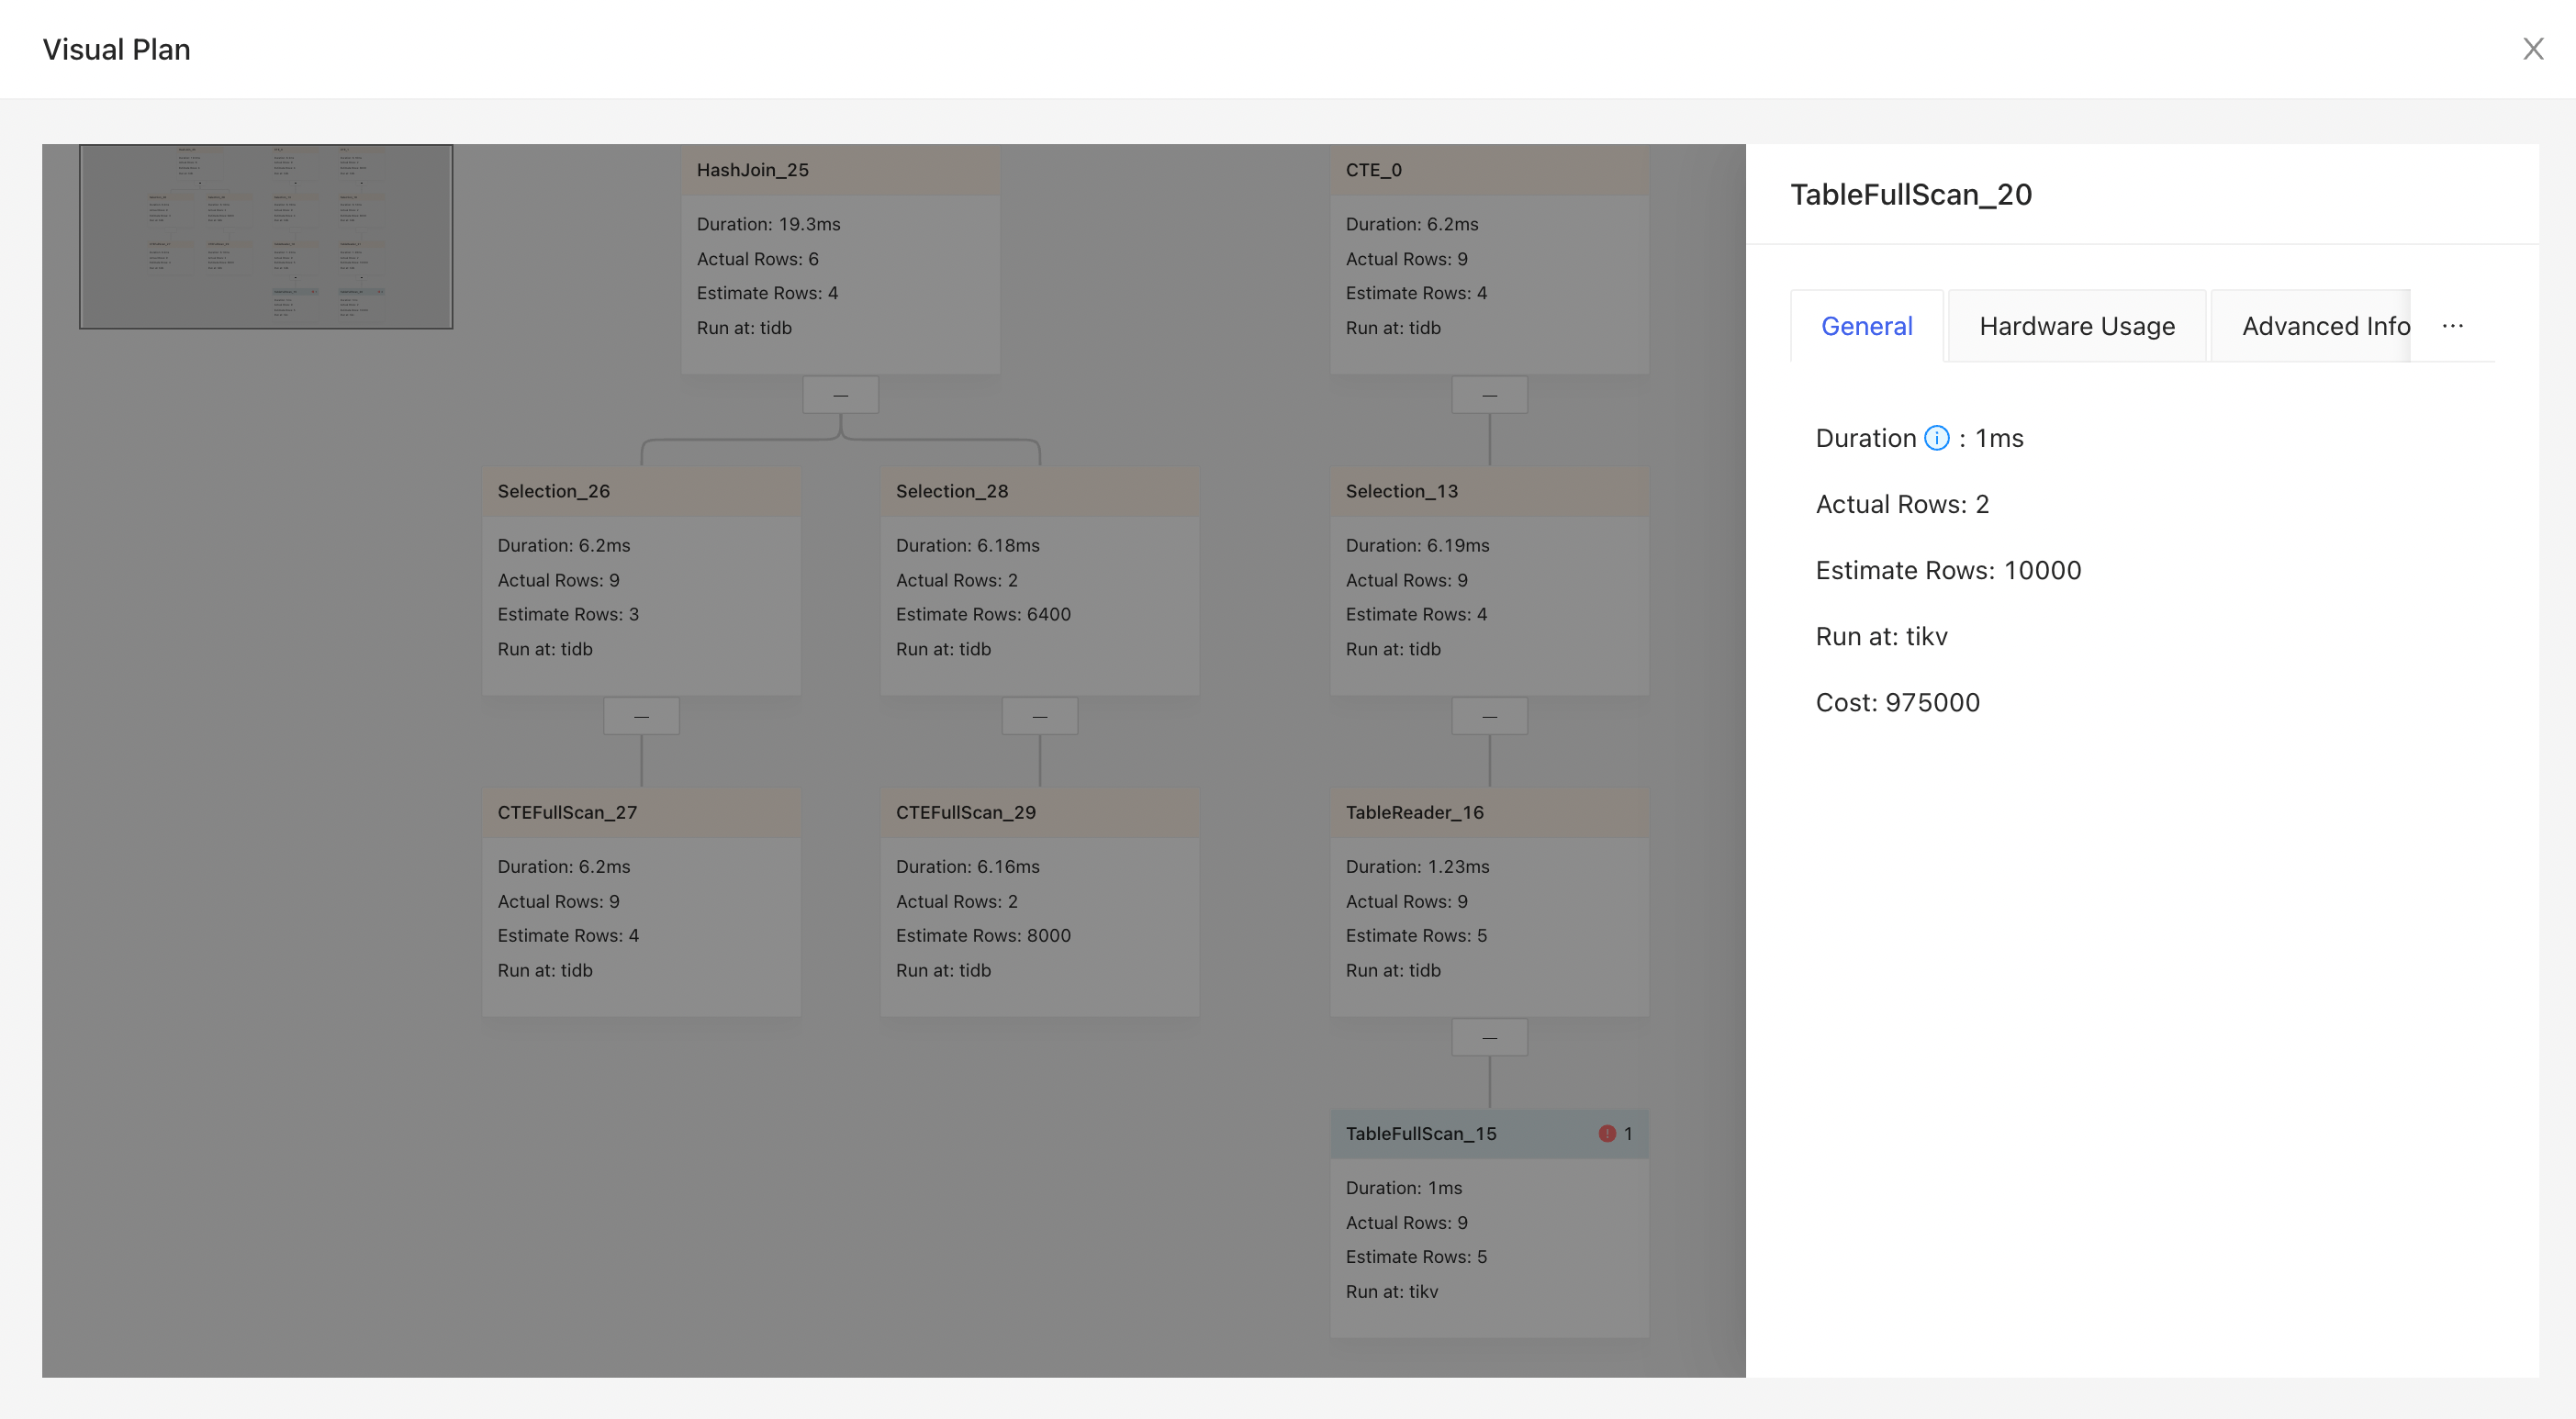
Click the node area, and the detailed operator information is displayed on the right sidebar.
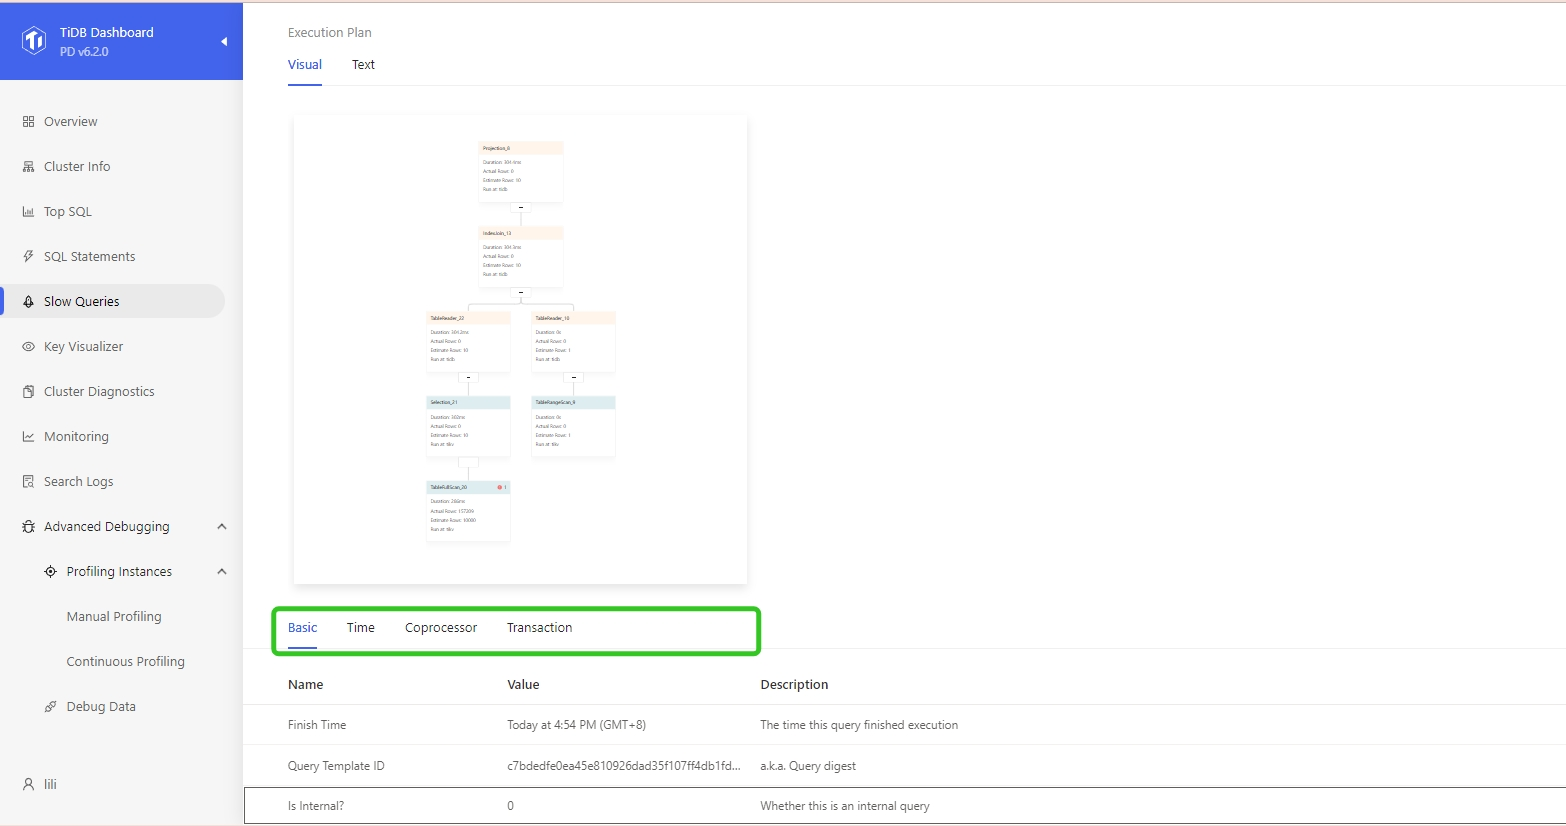
SQL execution details
For basic information, execution time, Coprocessor read, transaction, and slow query of the SQL statement, you can click the corresponding tab titles to switch among different information.
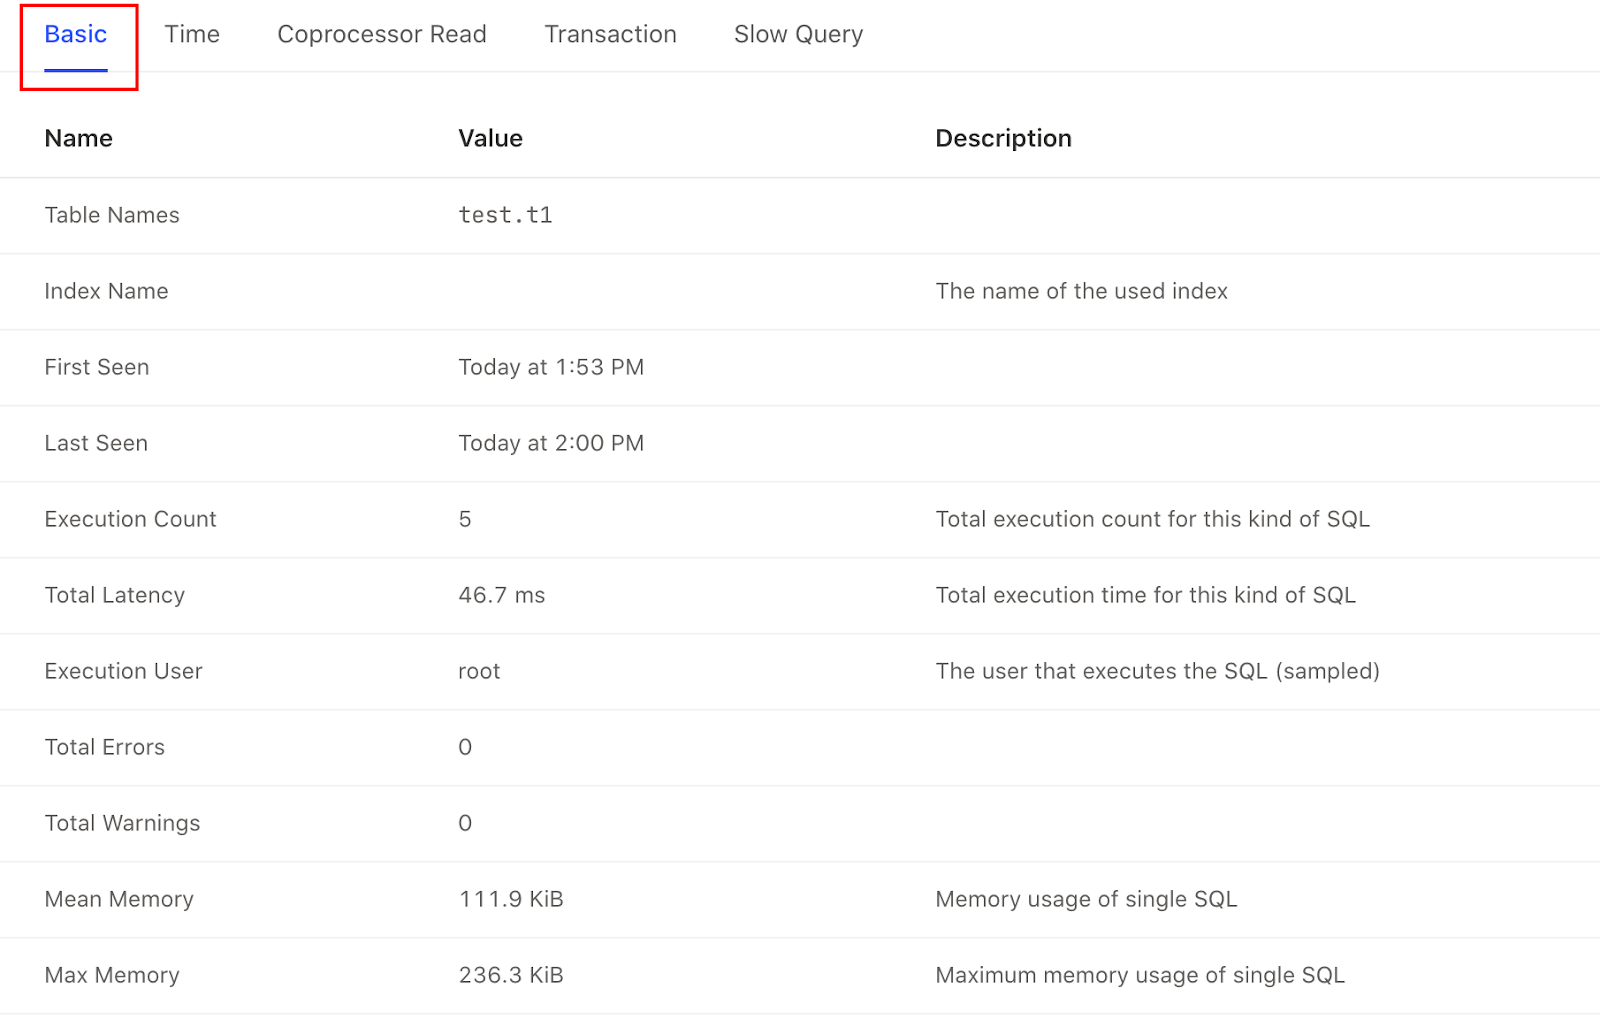
Basic tab
The basic information of a SQL execution includes the table names, index name, execution count, and total latency. The Description column provides detailed description of each field.
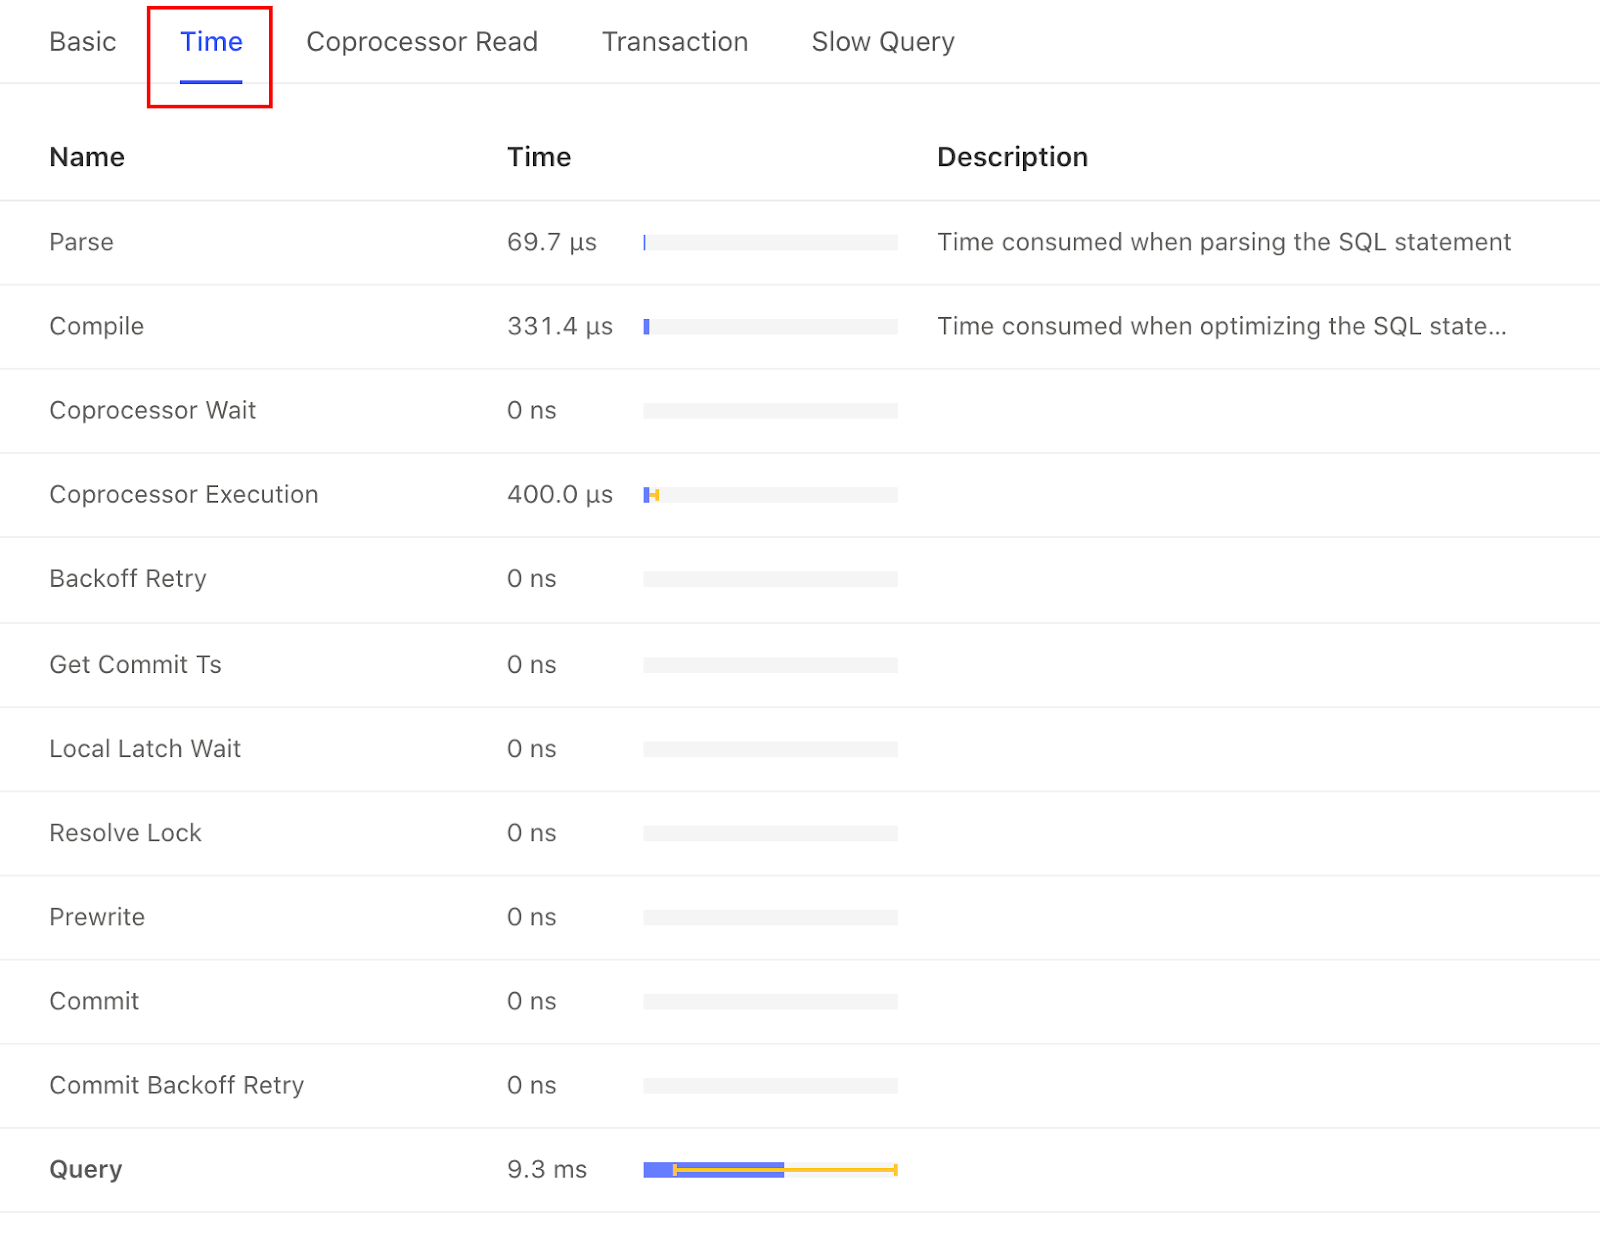
Time tab
Click the Time tab, and you can see how long each stage of the execution plan lasts.
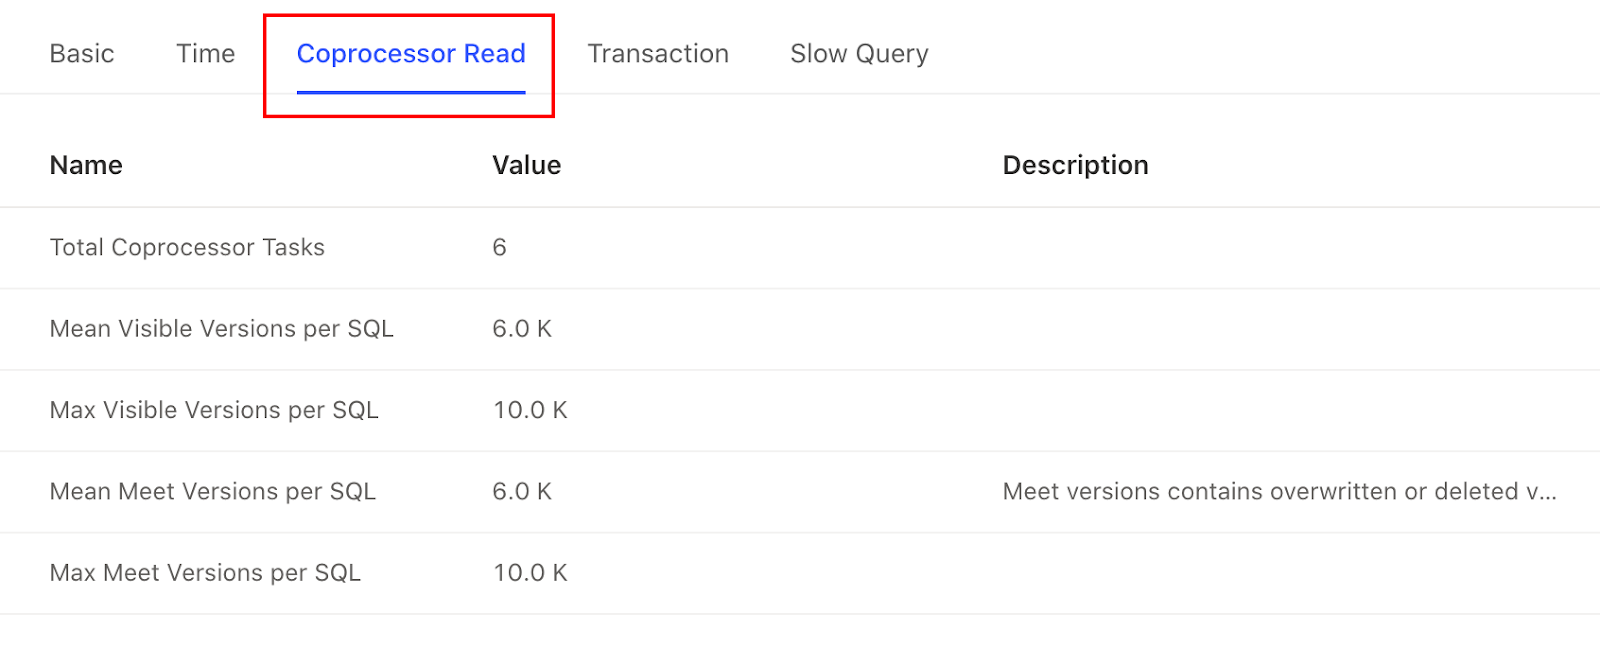
Coprocessor Read tab
Click the Coprocessor Read tab, and you can see information related to Coprocessor read.
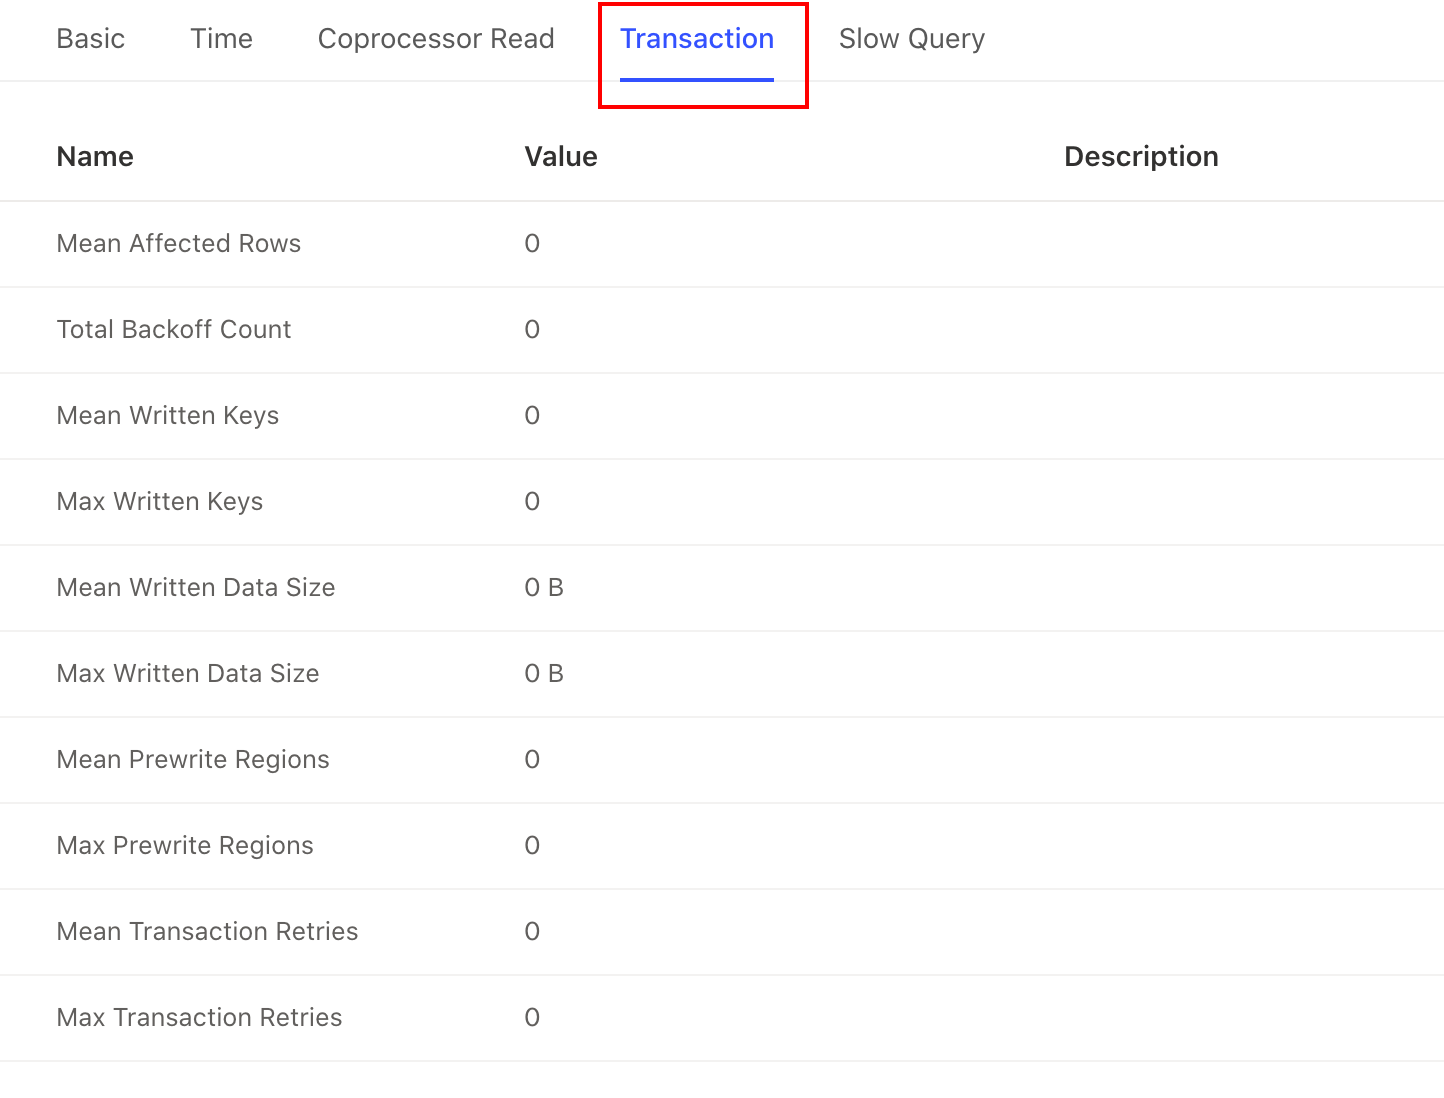
Transaction tab
Click the Transaction tab, and you can see information related to execution plans and transactions, such as the average number of written keys or the maximum number of written keys.
Slow Query tab
If an execution plan is executed too slowly, you can see its associated slow query records under the Slow Query tab.
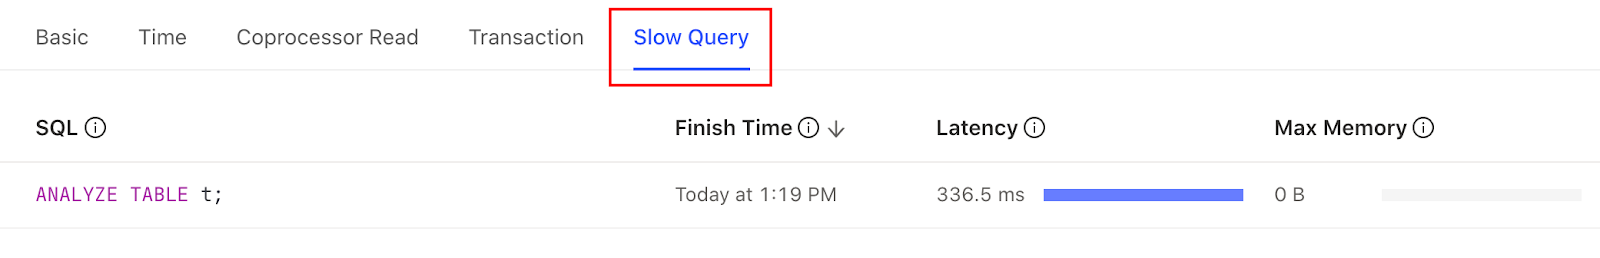
The information displayed in this area has the same structure with the slow query page. See TiDB Dashboard Slow Query Page for details.