TiFlash Performance Analysis and Tuning Methods
This document introduces TiFlash resource utilization and key performance metrics. You can monitor and evaluate the TiFlash cluster performance through the TiFlash panel on the Performance Overview dashboard.
Resource utilization of a TiFlash cluster
With the following three metrics, you can quickly get the resource utilization of a TiFlash cluster:
- CPU: the CPU utilization per TiFlash instance.
- Memory: the memory usage per TiFlash instance.
- IO utilization: the IO utilization per TiFlash instance.
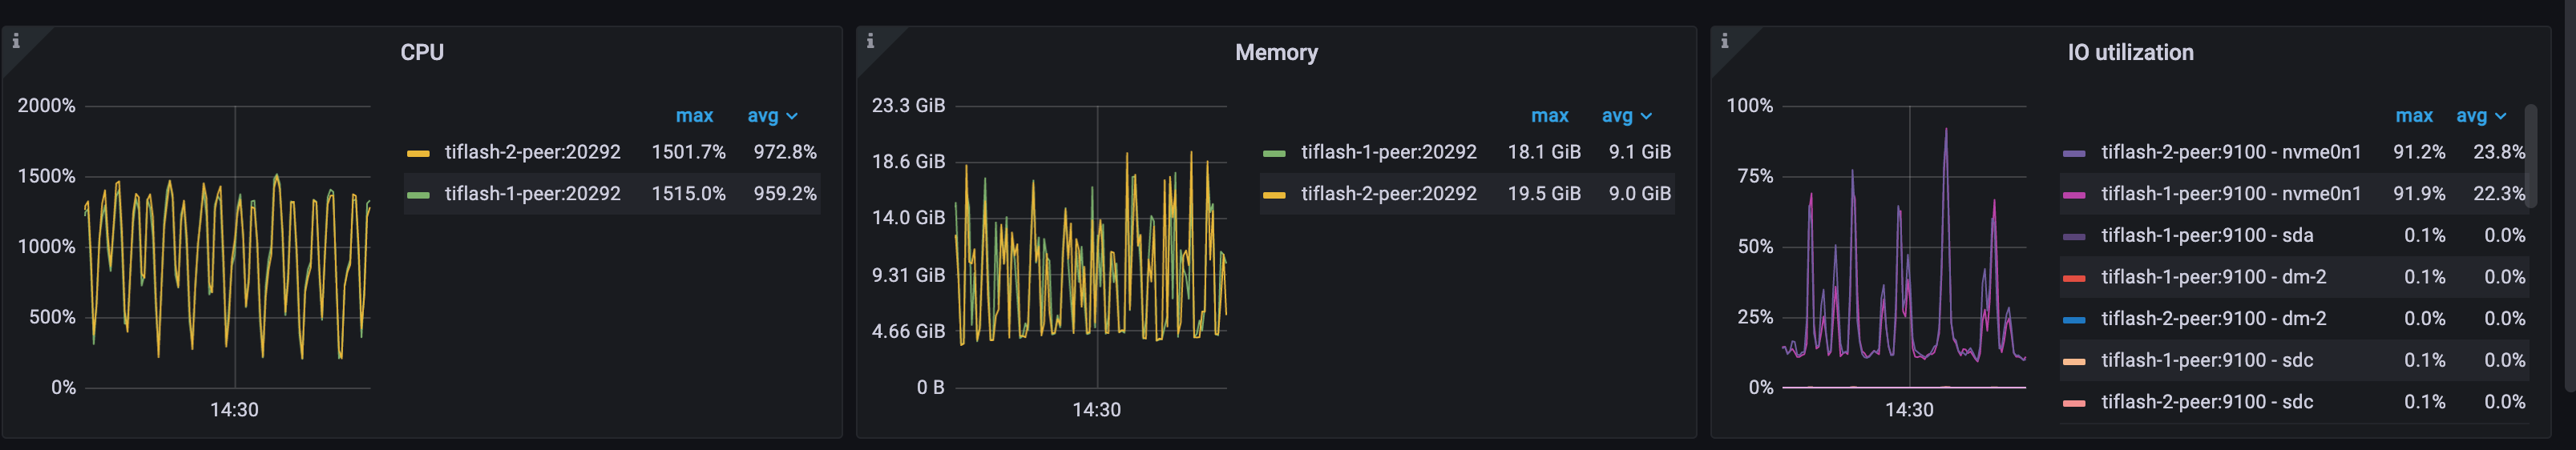
Example: Resource utilization during CH-benCHmark workload
This TiFlash cluster consists of two nodes, each node configured with 16 cores and 48 GB of memory. During the CH-benCHmark workload, CPU utilization can reach up to 1500%, memory usage can reach up to 20 GB, and IO utilization can reach up to 91%. These metrics indicate that TiFlash node resources are approaching saturation.
Key metrics for TiFlash performance
Throughput metrics
With the following metrics, you can get the throughput of TiFlash:
- MPP Query count: the instant value of MPP query count for each TiFlash instance, reflecting the current number of MPP queries that need to be processed by the TiFlash instance (including those being processed and those awaiting scheduling).
- Request QPS: the number of coprocessor requests received by all TiFlash instances.
run_mpp_task,dispatch_mpp_task, andmpp_establish_connare MPP requests.batch: the number of batch requests.cop: the number of coprocessor requests that are sent directly via the coprocessor interface.cop_execution: the number of coprocessor requests currently being executed.remote_read,remote_read_constructed, andremote_read_sentare remote read-related metrics. An increase in remote reads usually indicates an issue in the system.
- Executor QPS: the number of each type of dag operators in the requests received by all TiFlash instances, where
table_scanis the table scan operator,selectionis the selection operator,aggregationis the aggregation operator,top_nis the TopN operator,limitis the limit operator,joinis a join operator,exchange_senderis a data sending operator, andexchange_receiveris a data receiving operator.
Latency metrics
With the following metrics, you can get the latency of TiFlash:
Request Duration Overview: provides a stacked chart of the total processing duration for all request types in all TiFlash instances per second.
If the type of a request is
run_mpp_task,dispatch_mpp_task, ormpp_establish_conn, it indicates that the SQL statement execution has been partially or fully pushed down to TiFlash, typically involving join and data distribution operations. This is the most common request type in TiFlash.If the type of a request is
cop, it indicates that the statement related to this request has not been fully pushed down to TiFlash. Typically, TiDB pushes down the table full scan operator to TiFlash for data access and filtering. Ifcopbecomes the most common request type in the stacked chart, you need to check if it is reasonable.- If the amount of data queried by a SQL statement is large, the optimizer might estimate that TiFlash full table scans are more cost-effective according to the cost model.
- If the schema of a queried table lacks suitable indexes, the optimizer can only push the query down to TiFlash for a full table scan, even if the amount of data to be queried is small. In this case, it is more efficient to create proper indexes and access the data through TiKV.
Request Duration: the total processing duration for each MPP and coprocessor request type in all TiFlash instances, which includes the average latency and p99 latency.
Request Handle Duration: the time from the start of executing the
copandbatch coprequests to the completion of the execution, excluding waiting time. This metric is only applicable to thecopandbatch coptypes of requests, including average and P99 latency.
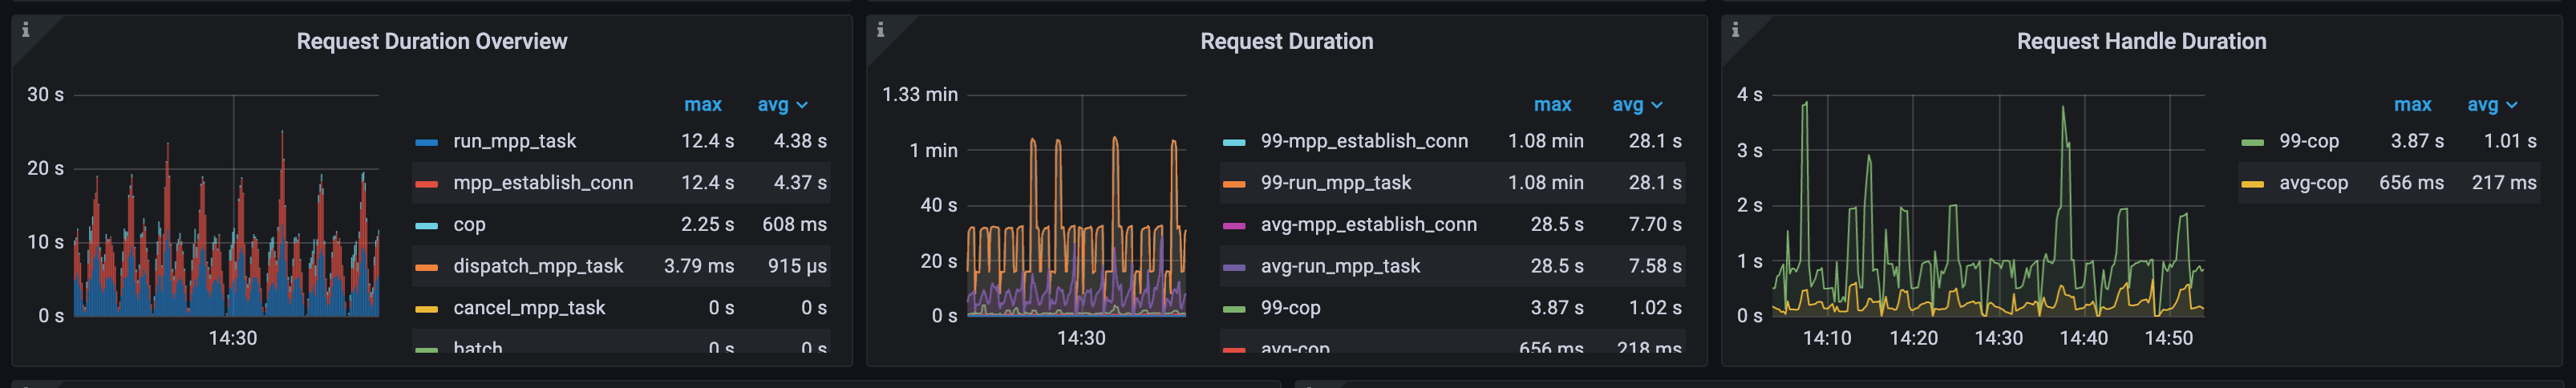
Example 1: Processing duration overview of TiFlash MPP requests
In the workload of the following diagram, run_mpp_task and mpp_establish_conn requests constitute the majority of the total processing duration, indicating that most of the requests are MPP tasks that are fully pushed down to TiFlash for execution.
The processing duration of cop requests is relatively small, indicating that some of the requests are pushed down to TiFlash for data access and filtering through the coprocessor.
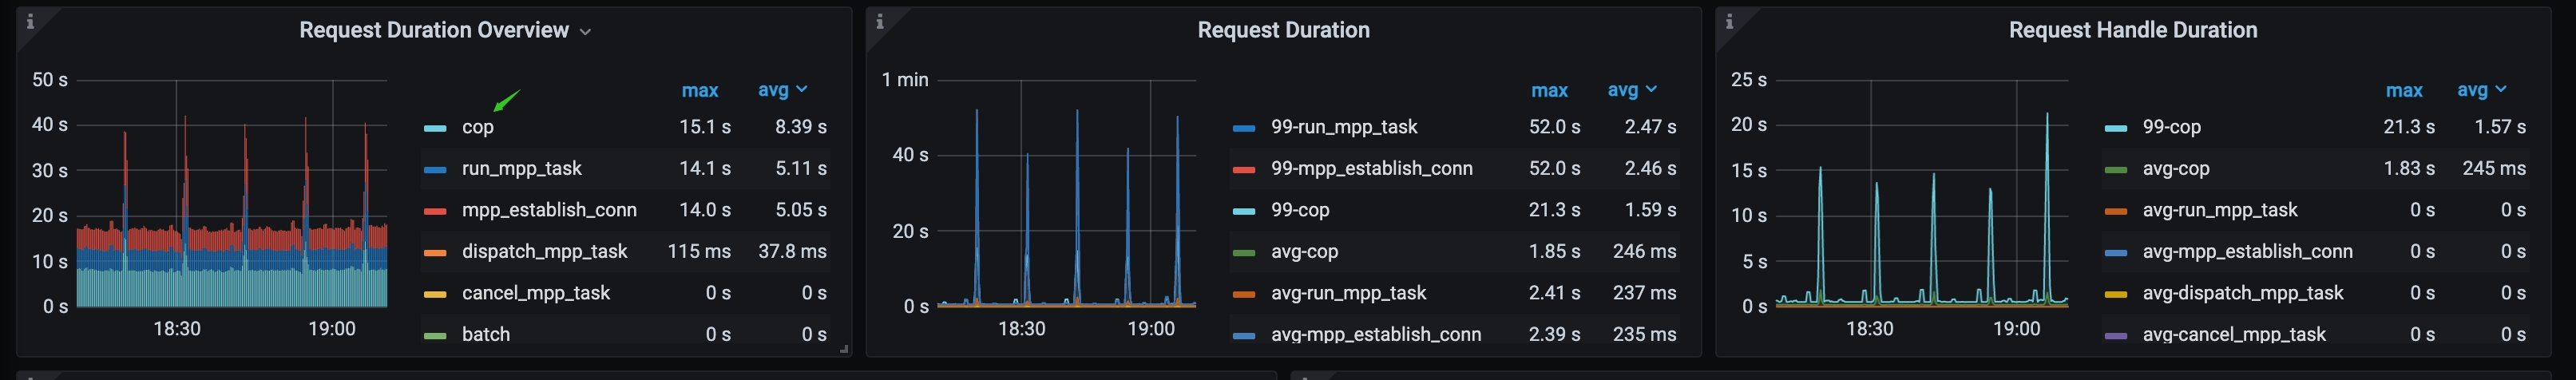
Example 2: TiFlash cop requests constitute the majority of the total processing duration
In the workload of the following diagram, cop requests constitute the majority of the total processing duration. In this case, you can check the SQL execution plan to see why these cop requests are generated.
Raft-related metrics
With the following metrics, you can get the Raft replication status of TiFlash:
Raft Wait Index Duration: the duration of waiting until the local Region index >=
read_indexfor all TiFlash instances, which represents the latency of thewait_indexoperation. If this metric is too high, it indicates that data replication from TiKV to TiFlash has a significant latency. Possible reasons include the following:- TiKV resource is overloaded.
- TiFlash resource is overloaded, especially IO resources.
- There is a network bottleneck between TiKV and TiFlash.
Raft Batch Read Index Duration: the latency of
read_indexfor all TiFlash instances. If this metric is too high, it indicates that the interaction between TiFlash and TiKV is slow. Possible reasons include the following:- TiFlash resource is overloaded.
- TiKV resource is overloaded.
- There is a network bottleneck between TiFlash and TiKV.
IO throughput metrics
With the following metrics, you can get the IO throughput of TiFlash:
Write Throughput By Instance: the throughput of data written by each TiFlash instance. It includes the throughput by applying the Raft data logs and Raft snapshots.
Write flow: the traffic of disk writes by all TiFlash instances.
- File Descriptor: the stable layer of the DeltaTree storage engine used by TiFlash.
- Page: refers to Pagestore, the Delta change layer of the DeltaTree storage engine used by TiFlash.
Read flow: traffic of disk read operations for all TiFlash instances.
- File Descriptor: the stable layer of the DeltaTree storage engine used by TiFlash.
- Page: refers to Pagestore, the Delta change layer of the DeltaTree storage engine used by TiFlash.
You can calculate the write amplification factor of the entire TiFlash cluster using the (Read flow + Write flow) ÷ total Write Throughput By Instance formula.
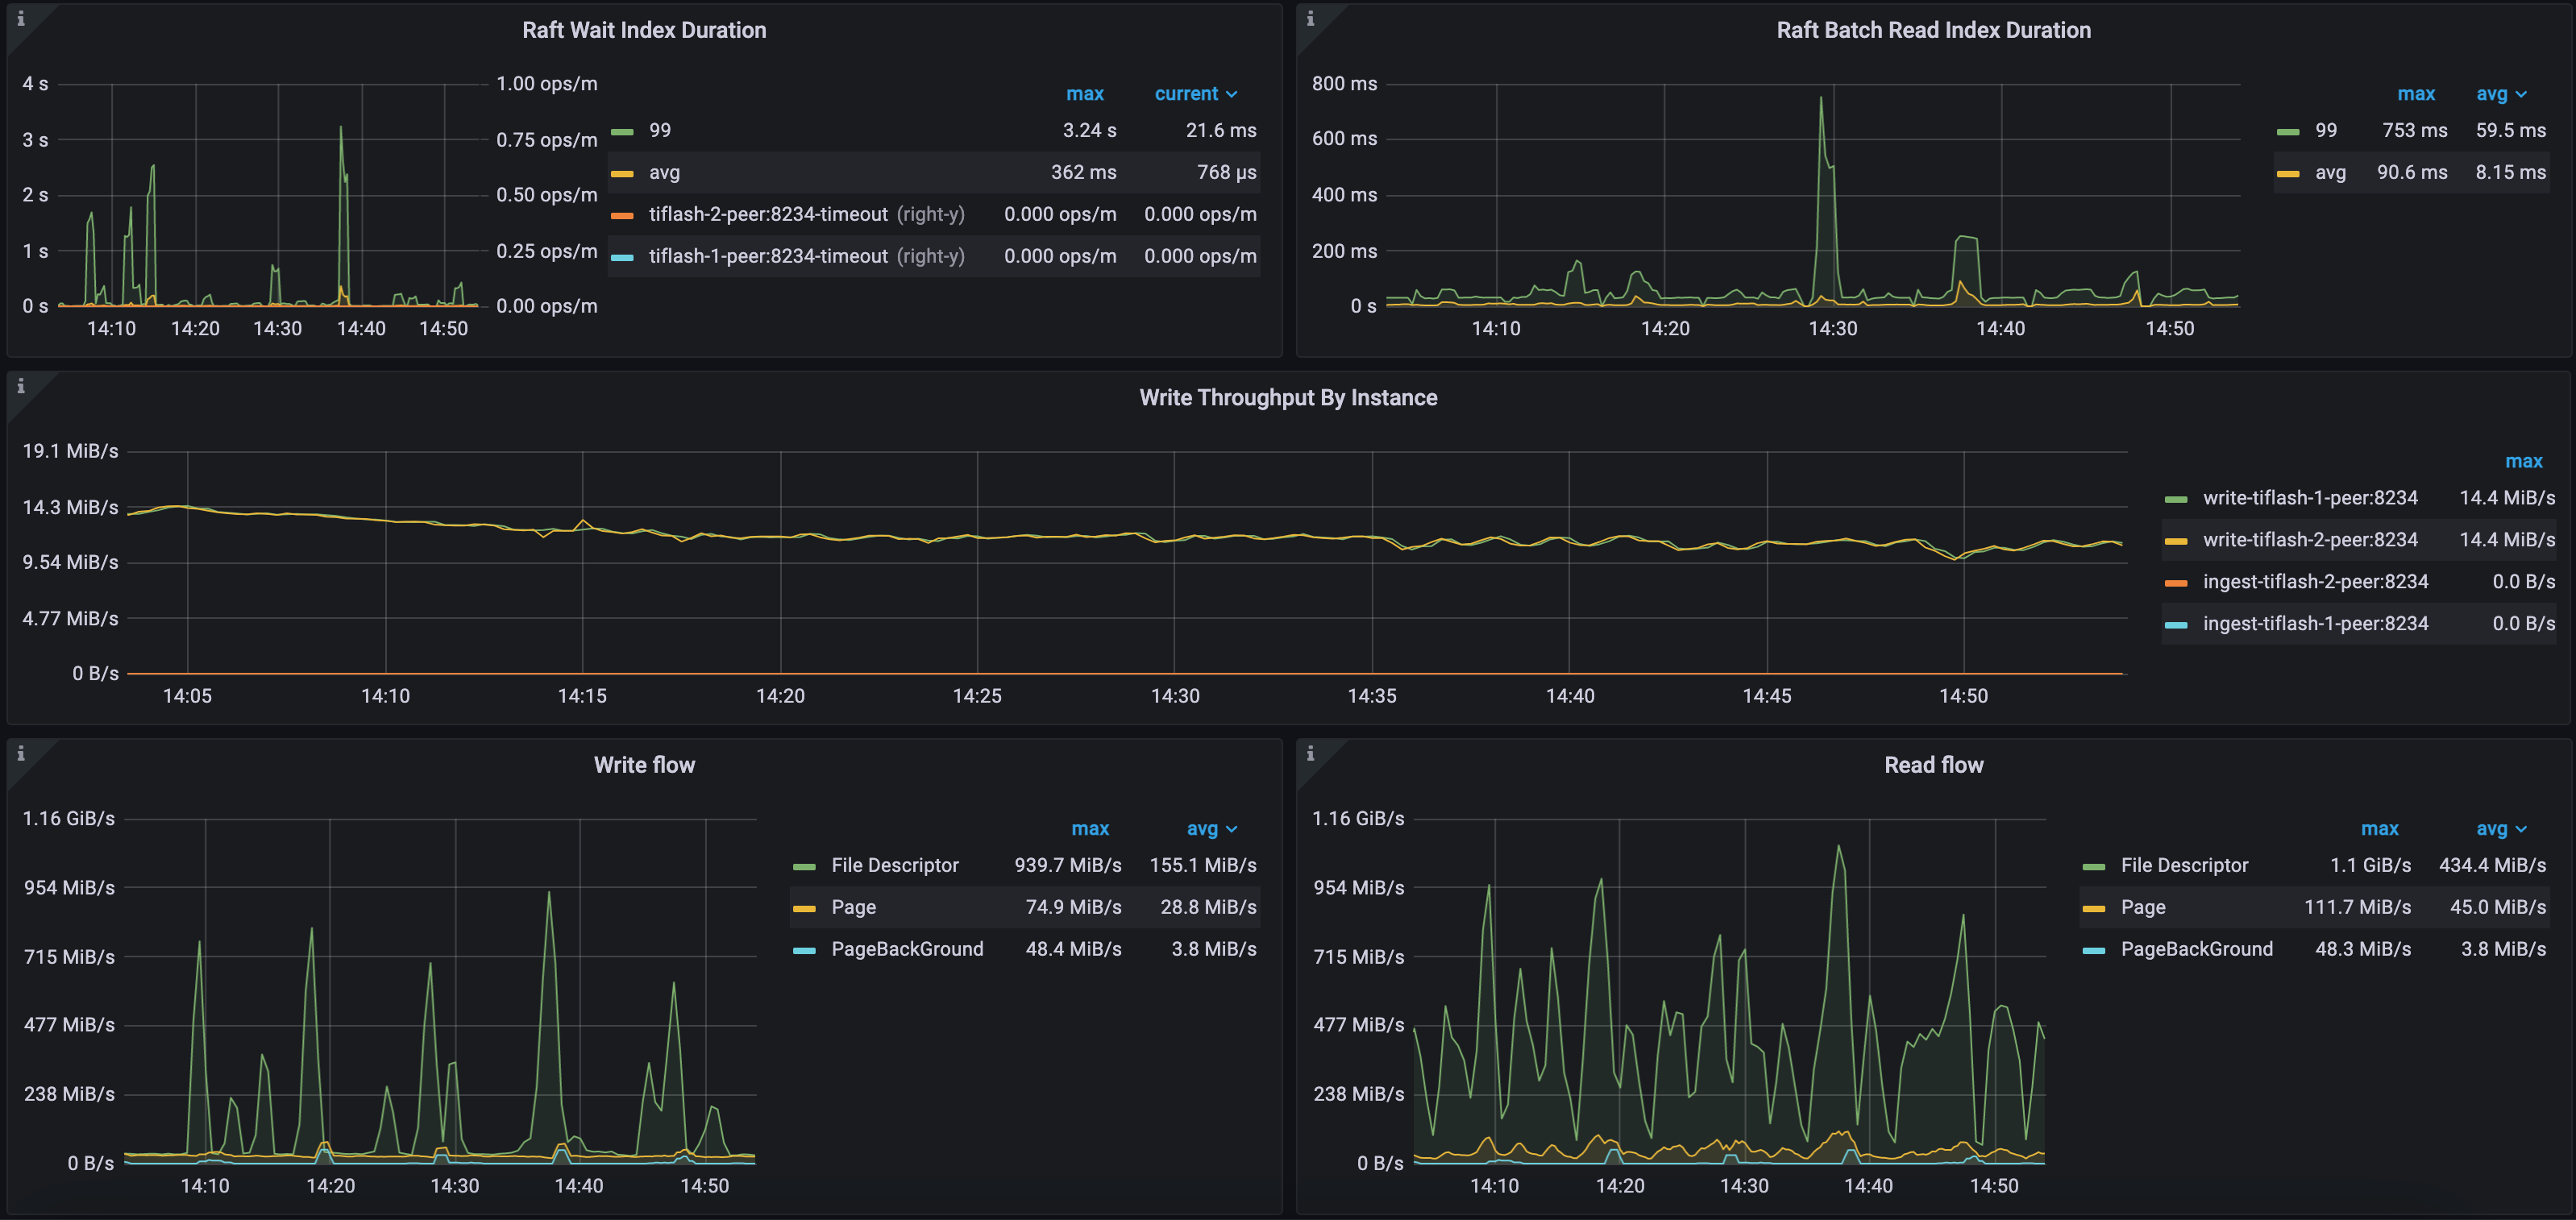
Example 1: Raft and IO metrics of the CH-benCHmark workload in a self-hosted environment
As shown in the following diagram, the Raft Wait Index Duration and the 99th percentile of Raft Batch Read Index Duration for this TiFlash cluster are relatively high, at 3.24 seconds and 753 milliseconds respectively. This is because the TiFlash workload in this cluster is high and latency occurs in data replication.
In this cluster, there are two TiFlash nodes. The incremental data replication speed from TiKV to TiFlash is approximately 28 MB per second. The maximum write throughput of the stable layer (File Descriptor) is 939 MB/s, and the maximum read throughput is 1.1 GiB/s. Meanwhile, the maximum write throughput of the Delta layer (Page) is 74 MB/s, and the maximum read throughput is 111 MB/s. In this environment, TiFlash uses dedicated NVME disks, which have strong IO throughput capabilities.
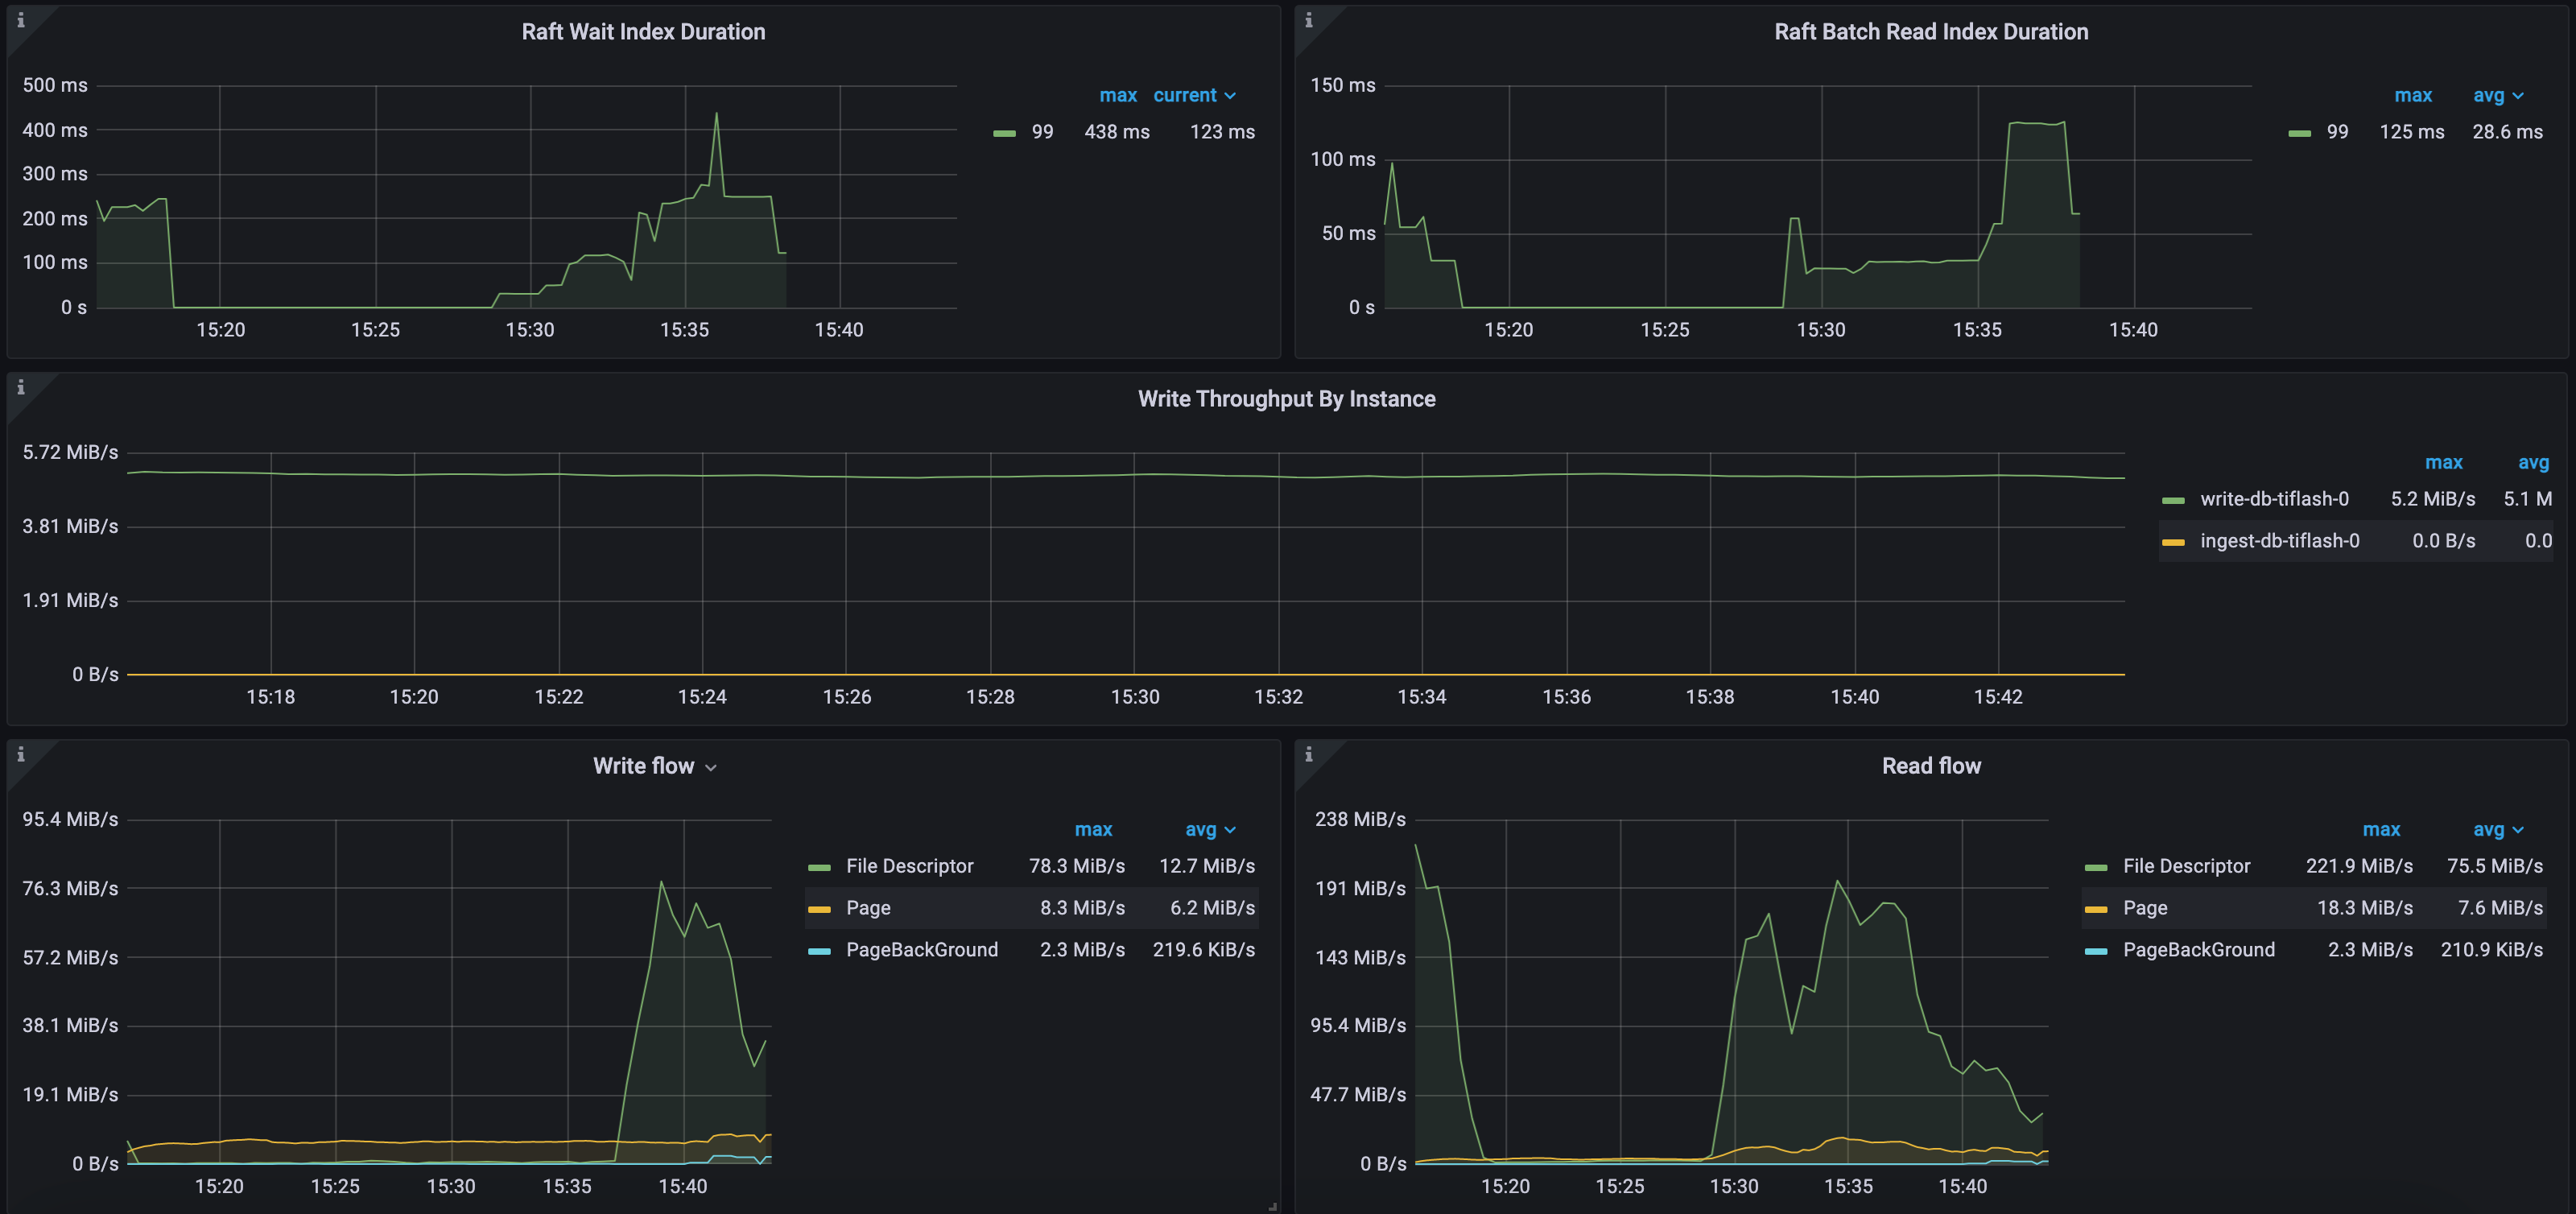
Example 2: Raft and IO metrics of the CH-benCHmark workload in a public cloud deployment environment
As shown in the following diagram, the 99th percentile of Raft Wait Index Duration is up to 438 milliseconds, and 99th percentile of the Raft Batch Read Index Duration is up to 125 milliseconds. This cluster has only one TiFlash node. TiKV replicates about 5 MB of incremental data to TiFlash per second. The maximum write traffic of the stable layer (File Descriptor) is 78 MB/s and the maximum read traffic is 221 MB/s. In the meantime, the maximum write traffic of the Delta layer (Page) is 8 MB/s and the maximum read traffic is 18 MB/s. In this environment, TiFlash uses an AWS EBS cloud disk, which has relatively weak IO throughput.