TiCDC Performance Analysis and Tuning Methods
This document introduces TiCDC resource utilization and key performance metrics. You can monitor and evaluate TiCDC performance on data replication through the CDC panel on the Performance Overview dashboard.
Resource utilization of a TiCDC cluster
With the following three metrics, you can quickly get the resource utilization of a TiCDC cluster:
- CPU usage: the CPU usage per TiCDC node.
- Memory usage: the memory usage per TiCDC node.
- Goroutine count: the number of goroutines per TiCDC node.
Key metrics for TiCDC data replication
TiCDC overall metrics
With the following metrics, you can get an overview of TiCDC data replication:
Changefeed checkpoint lag: the progress lag of data replication between the upstream and the downstream, measured in seconds.
If the speed at which TiCDC consumes data and writes downstream keeps up with upstream data changes, this metric remains within a small latency range, typically within 10 seconds. Otherwise, this metric will continue to increase.
When this metric (that is,
Changefeed checkpoint lag) increases, common reasons are as follows:- Insufficient system resources: if the CPU, memory, or disk space of TiCDC is insufficient, it might cause data processing to be too slow, which results in a long checkpoint of the TiCDC changefeed.
- Network issues: if network interruptions, lags, or insufficient bandwidth occur in TiCDC, it might affect data transfer speed, which results in a long checkpoint of the TiCDC changefeed.
- High QPS in the upstream: if the data to be processed by TiCDC is excessively large, it might cause data processing timeouts, which results in an increased checkpoint of the TiCDC changefeed. Typically, a single TiCDC node can handle a maximum QPS of around 60K.
- Database issues:
- The gap between the
min resolved tsof the upstream TiKV cluster and the latest PD TSO is significant. This issue usually occurs because TiKV fails to advance the resolved ts in time when the write workload of the upstream is excessively heavy. - The write latency in downstream databases is high, blocking TiCDC from replicating data to the downstream timely.
- The gap between the
Changefeed resolved ts lag: the progress lag between the internal replication status of a TiCDC node and the upstream, measured in seconds. If this metric is high, it indicates that the data processing capability of the TiCDC Puller or Sorter module might be insufficient, or there might be network latency or slow disk read/write speed issues. In such cases, to ensure the efficient and stable operation of TiCDC, you need to take appropriate measures, such as increasing the number of TiCDC nodes or optimizing the network configuration.
The status of changefeeds: for status explanations of changefeeds, see Changefeed state transfer.
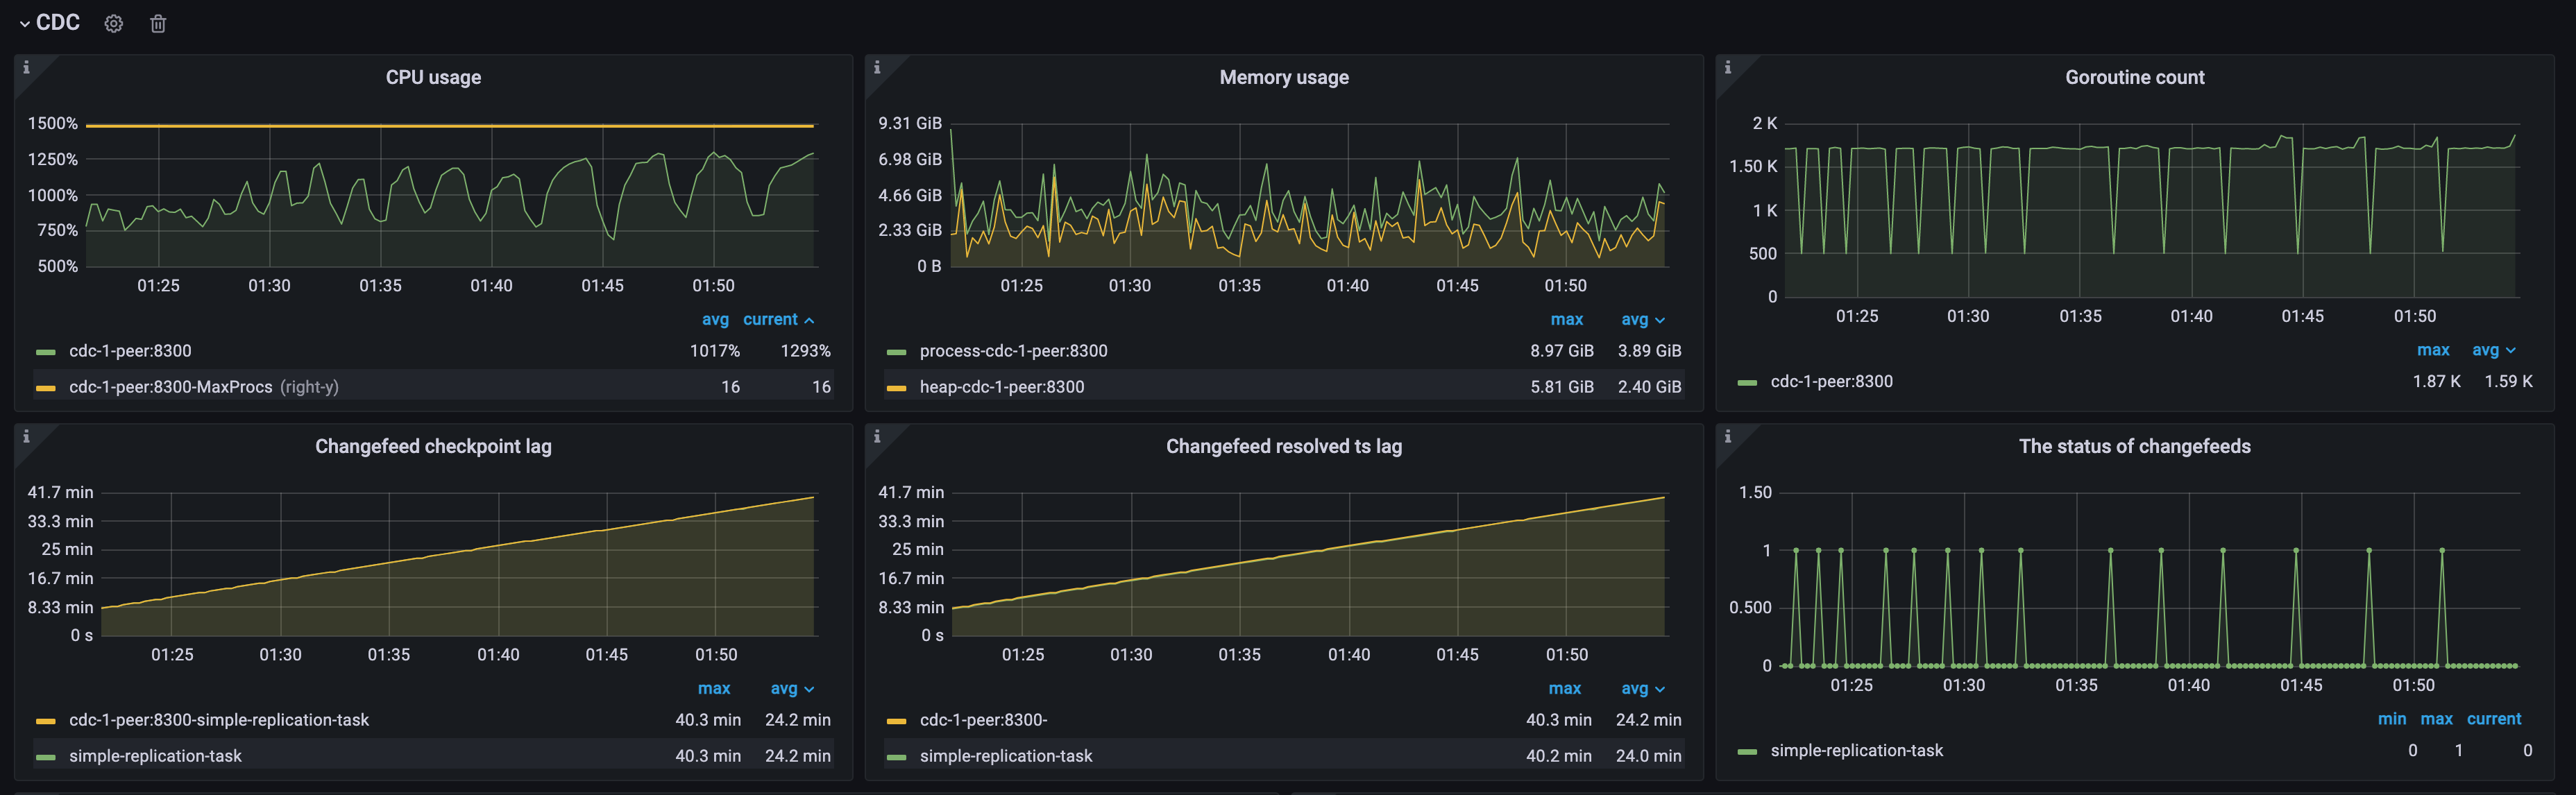
Example 1: High checkpoint lag due to high upstream QPS in the case of a single TiCDC node
As shown in the following diagram, because the upstream QPS is excessively high and there is only a single TiCDC node in the cluster, the TiCDC node is overloaded, the CPU usage is high, and both Changefeed checkpoint lag and Changefeed resolved ts lag keep increasing. The changefeed status intermittently transitions from 0 to 1, indicating that the changefeed keeps getting errors. You can try resolving this issue by adding more resources as follows:
- Add more TiCDC nodes: scale out the TiCDC cluster to multiple nodes to increase processing capacity.
- Optimize TiCDC node resources: increase CPU and memory configurations of the TiCDC node to improve performance.
Data flow throughput metrics and downstream latency
With the following metrics, you can learn the data flow throughput and downstream latency of TiCDC:
- Puller output events/s: the number of rows that the Puller module of TiCDC nodes sends to the Sorter module per second.
- Sorter output events/s: the number of rows that the Sorter module of TiCDC nodes sends to the Mounter module per second.
- Mounter output events/s: the number of rows that the Mounter module of TiCDC nodes sends to the Sink module per second.
- Table sink output events/s: the number of rows that the Table Sorter module of the TiCDC nodes sends to the Sink module per second.
- SinkV2 - Sink flush rows/s: the number of rows that the Sink module in the TiCDC node sends to the downstream per second.
- Transaction Sink Full Flush Duration: the average latency and p999 latency of writing downstream transactions by the MySQL Sink of TiCDC nodes.
- MQ Worker Send Message Duration Percentile: the latency of sending messages by MQ worker when the downstream is Kafka.
- Kafka Outgoing Bytes: the traffic of writing downstream transactions in MQ Workload.
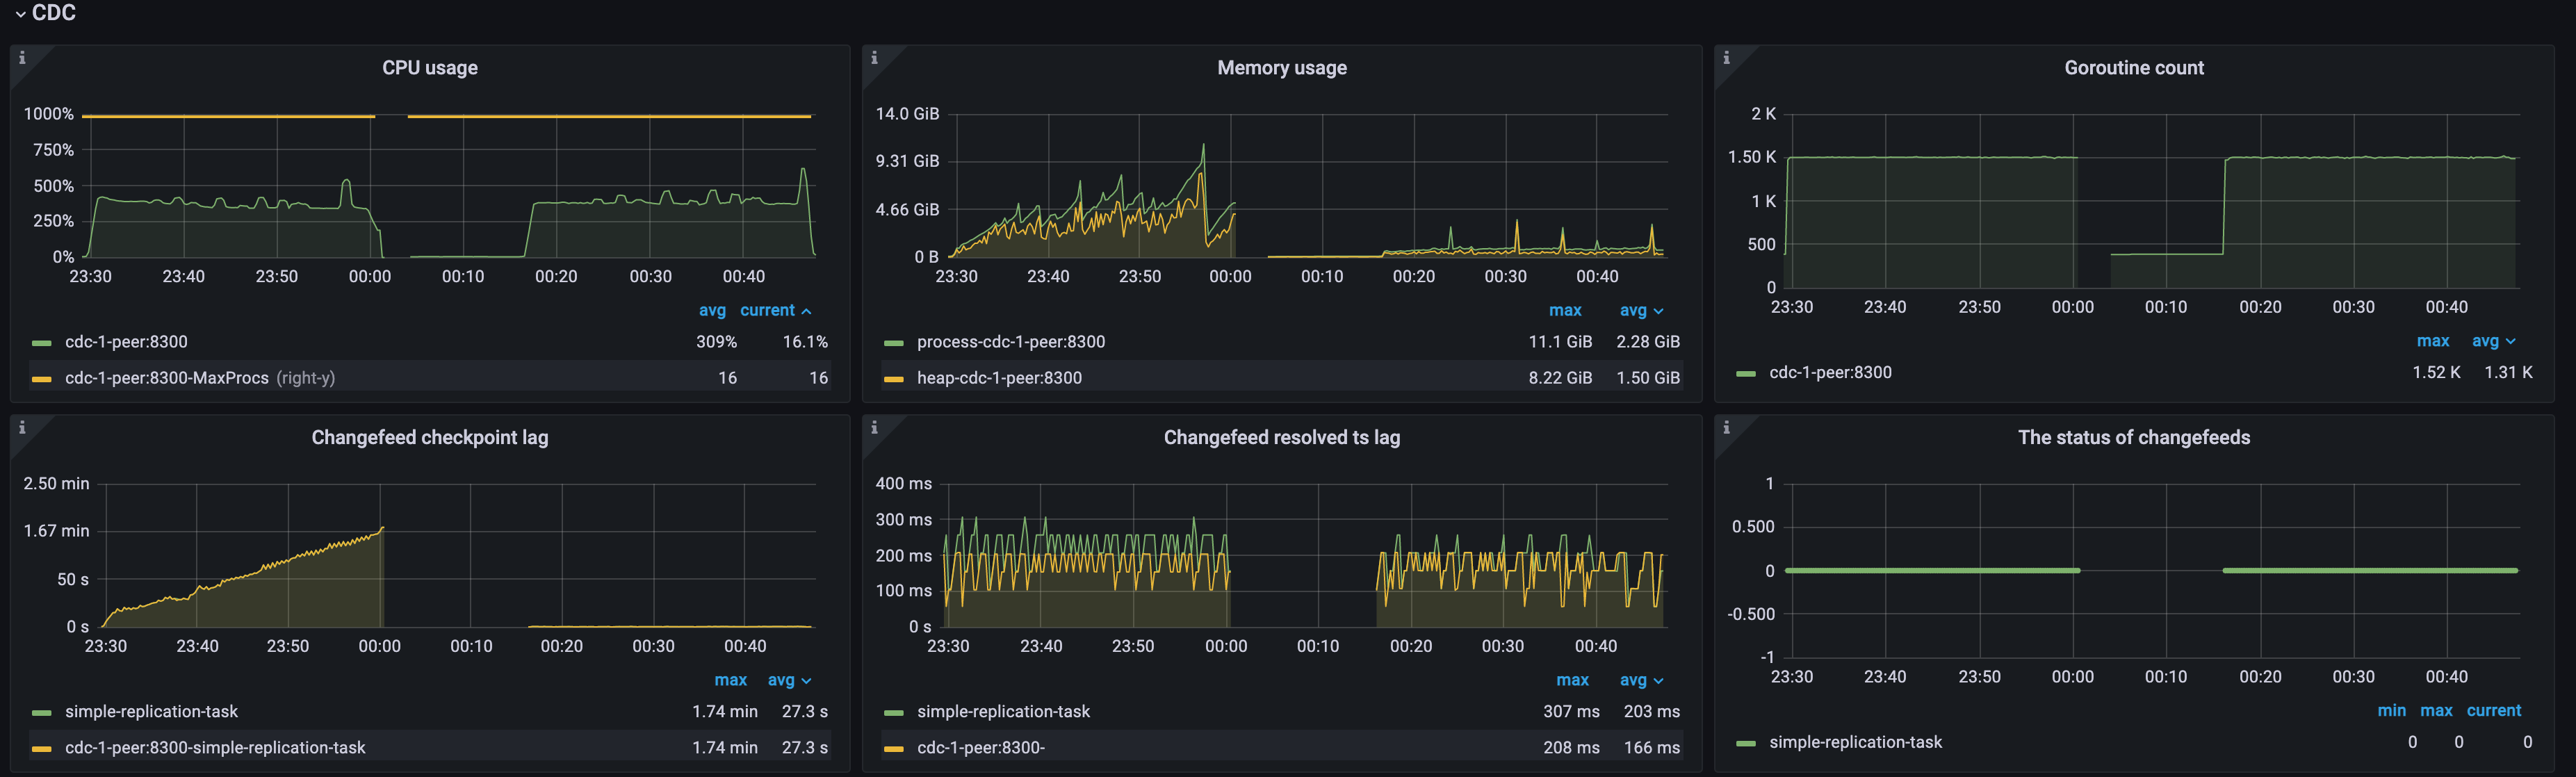
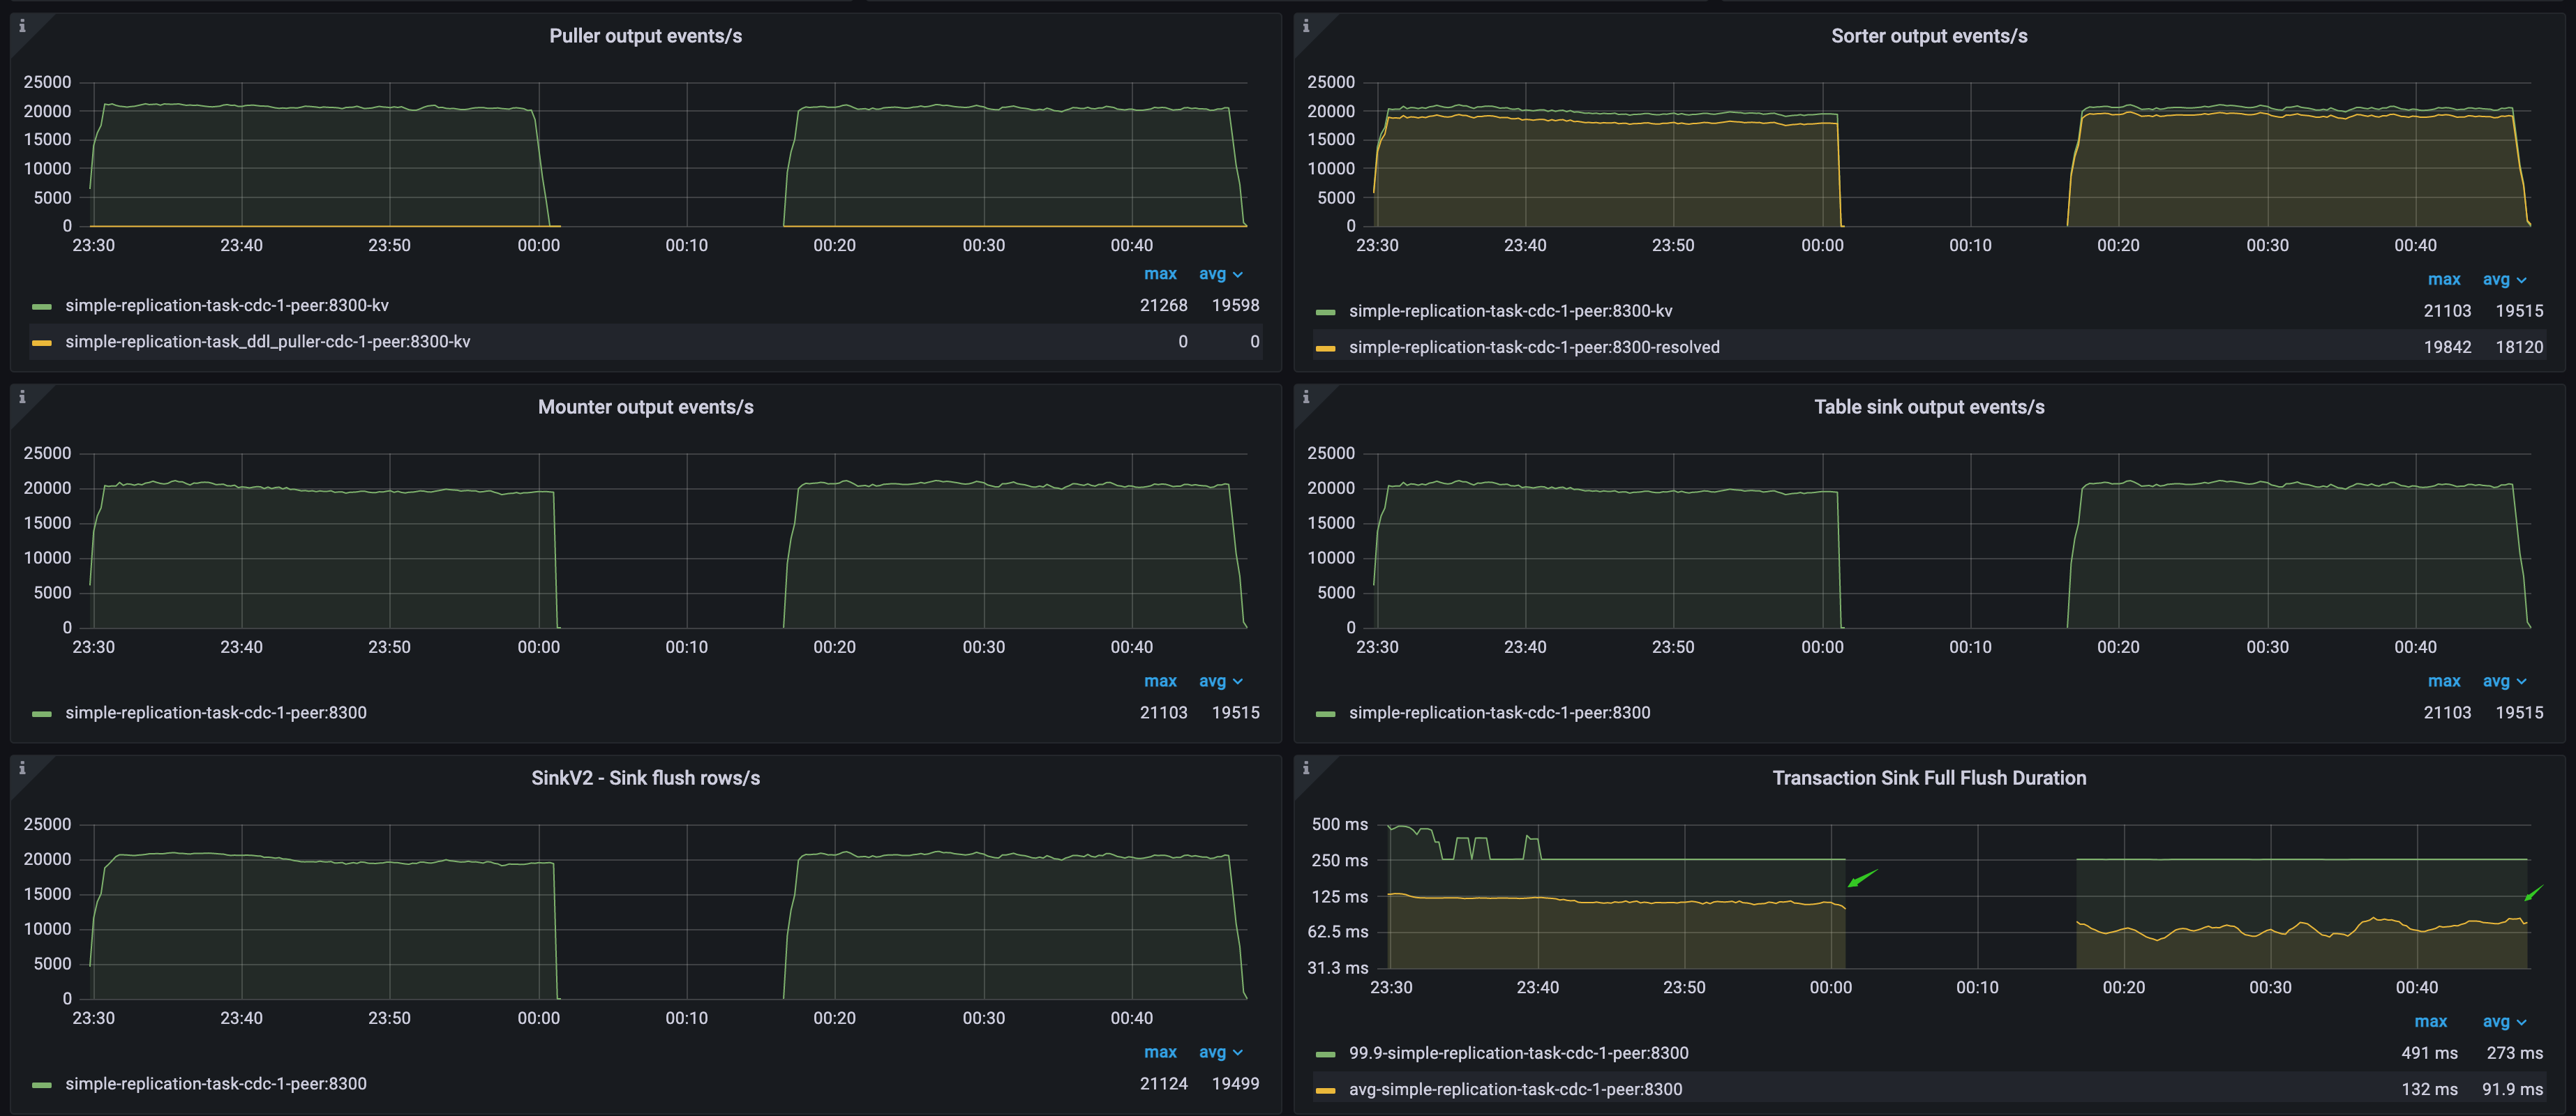
Example 2: Impact of downstream database write speed on TiCDC data replication performance
As shown in the following diagram, both upstream and downstream are TiDB clusters. The TiCDC Puller output events/s metric indicates the QPS of the upstream database. The Transaction Sink Full Flush Duration metric indicates the average write latency of the downstream database, which is high during the first workload and low during the second workload.
- During the first workload, because the downstream TiDB cluster writes data slowly, TiCDC consumes data at a speed that falls behind the upstream QPS, leading to a continuous increase in
Changefeed checkpoint lag. However,Changefeed resolved ts lagremains within 300 milliseconds, indicating that replication lag and throughput bottlenecks are not caused by the puller and sorter modules but caused by the downstream sink module. - During the second workload, because the downstream TiDB cluster writes data faster, TiCDC replicates data at a speed that completely catches up with the upstream, the
Changefeed checkpoint lagandChangefeed resolved ts lagremain within 500 milliseconds, which is a relatively ideal replication speed for TiCDC.