TiDB Dashboard FAQ
This document summarizes the frequently asked questions (FAQs) and answers about TiDB Dashboard. If a problem cannot be located or persists after you perform as instructed, contact PingCAP technical support for help.
Access-related FAQ
When the firewall or reverse proxy is configured, I am redirected to an internal address other than TiDB Dashboard
When multiple Placement Driver (PD) instances are deployed in a cluster, only one of the PD instances actually runs the TiDB Dashboard service. If you access other PD instances instead of this one, your browser redirects you to another address. If the firewall or reverse proxy is not properly configured for accessing TiDB Dashboard, when you visit the Dashboard, you might be redirected to an internal address that is protected by the firewall or reverse proxy.
- See TiDB Dashboard Multi-PD Instance Deployment to learn the working principle of TiDB Dashboard with multiple PD instances.
- See Use TiDB Dashboard through a Reverse Proxy to learn how to correctly configure a reverse proxy.
- See Secure TiDB Dashboard to learn how to correctly configure the firewall.
When TiDB Dashboard is deployed with dual network interface cards (NICs), TiDB Dashboard cannot be accessed using another NIC
For security reasons, TiDB Dashboard on PD only monitors the IP addresses specified during deployment (that is, it only listens on one NIC), not on 0.0.0.0. Therefore, when multiple NICs are installed on the host, you cannot access TiDB Dashboard using another NIC.
If you have deployed TiDB using the tiup cluster or tiup playground command, currently this problem cannot be solved. It is recommended that you use a reverse proxy to safely expose TiDB Dashboard to another NIC. For details, see Use TiDB Dashboard behind a Reverse Proxy.
UI-related FAQ
A prometheus_not_found error is shown in QPS and Latency sections on the Overview page
The QPS and Latency sections on the Overview page require a cluster with Prometheus deployed. Otherwise, the error is shown. You can solve this problem by deploying a Prometheus instance in the cluster.
If you still encounter this problem when the Prometheus instance has been deployed, the possible reason is that your deployment tool is out of date (TiUP or TiDB Operator), and your tool does not automatically report metrics addresses, which makes TiDB Dashboard unable to query metrics. You can upgrade you deployment tool to the latest version and try again.
If your deployment tool is TiUP, take the following steps to solve this problem. For other deployment tools, refer to the corresponding documents of those tools.
Upgrade TiUP and TiUP Cluster:
tiup update --self
tiup update cluster --force
After the upgrade, when a new cluster is deployed with Prometheus instances, the metrics can be displayed normally.
After the upgrade, for an existing cluster, you can restart this cluster to report the metrics addresses. Replace
CLUSTER_NAMEwith the actual cluster name:tiup cluster start CLUSTER_NAMEEven if the cluster has been started, still execute this command. This command does not affect the normal application in the cluster, but refreshes and reports the metrics addresses, so that the monitoring metrics can be displayed normally in TiDB Dashboard.
An invalid connection error is shown in Top SQL Statements and Recent Slow Queries on the Overview page
The possible reason is that you have enabled the prepared-plan-cache feature of TiDB. As an experimental feature, when enabled, prepared-plan-cache might not function properly in specific TiDB versions, which could cause this problem in TiDB Dashboard (and other applications). You can disable prepared-plan-cache by updating TiDB Configuration file to solve this problem.
An unknown field error is shown in Slow Queries page
If the unknown field error appears on the Slow Queries page after the cluster upgrade, the error is related to a compatibility issue caused by the difference between TiDB Dashboard server fields (which might be updated) and user preferences fields (which are in the browser cache). This issue has been fixed. If your cluster is earlier than v5.0.3 or v4.0.14, perform the following steps to resolve the issue:
To clear your browser cache, take the following steps:
Open TiDB Dashboard page.
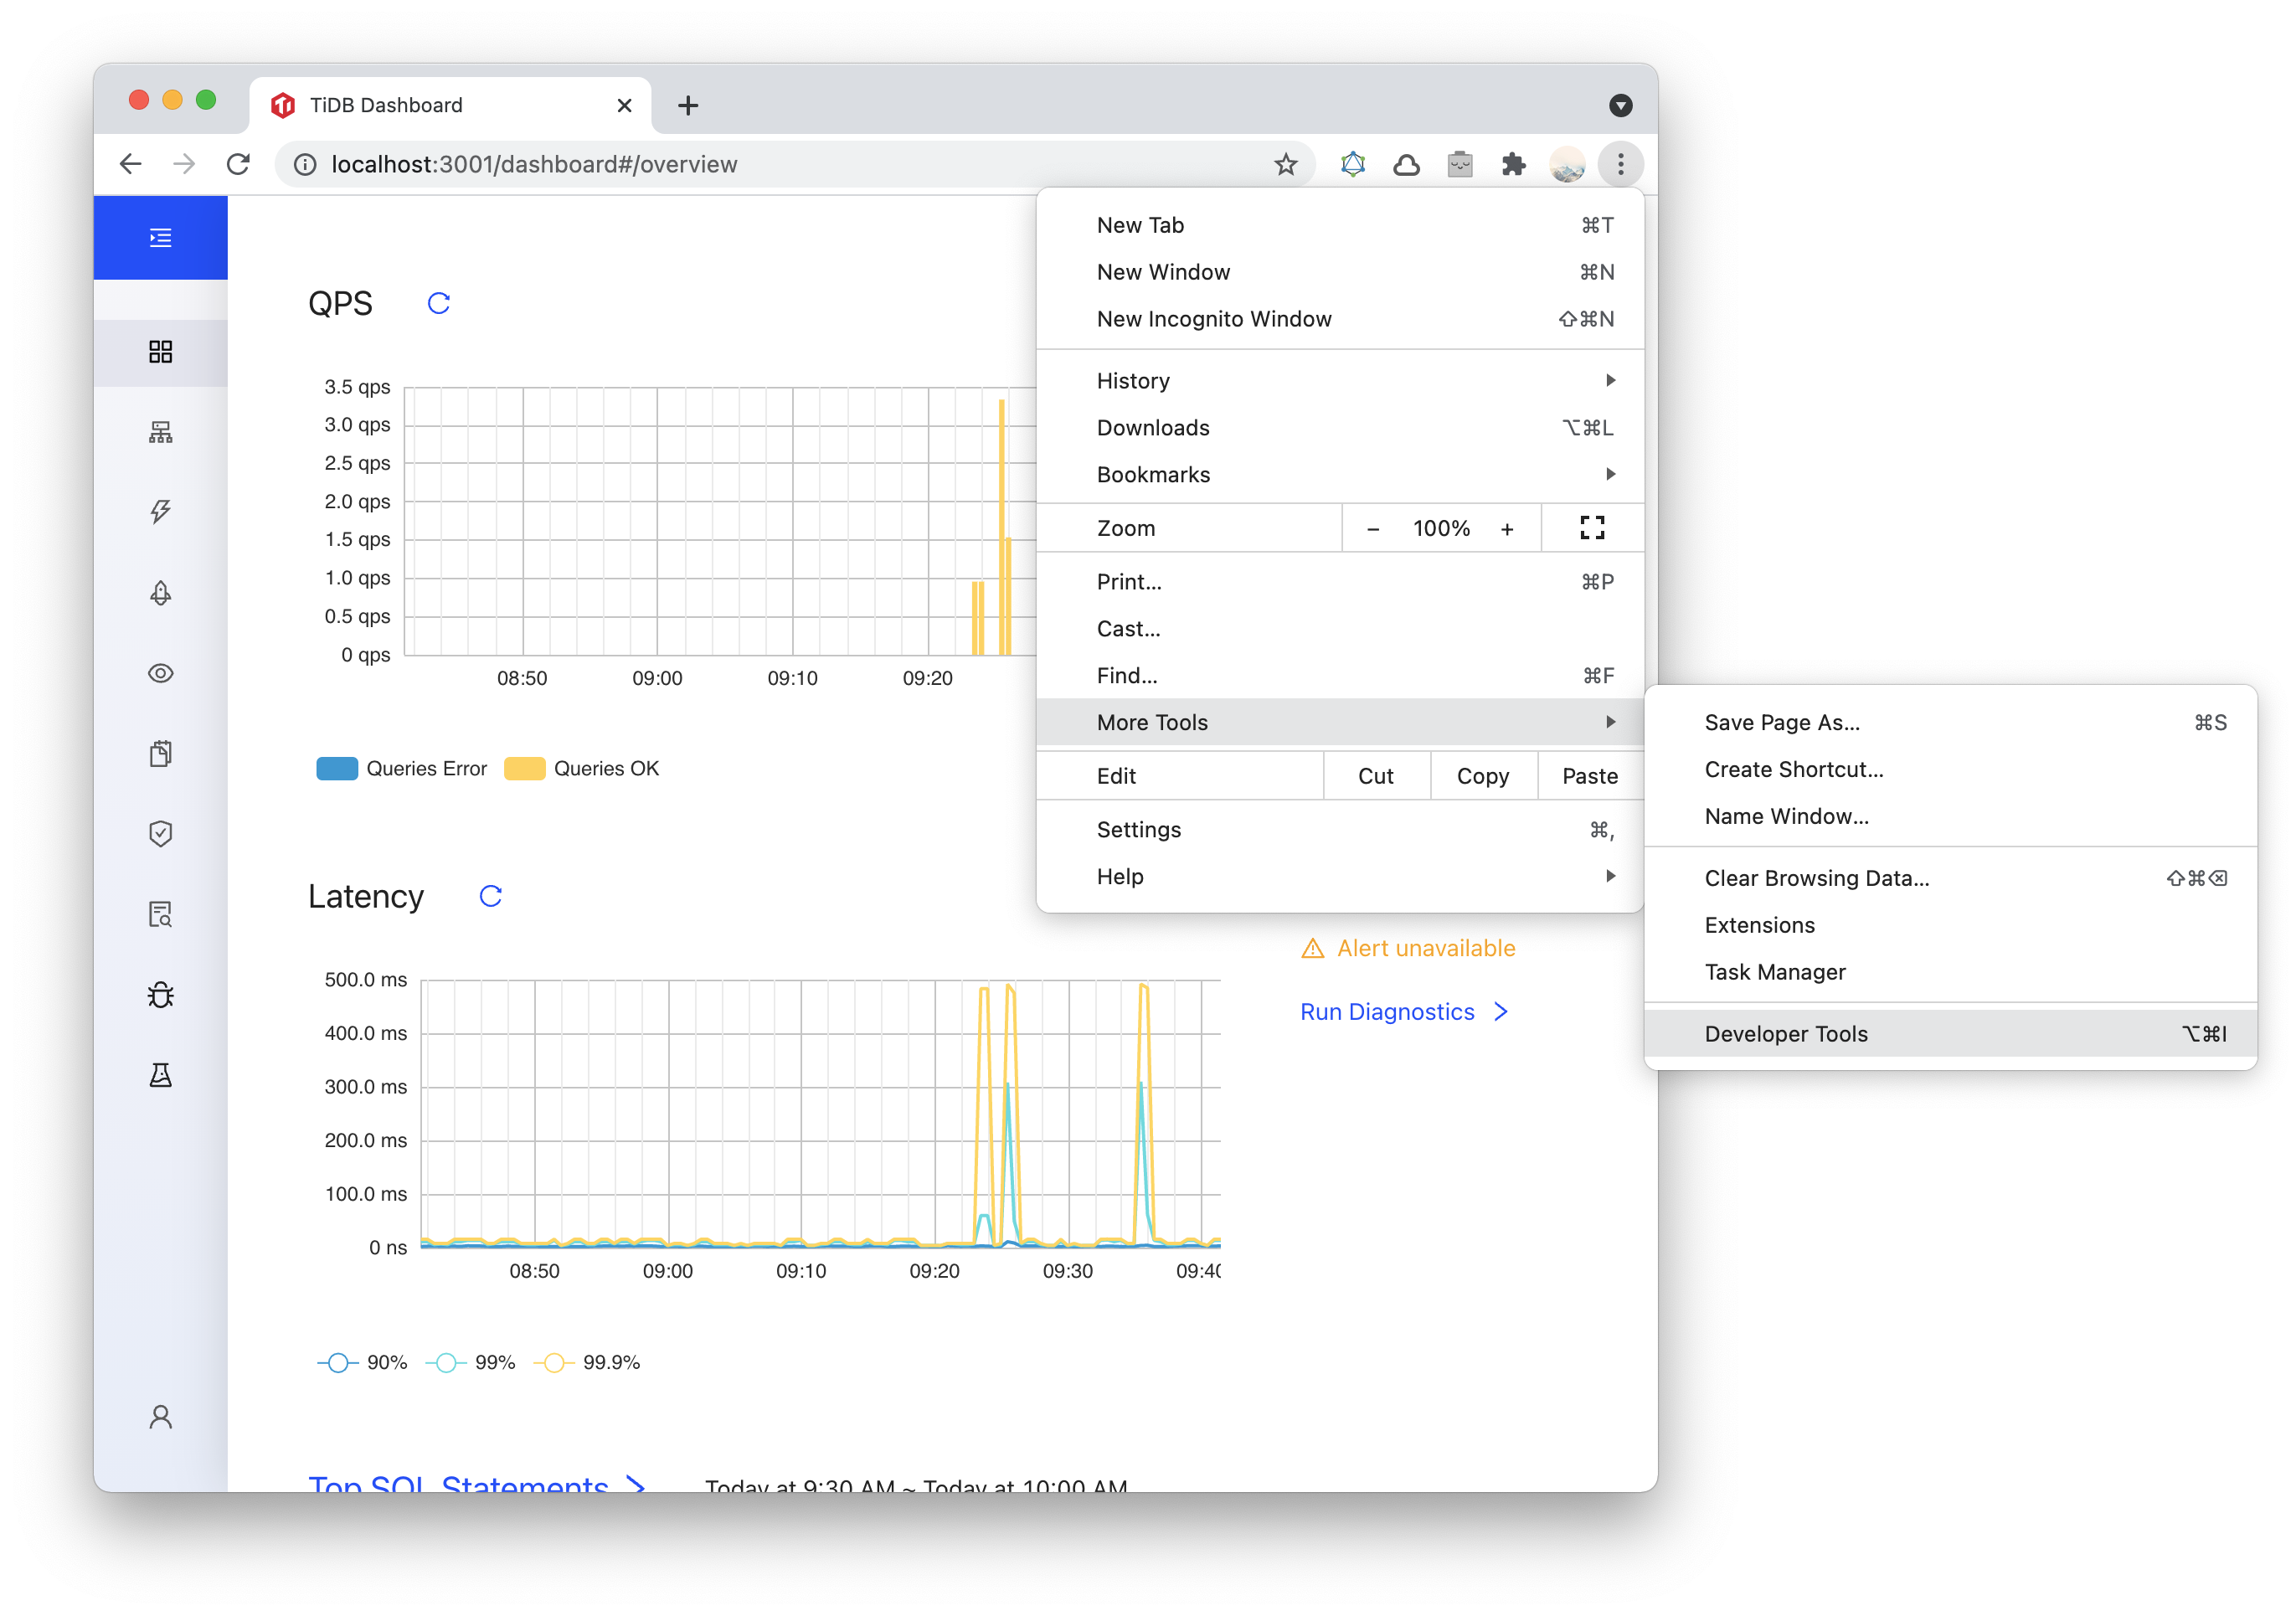
Open Developer Tools. Different browsers have different ways of opening Developer Tools. After clicking the Menu Bar:
- Firefox: Menu > Web Developer > Toggle Tools, or Tools > Web Developer > Toggle Tools.
- Chrome: More tools > Developer tools.
- Safari: Develop > Show Web Inspector. If you can't see the Develop menu, go to Safari > Preferences > Advanced, and check the Show Develop menu in menu bar checkbox.
In the following example, Chrome is used.
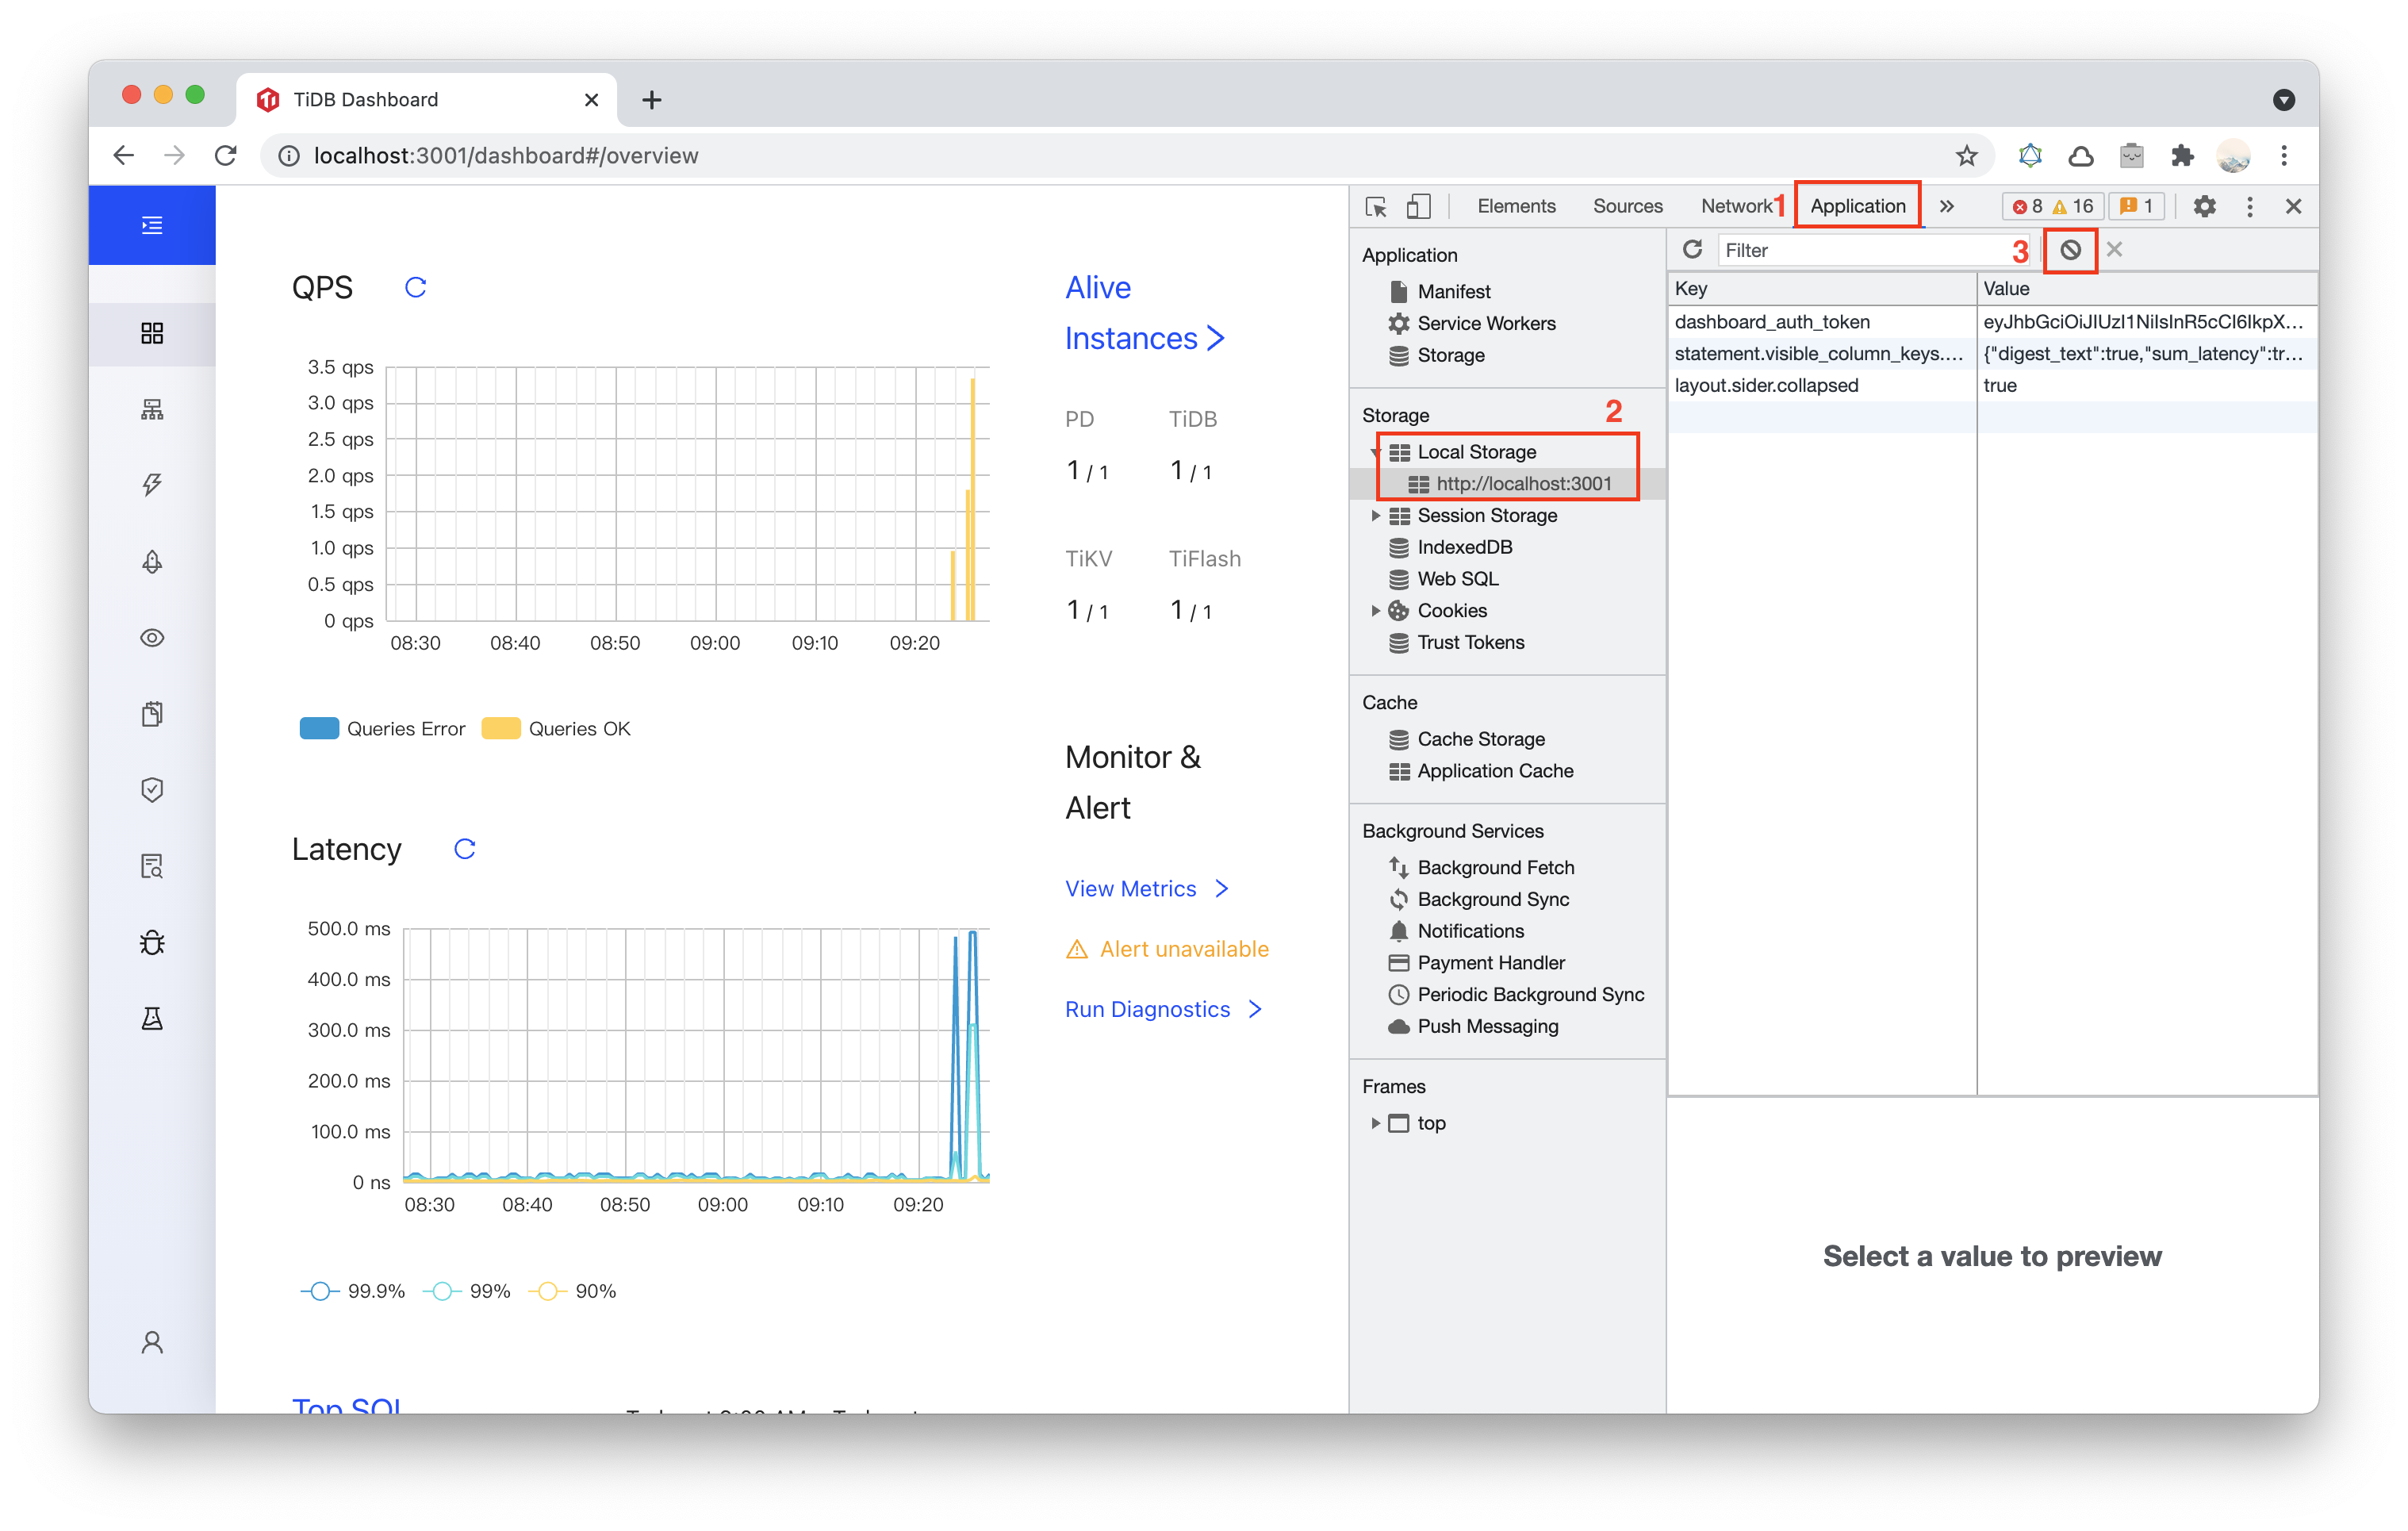
Select the Application panel, expand the Local Storage menu and select the TiDB Dashboard page domain. Click the Clear All button.
A required component NgMonitoring is not started error is shown
NgMonitoring is an advanced monitoring component built in TiDB clusters of v5.4.0 and later versions. It supports such features as Continuous Profiling and Top SQL. In a TiDB cluster deployed using TiUP, NgMonitoring is deployed automatically. In a TiDB cluster deployed using TiDB Operator, you need to deploy NgMonitoring manually by referring to Enable Continuous Profiling.
If the Continuous Profiling page shows required component NgMonitoring is not started, address the problem based on the deployment method of the TiDB cluster.
Clusters deployed using TiUP
Step 1. Check versions
Check the TiUP cluster version. NgMonitoring is available only when TiUP is v1.9.0 or later.
tiup cluster --versionThe command output shows the TiUP version. For example:
tiup version 1.9.0 tiup
Go Version: go1.17.2
Git Ref: v1.9.0
If the TiUP cluster version is earlier than v1.9.0, upgrade TiUP and TiUP cluster to the latest version:
tiup update --all
Step 2. Add the ng_port configuration item on the control machine by using TiUP. Then reload Prometheus.
Open the cluster configuration file in editing mode:
tiup cluster edit-config ${cluster-name}Under
monitoring_servers, add theng_port:${port}parameter:monitoring_servers: - host: 172.16.6.6 ng_port: ${port}Reload Prometheus:
tiup cluster reload ${cluster-name} --role prometheus
After performing the preceding steps, enable Continuous Profiling on TiDB Dashboard. If NgMonitoring still fails to be started, contact PingCAP technical support for help.
Clusters deployed using TiDB Operator
Deploy NgMonitoring by referring to Enable Continuous Profiling.