Key Monitoring Metrics of PD
If you use TiUP to deploy the TiDB cluster, the monitoring system (Prometheus & Grafana) is deployed at the same time. For more information, see Overview of the Monitoring Framework.
The Grafana dashboard is divided into a series of sub dashboards which include Overview, PD, TiDB, TiKV, Node_exporter, Disk Performance, and so on. A lot of metrics are there to help you diagnose.
You can get an overview of the component PD status from the PD dashboard, where the key metrics are displayed. This document provides a detailed description of these key metrics.
The following is the description of PD Dashboard metrics items:
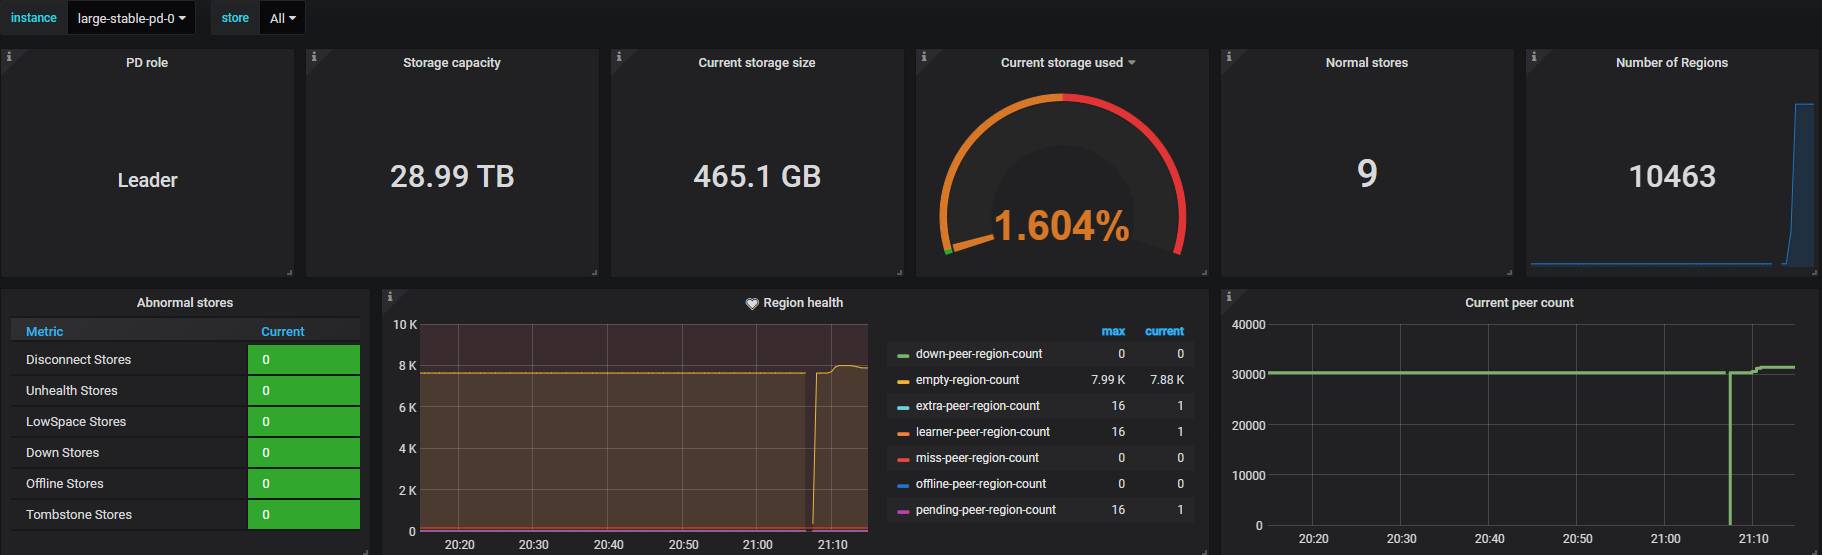
- PD role: The role of the current PD instance
- Storage capacity: The total storage capacity for this TiDB cluster
- Current storage size: The storage size that is currently used by the TiDB cluster
- Current storage usage: The current storage usage rate
- Normal stores: The count of healthy storage instances
- Number of Regions: The total count of cluster Regions
- Abnormal stores: The count of unhealthy stores. The normal value is
0. If the number is bigger than0, it means at least one instance is abnormal. - Region health: The health status of Regions indicated via the count of unusual Regions including pending peers, down peers, extra peers, offline peers, missing peers, learner peers and incorrect namespaces. Generally, the number of pending peers should be less than
100. The missing peers should not be persistently greater than0. If many empty Regions exist, enable Region Merge in time. - Current peer count: The current count of all cluster peers
Key metrics description
Cluster
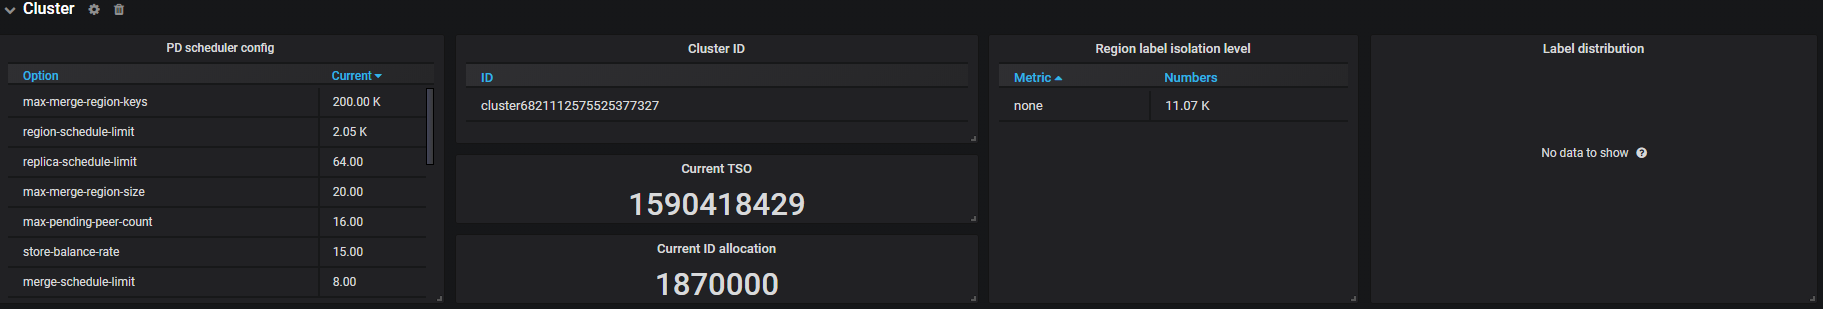
- PD scheduler config: The list of PD scheduler configurations
- Cluster ID: The unique identifier of the cluster
- Current TSO: The physical part of current allocated TSO
- Current ID allocation: The maximum allocatable ID for new store/peer
- Region label isolation level: The number of Regions in different label levels
- Label distribution: The distribution status of the labels in the cluster
Operator
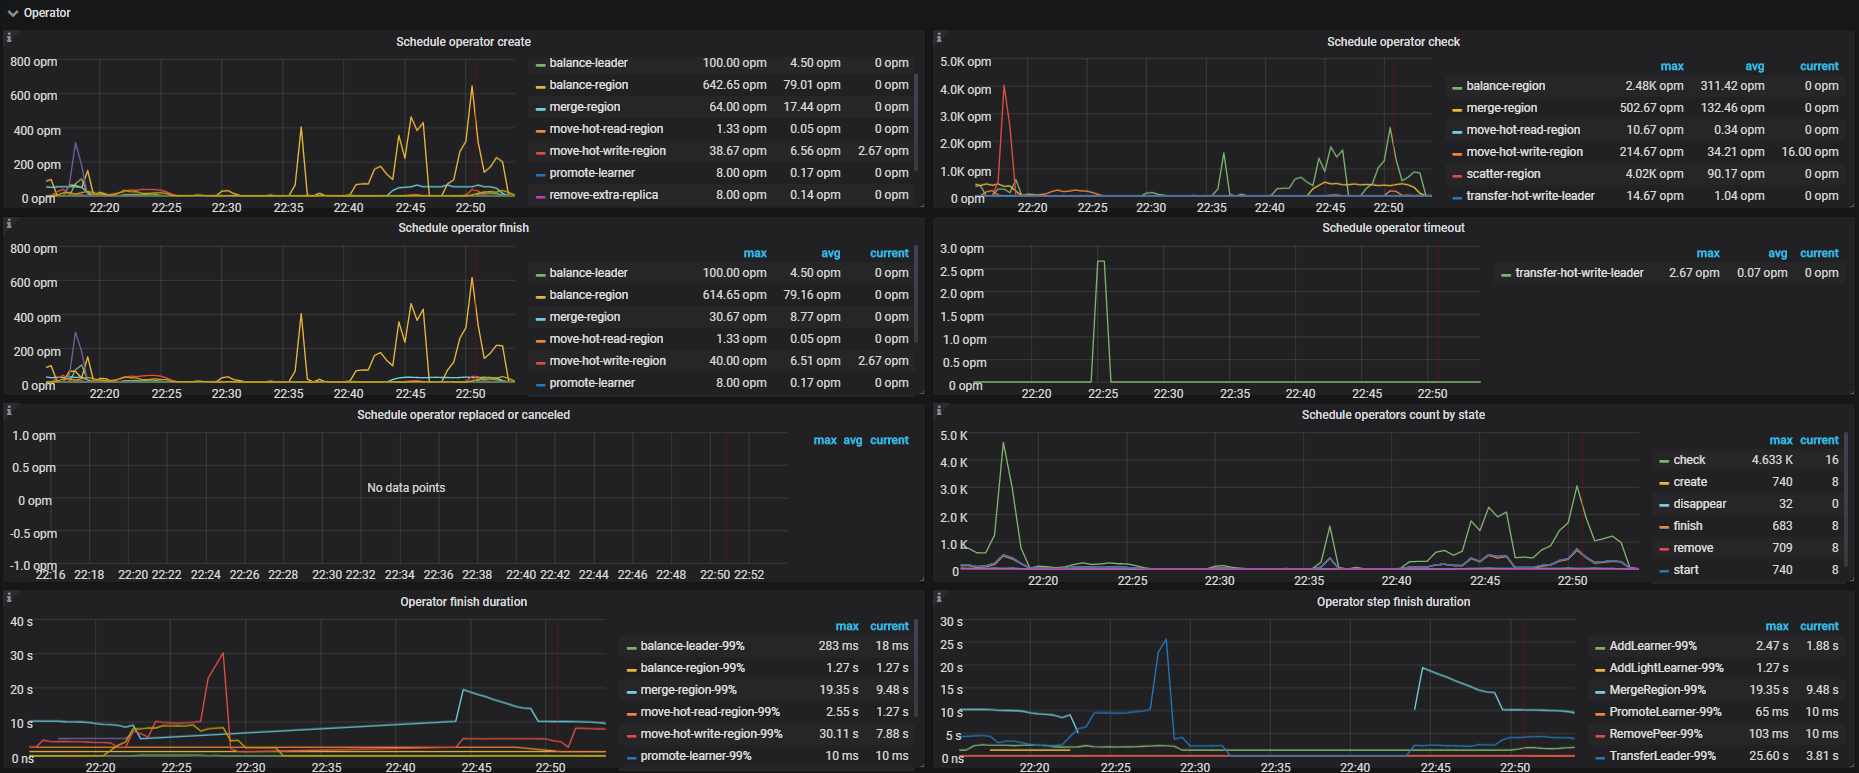
- Schedule operator create: The number of newly created operators per type
- Schedule operator check: The number of checked operator per type. It mainly checks whether the current step is finished; if yes, it returns the next step to be executed
- Schedule operator finish: The number of finished operators per type
- Schedule operator timeout: The number of timeout operators per type
- Schedule operator replaced or canceled: The number of replaced or canceled operators per type
- Schedule operators count by state: The number of operators per state
- Operator finish duration: The maximum duration of finished operators
- Operator step duration: The maximum duration of finished operator steps
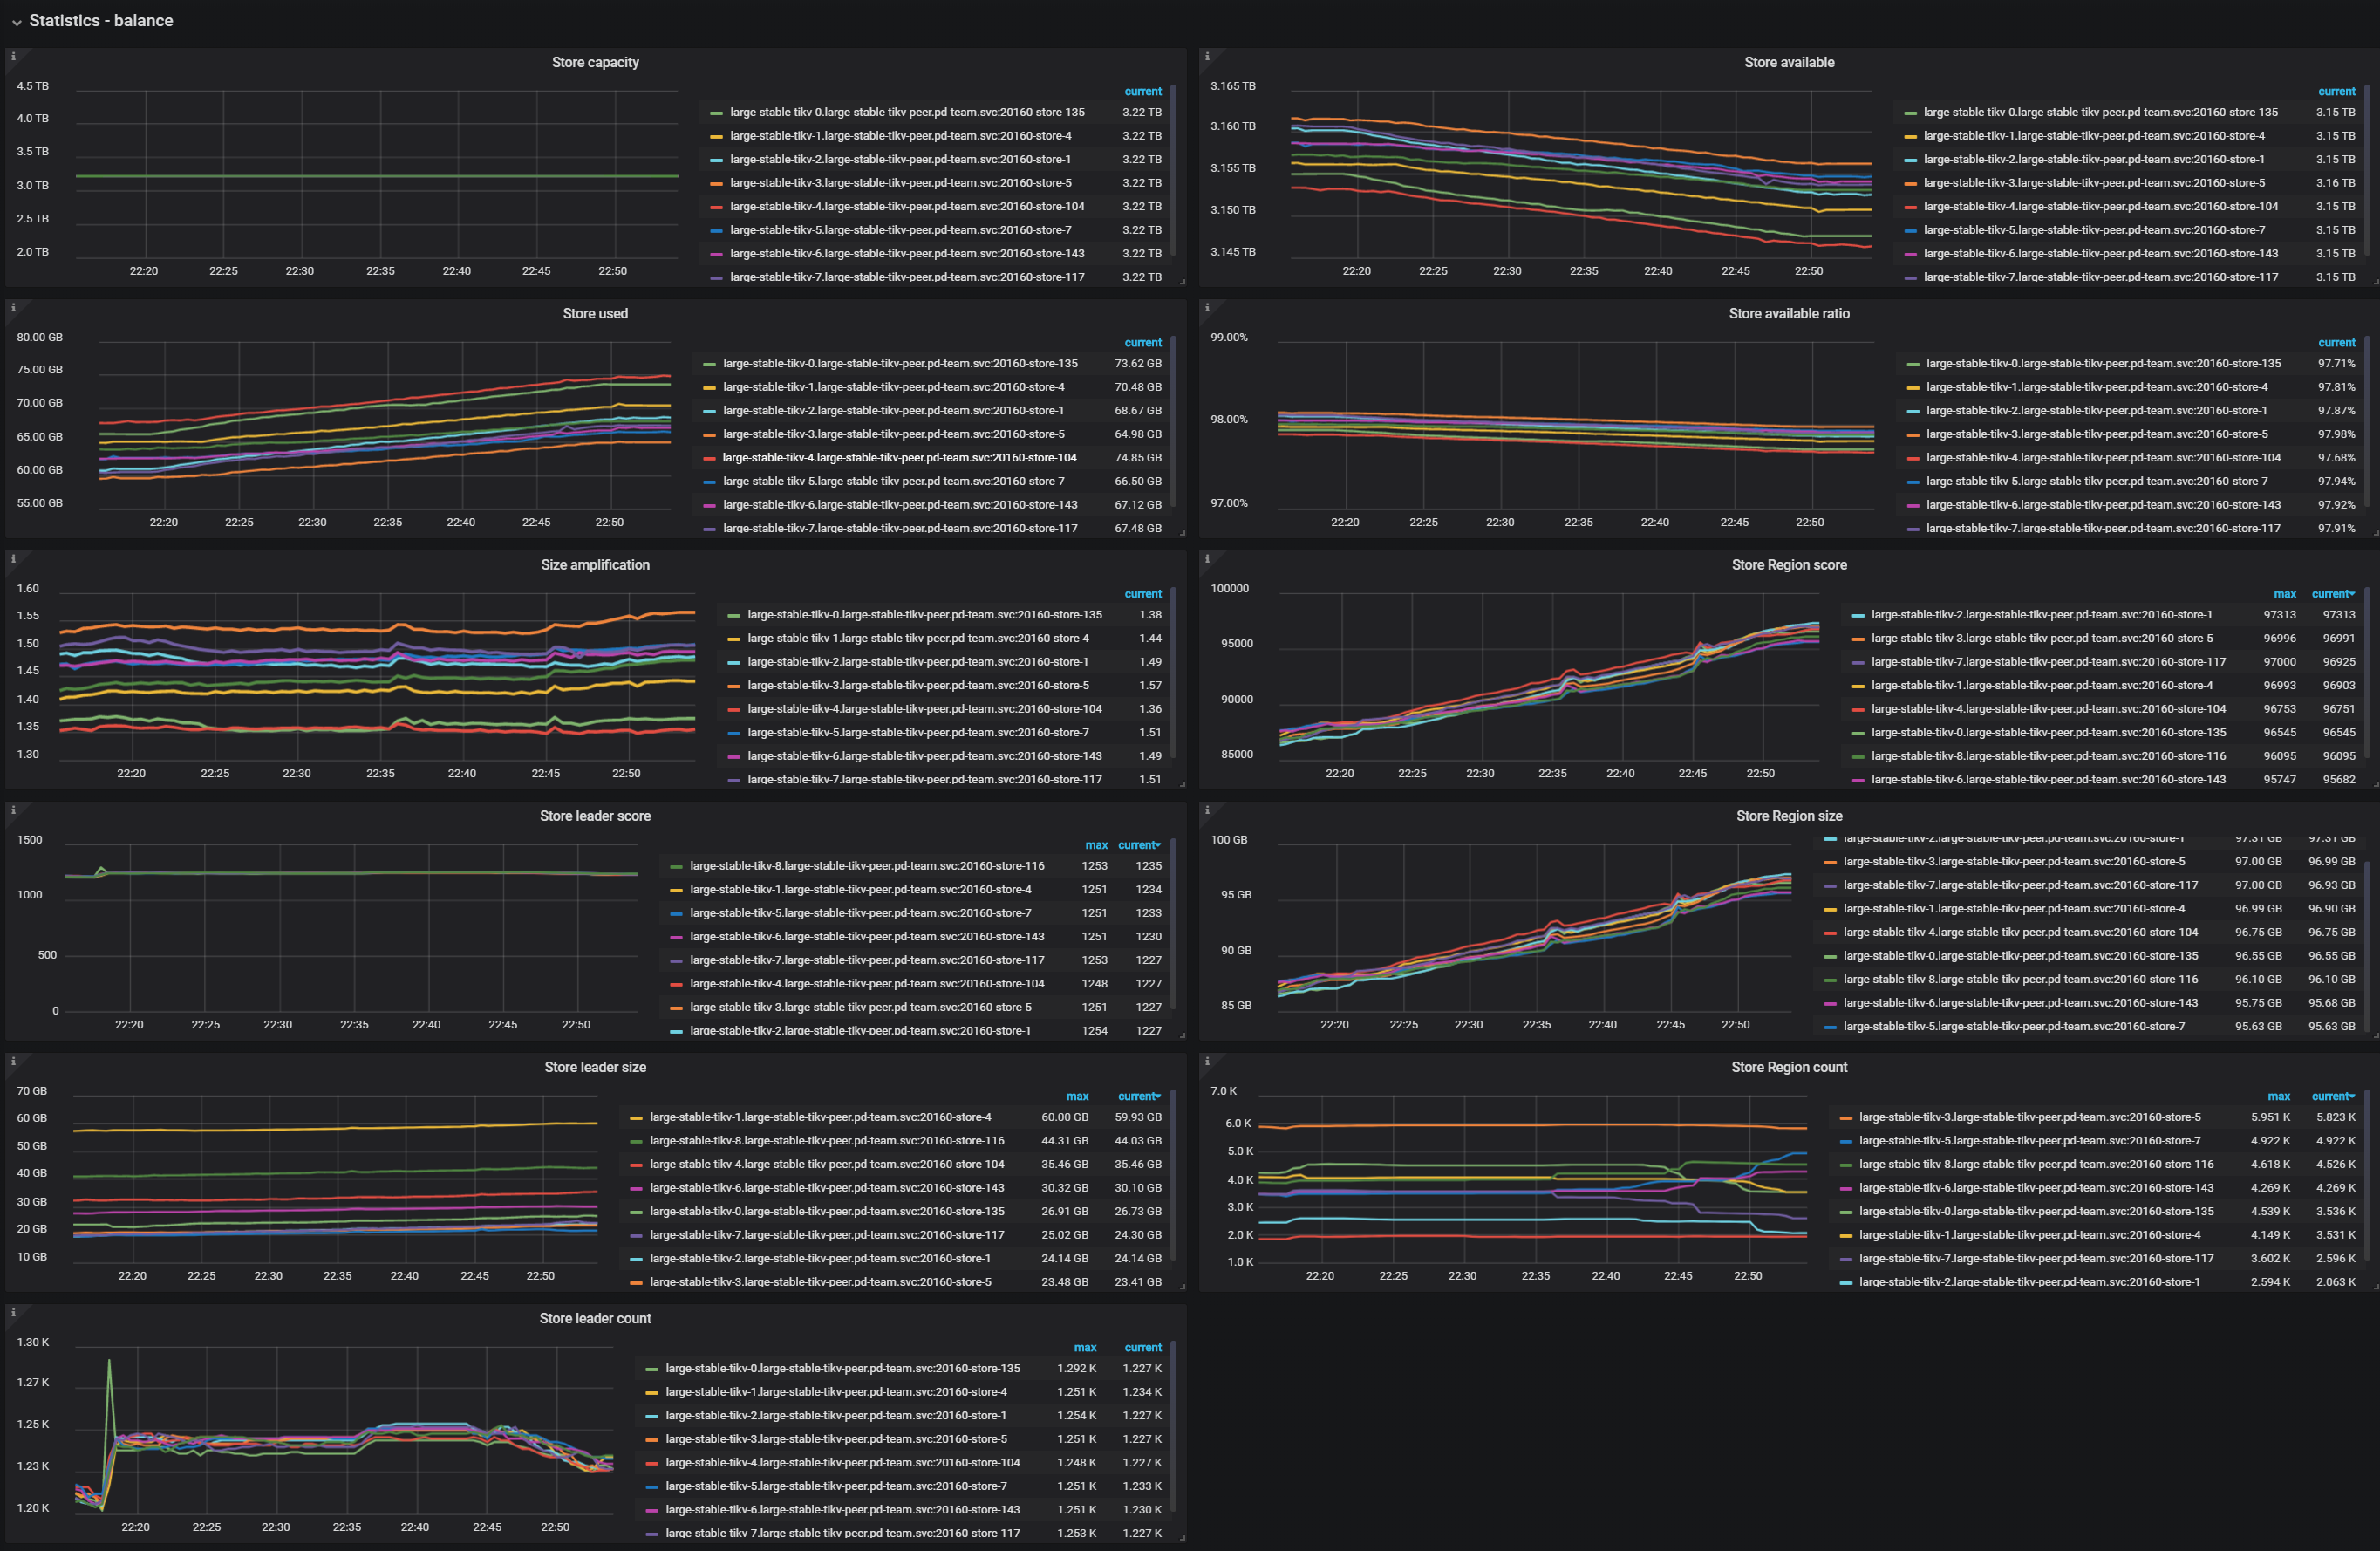
Statistics - Balance
- Store capacity: The capacity size per TiKV instance
- Store available: The available capacity size per TiKV instance
- Store used: The used capacity size per TiKV instance
- Size amplification: The size amplification ratio per TiKV instance, which is equal to (Store Region size)/(Store used capacity size)
- Size available ratio: The size availability ratio per TiKV instance, which is equal to (Store available capacity size)/(Store capacity size)
- Store leader score: The leader score per TiKV instance
- Store Region score: The Region score per TiKV instance
- Store leader size: The total leader size per TiKV instance
- Store Region size: The total Region size per TiKV instance
- Store leader count: The leader count per TiKV instance
- Store Region count: The Region count per TiKV instance
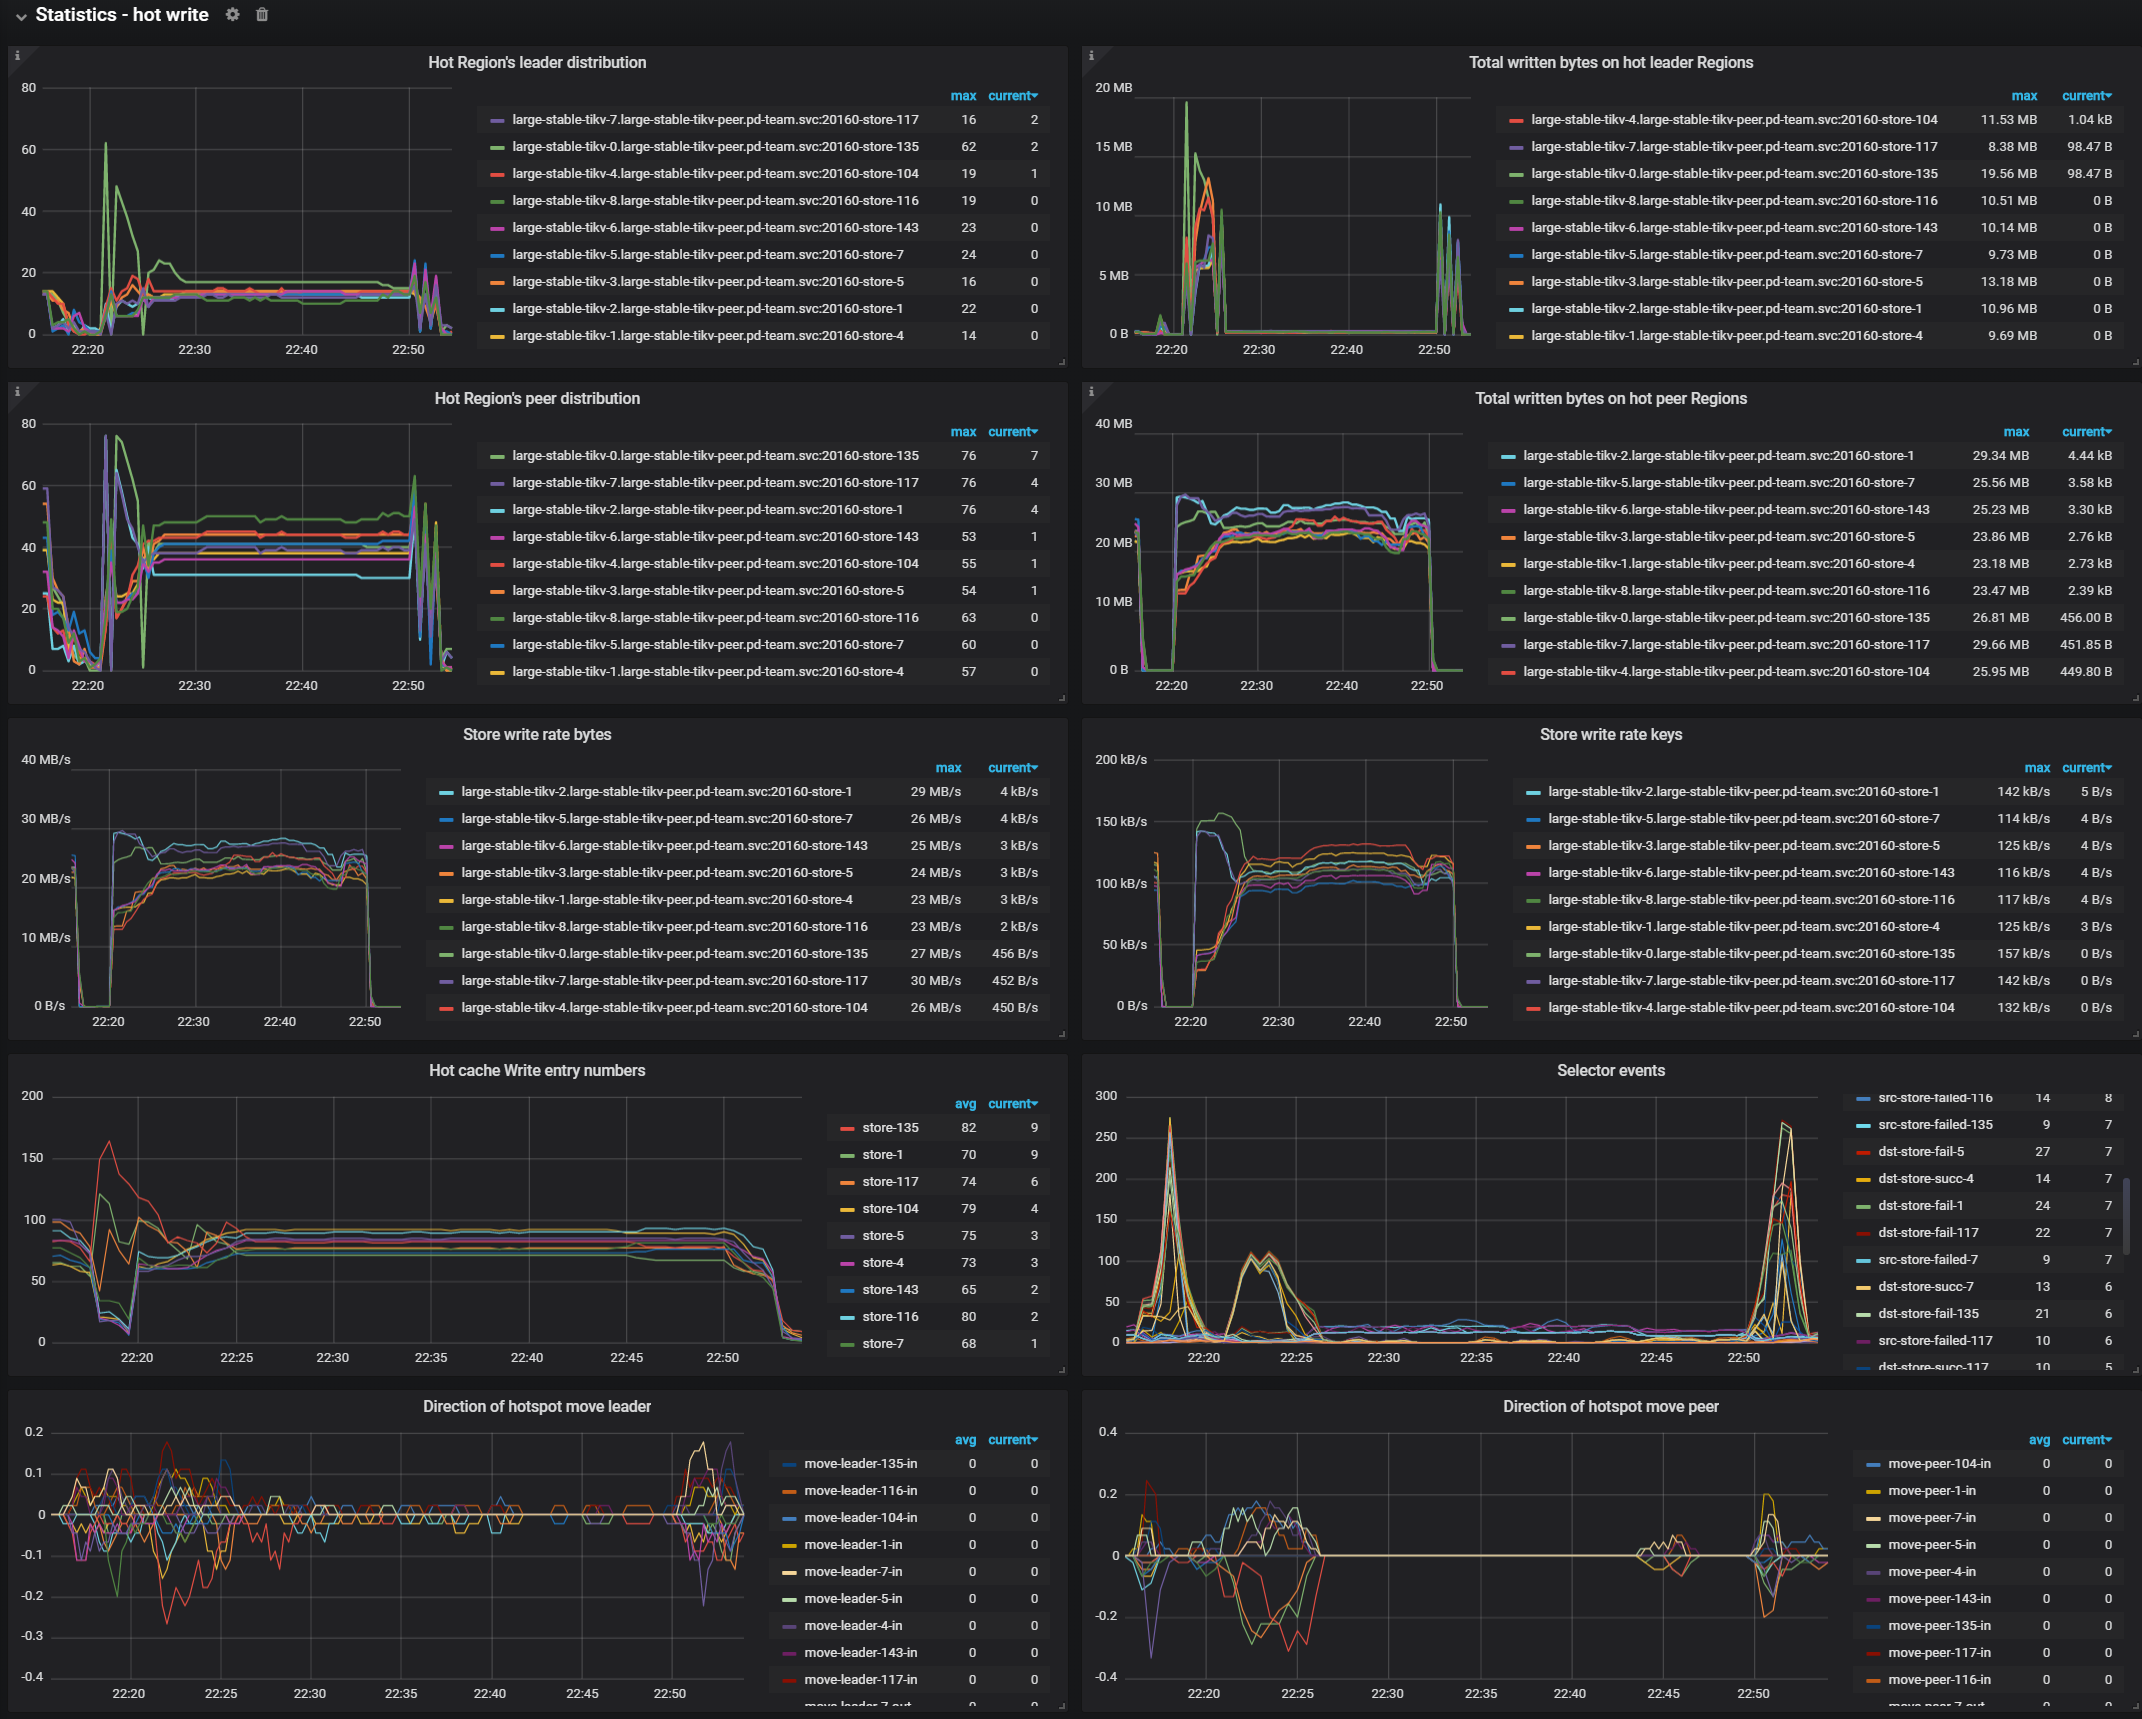
Statistics - hot write
- Hot Region's leader distribution: The total number of leader Regions that have become write hotspots on each TiKV instance
- Total written bytes on hot leader Regions: The total written bytes by leader Regions that have become write hotspots on each TiKV instance
- Hot write Region's peer distribution: The total number of peer Regions that have become write hotspots on each TiKV instance
- Total written bytes on hot peer Regions: The written bytes of all peer Regions that have become write hotspots on each TiKV instance
- Store Write rate bytes: The total written bytes on each TiKV instance
- Store Write rate keys: The total written keys on each TiKV instance
- Hot cache write entry number: The number of peers on each TiKV instance that are in the write hotspot statistics module
- Selector events: The event count of Selector in the hotspot scheduling module
- Direction of hotspot move leader: The direction of leader movement in the hotspot scheduling. The positive number means scheduling into the instance. The negtive number means scheduling out of the instance
- Direction of hotspot move peer: The direction of peer movement in the hotspot scheduling. The positive number means scheduling into the instance. The negative number means scheduling out of the instance
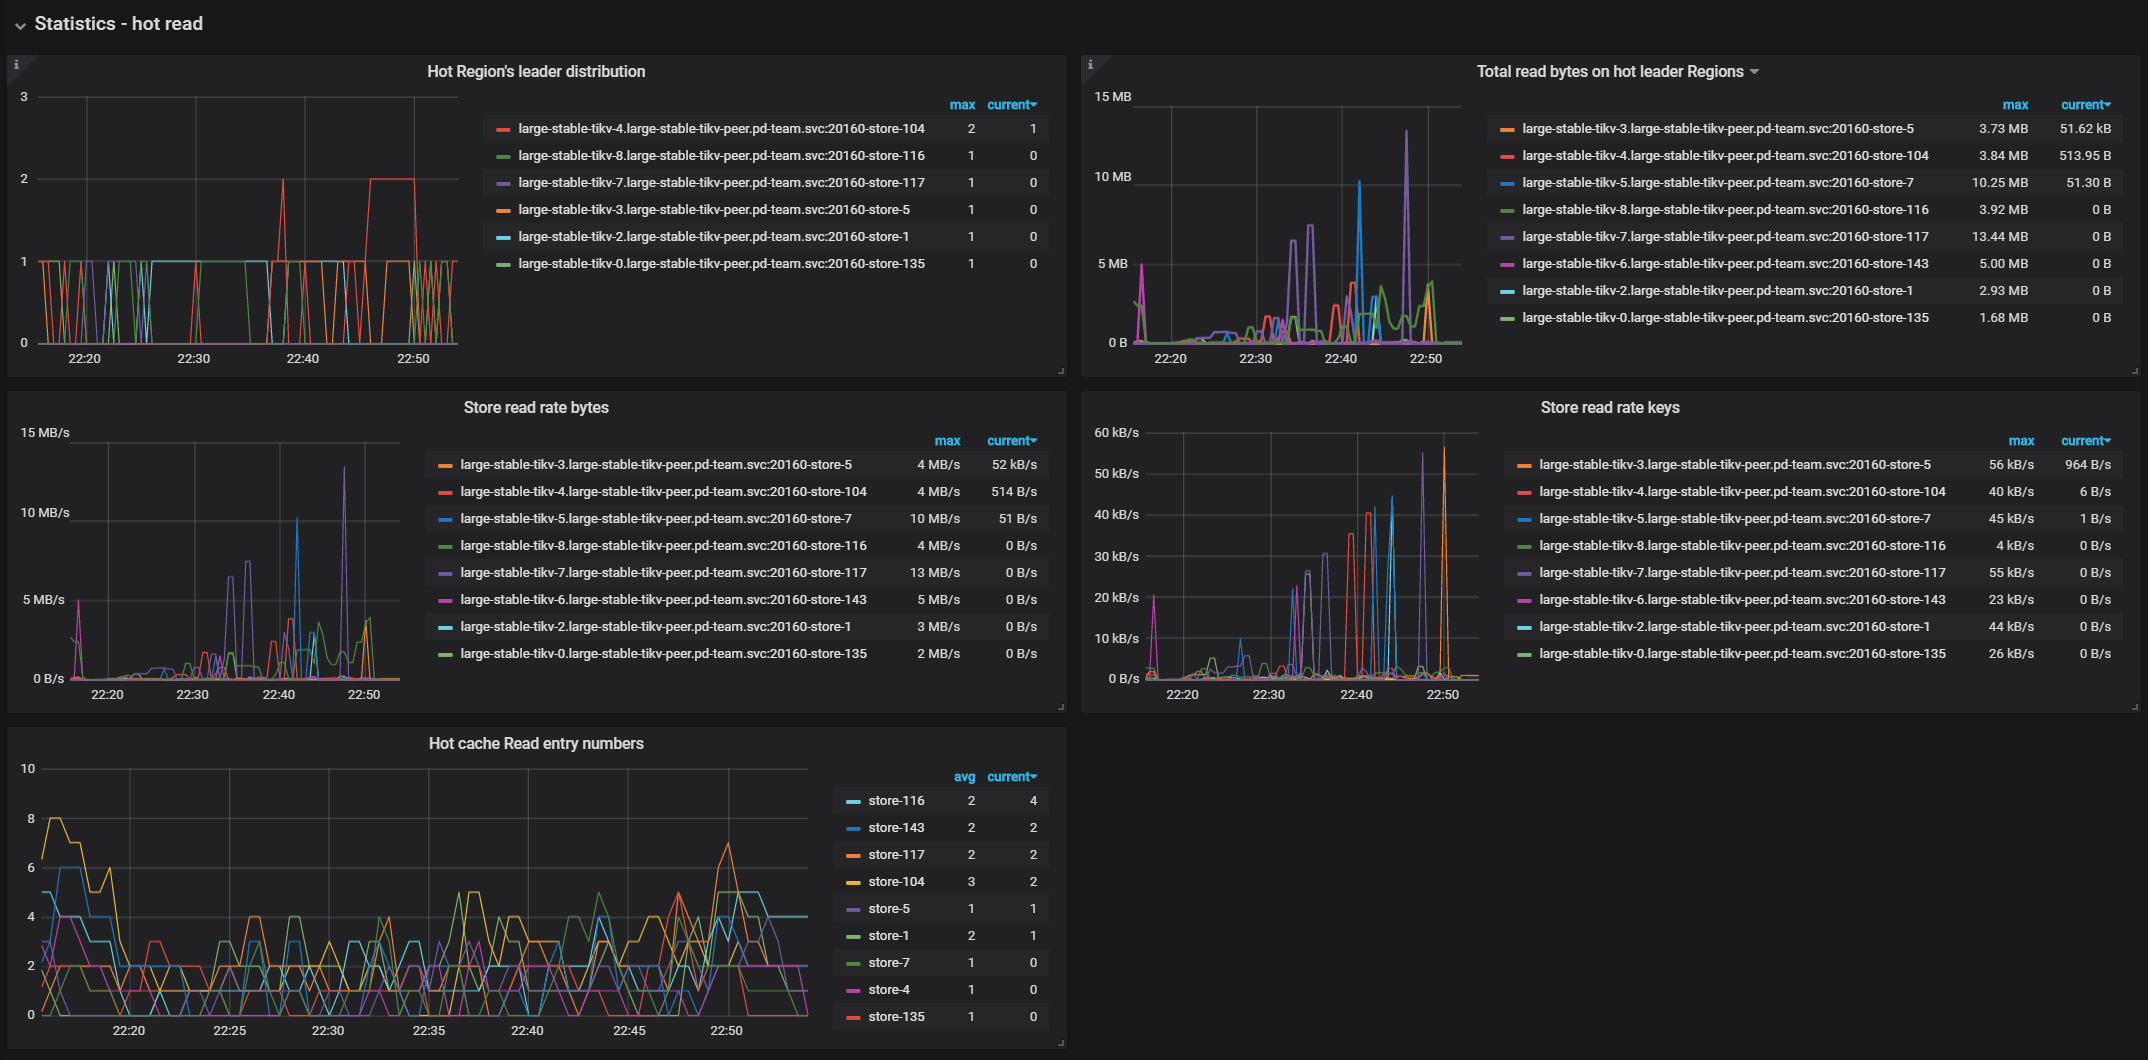
Statistics - hot read
- Hot Region's peer distribution: The total number of peer Regions that have become read hotspots on each TiKV instance
- Total read bytes on hot peer Regions: The total read bytes of peers that have become read hotspots on each TiKV instance
- Store read rate bytes: The total read bytes of each TiKV instance
- Store read rate keys: The total read keys of each TiKV instance
- Hot cache read entry number: The number of peers that are in the read hotspot statistics module on each TiKV instance
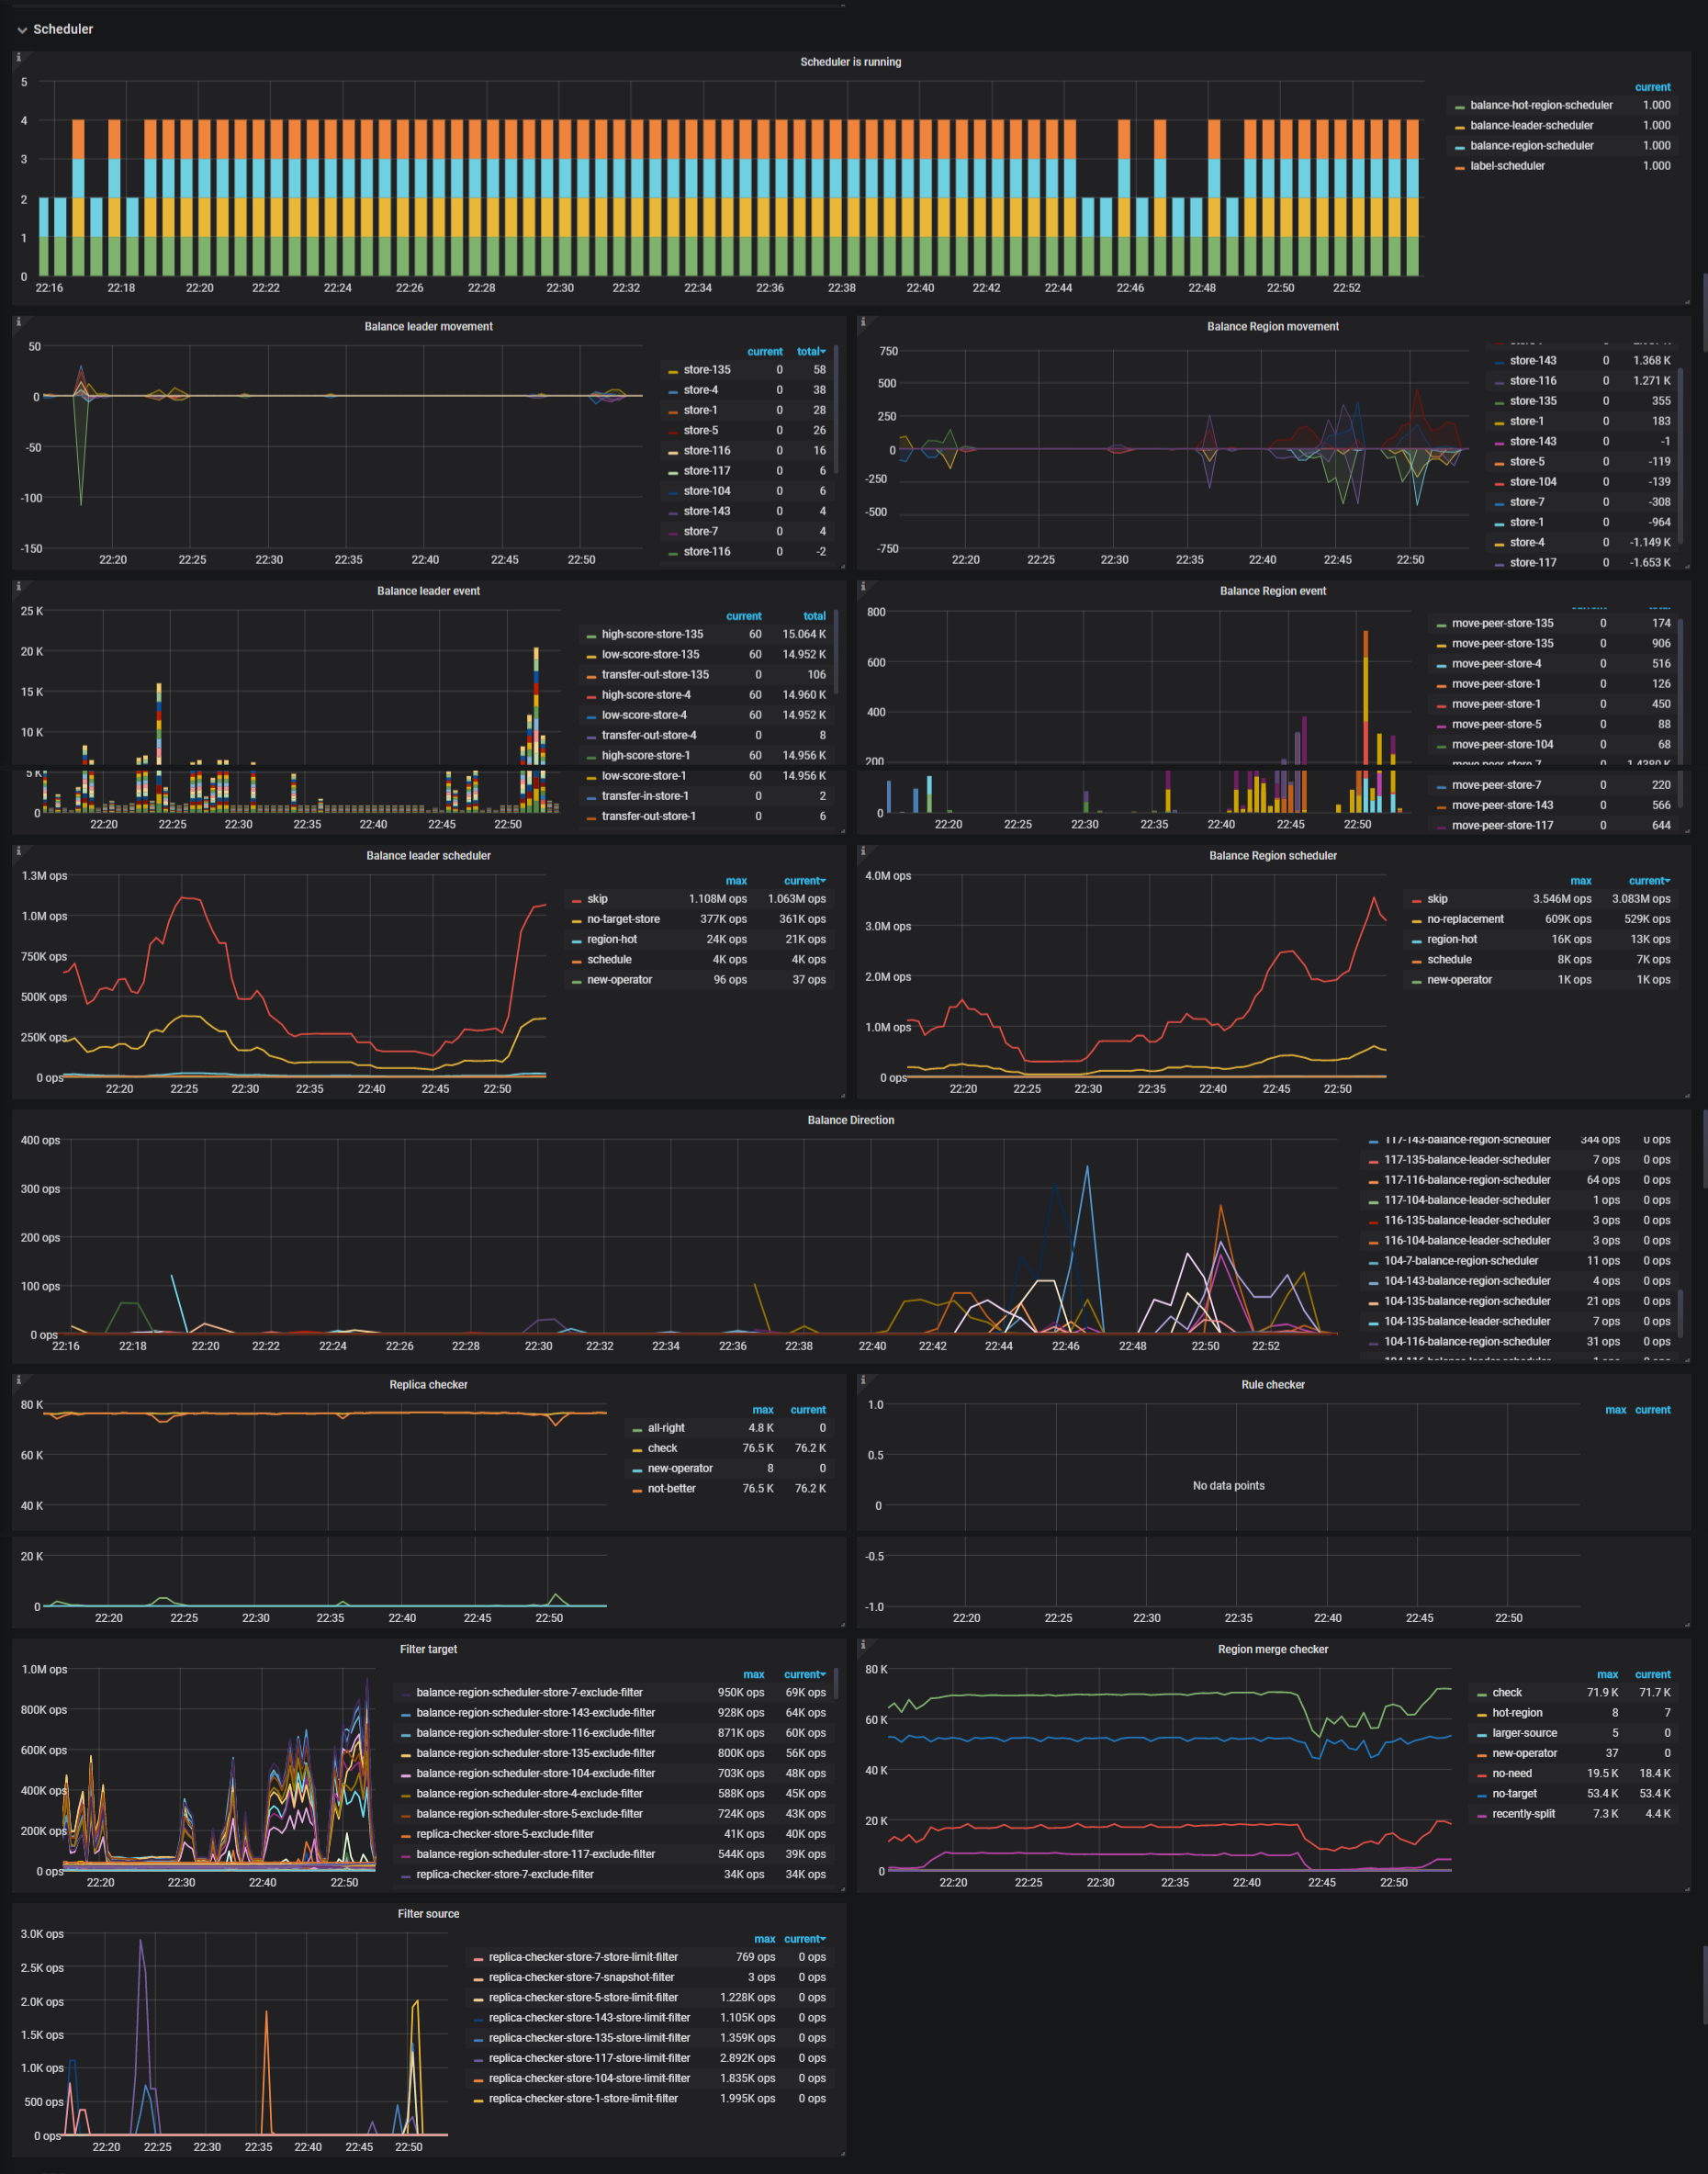
Scheduler
- Scheduler is running: The current running schedulers
- Balance leader movement: The leader movement details among TiKV instances
- Balance Region movement: The Region movement details among TiKV instances
- Balance leader event: The count of balance leader events
- Balance Region event: The count of balance Region events
- Balance leader scheduler: The inner status of balance leader scheduler
- Balance Region scheduler: The inner status of balance Region scheduler
- Replica checker: The replica checker's status
- Rule checker: The rule checker's status
- Region merge checker: The merge checker's status
- Filter target: The number of attempts that the store is selected as the scheduling target but failed to pass the filter
- Filter source: The number of attempts that the store is selected as the scheduling source but failed to pass the filter
- Balance Direction: The number of times that the Store is selected as the target or source of scheduling
- Store Limit: The flow control limitation of scheduling on the Store
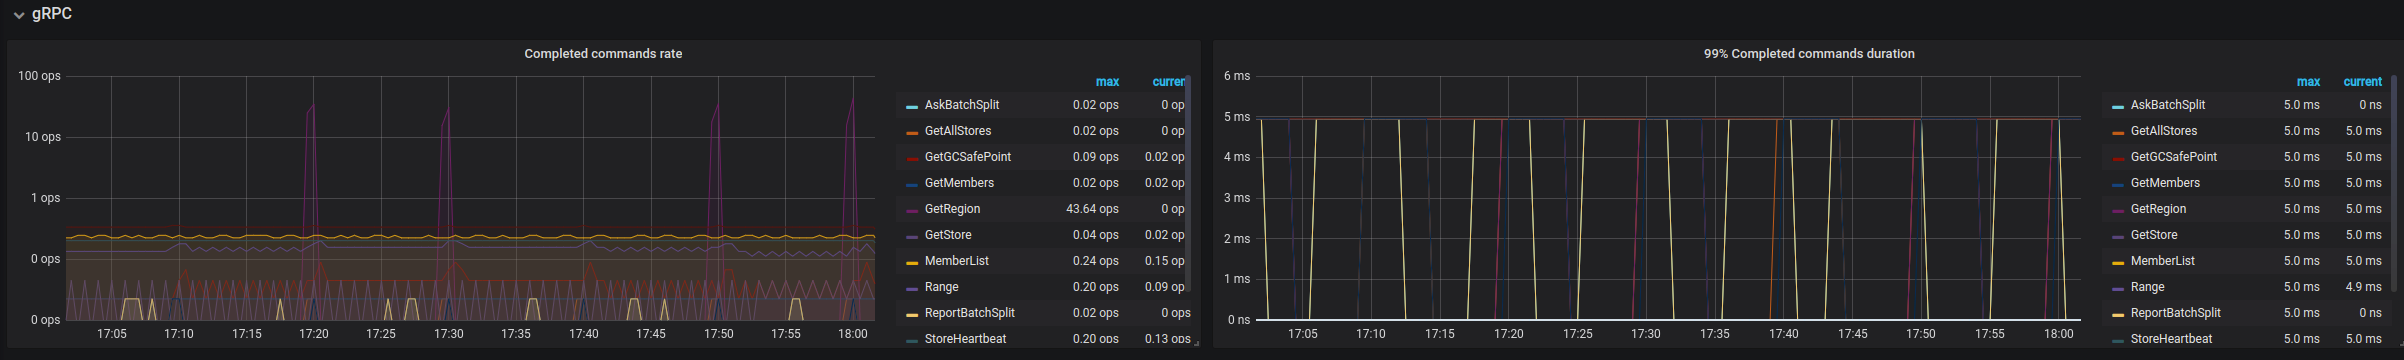
gRPC
- Completed commands rate: The rate per command type at which gRPC commands are completed
- 99% Completed commands duration: The rate per command type at which gRPC commands are completed (P99)
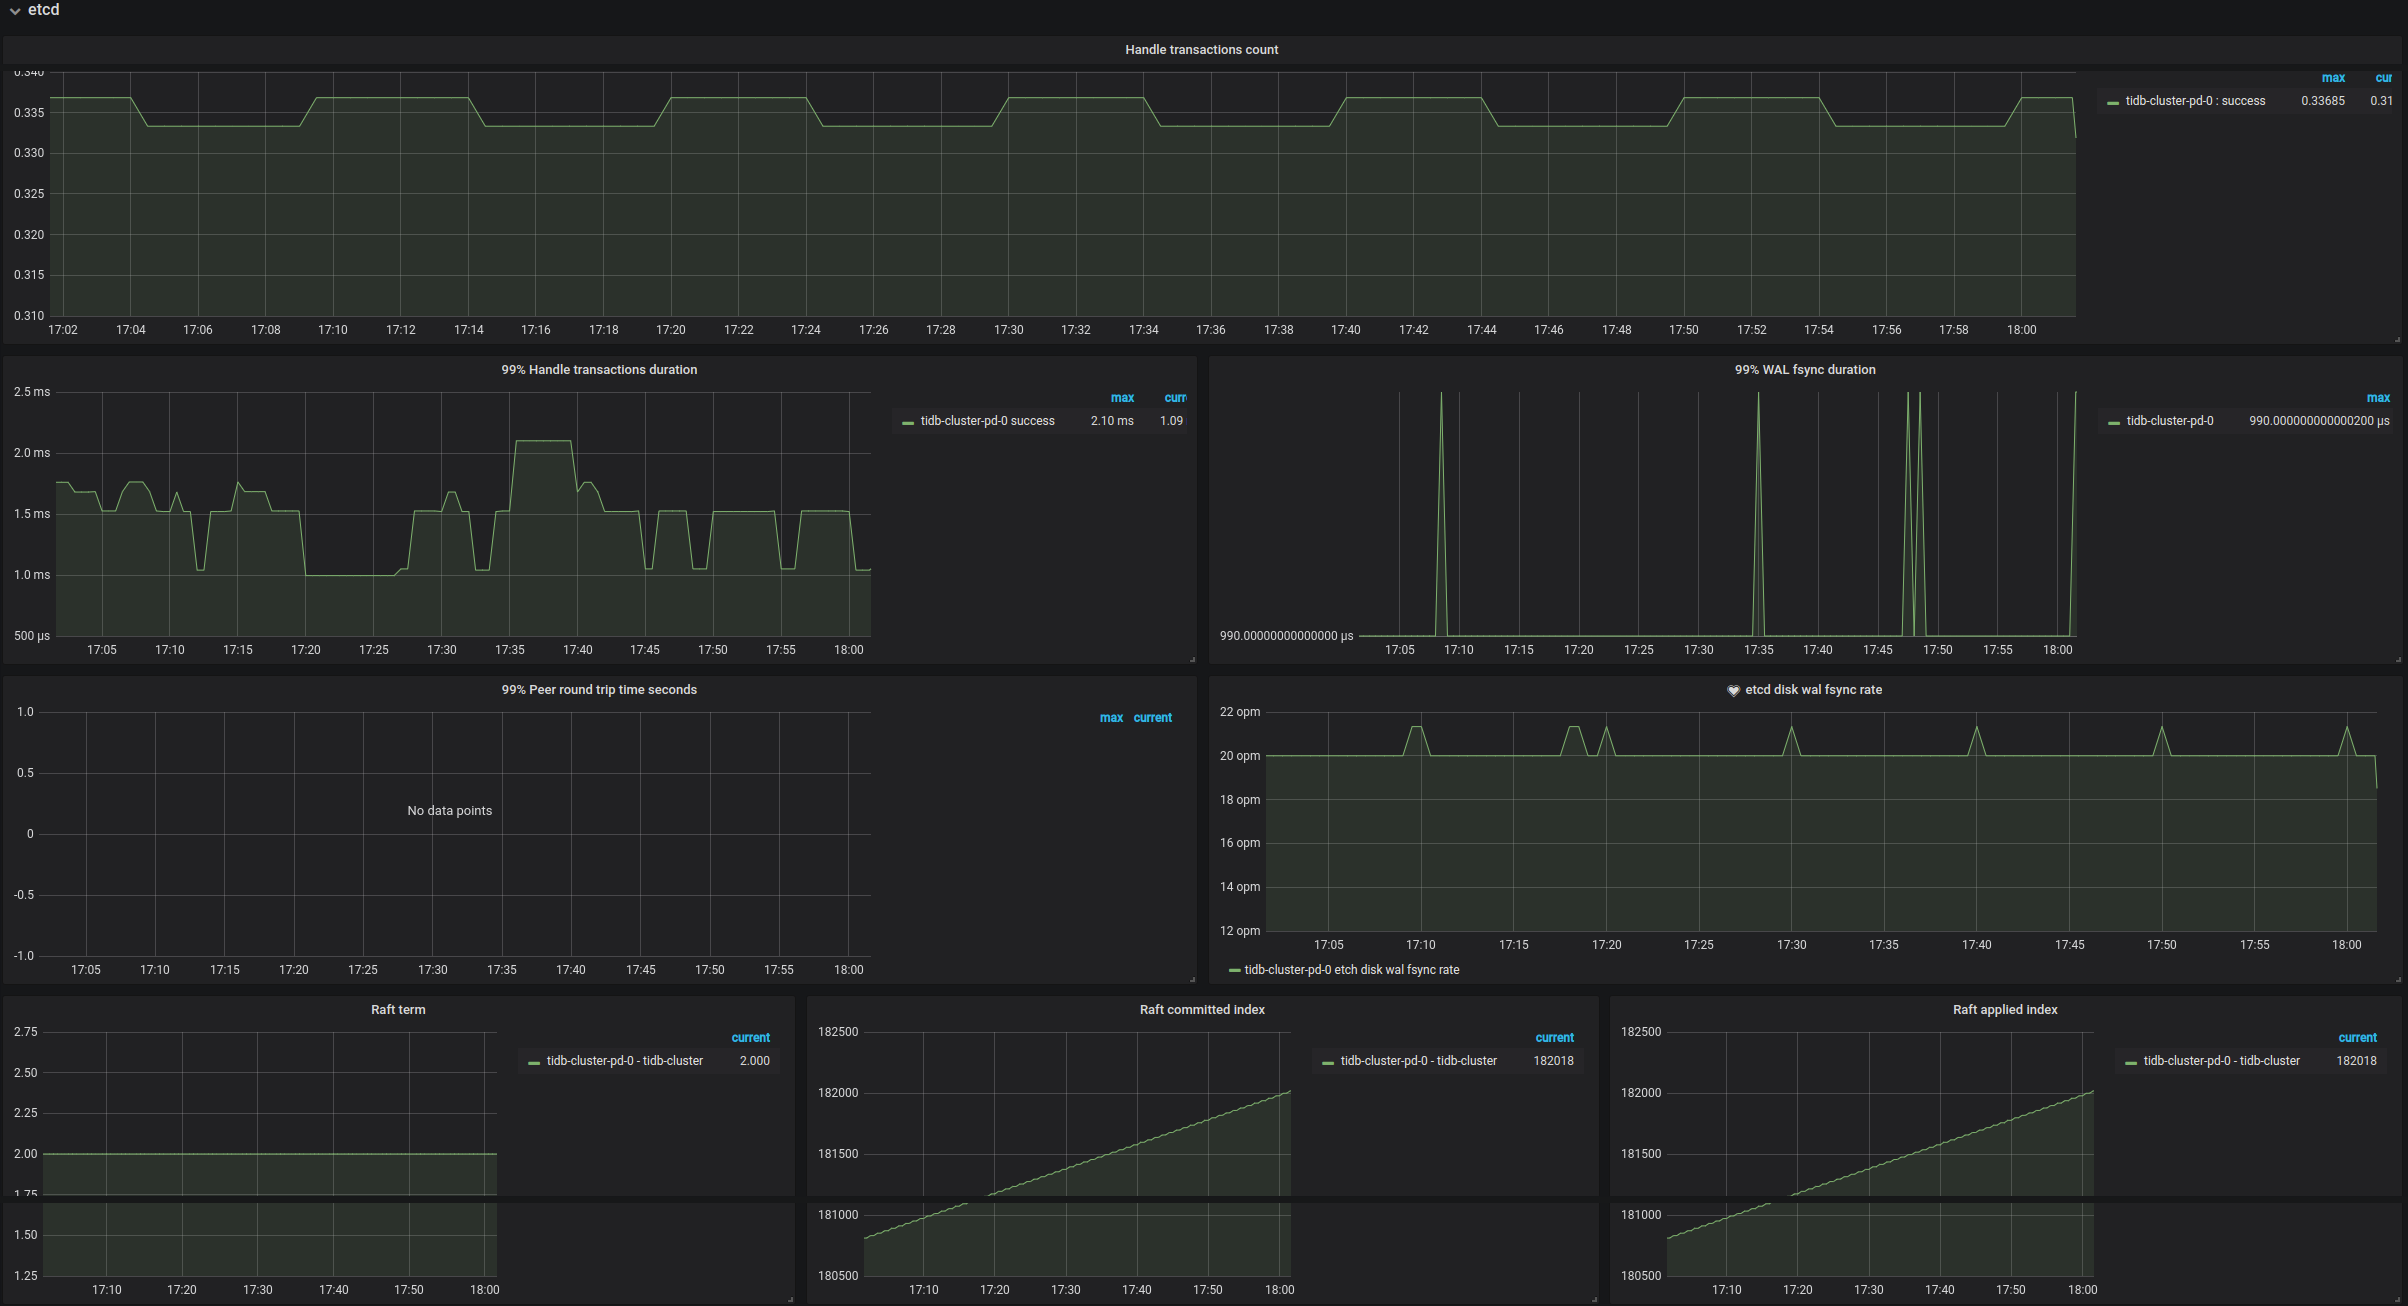
etcd
- Handle transactions count: The rate at which etcd handles transactions
- 99% Handle transactions duration: The transaction handling rate (P99)
- 99% WAL fsync duration: The time consumed for writing WAL into the persistent storage. It is less than
1s(P99) - 99% Peer round trip time seconds: The network latency for etcd (P99) | The value is less than
1s - etcd disk WAL fsync rate: The rate of writing WAL into the persistent storage
- Raft term: The current term of Raft
- Raft committed index: The last committed index of Raft
- Raft applied index: The last applied index of Raft
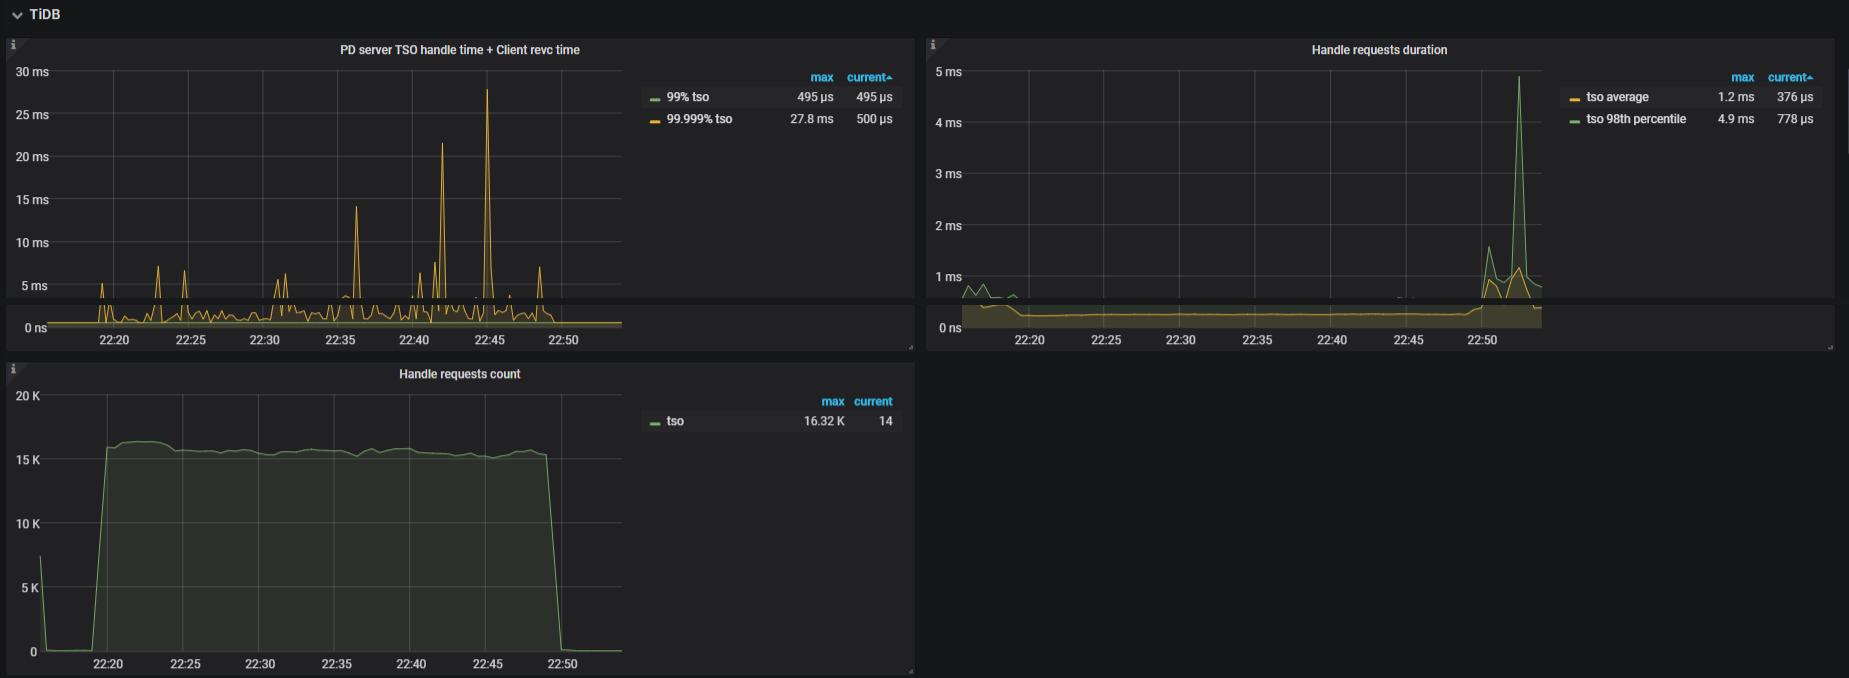
TiDB
- PD Server TSO handle time and Client recv time: The duration between PD receiving the TSO request and the PD client getting the TSO response
- Handle requests count: The count of TiDB requests
- Handle requests duration: The time consumed for handling TiDB requests. It should be less than
100ms(P99)
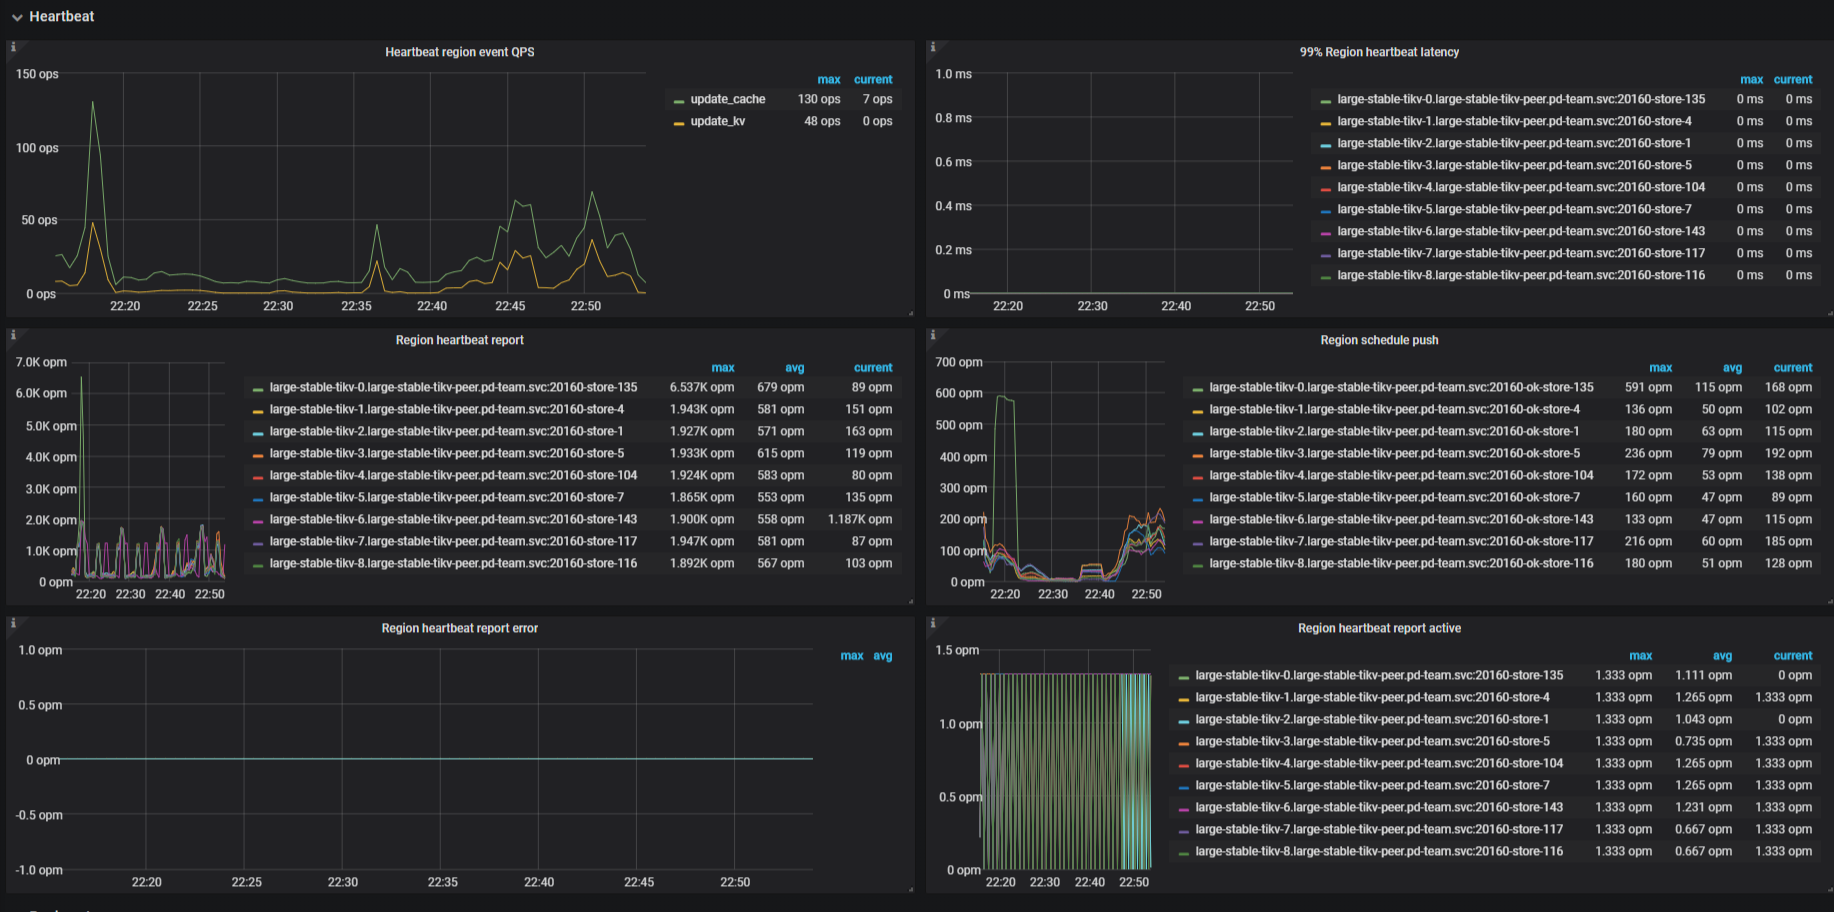
Heartbeat
- Heartbeat region event QPS: The QPS of handling heartbeat messages, including updating the cache and persisting data
- Region heartbeat report: The count of heartbeats reported to PD per instance
- Region heartbeat report error: The count of heartbeats with the
errorstatus - Region heartbeat report active: The count of heartbeats with the
okstatus - Region schedule push: The count of corresponding schedule commands sent from PD per TiKV instance
- 99% Region heartbeat latency: The heartbeat latency per TiKV instance (P99)
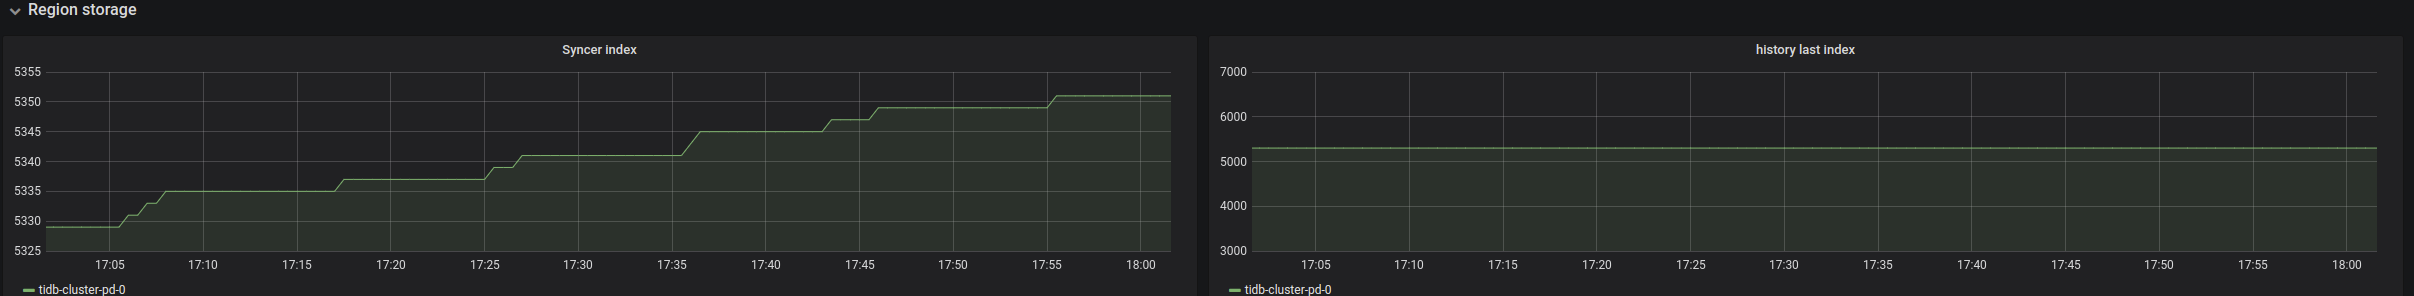
Region storage
- Syncer Index: The maximum index in the Region change history recorded by the leader
- history last index: The last index where the Region change history is synchronized successfully with the follower