Statement Execution Details of TiDB Dashboard
Click any item in the list to enter the detail page of the SQL statement to view more detailed information. This information includes the following parts:
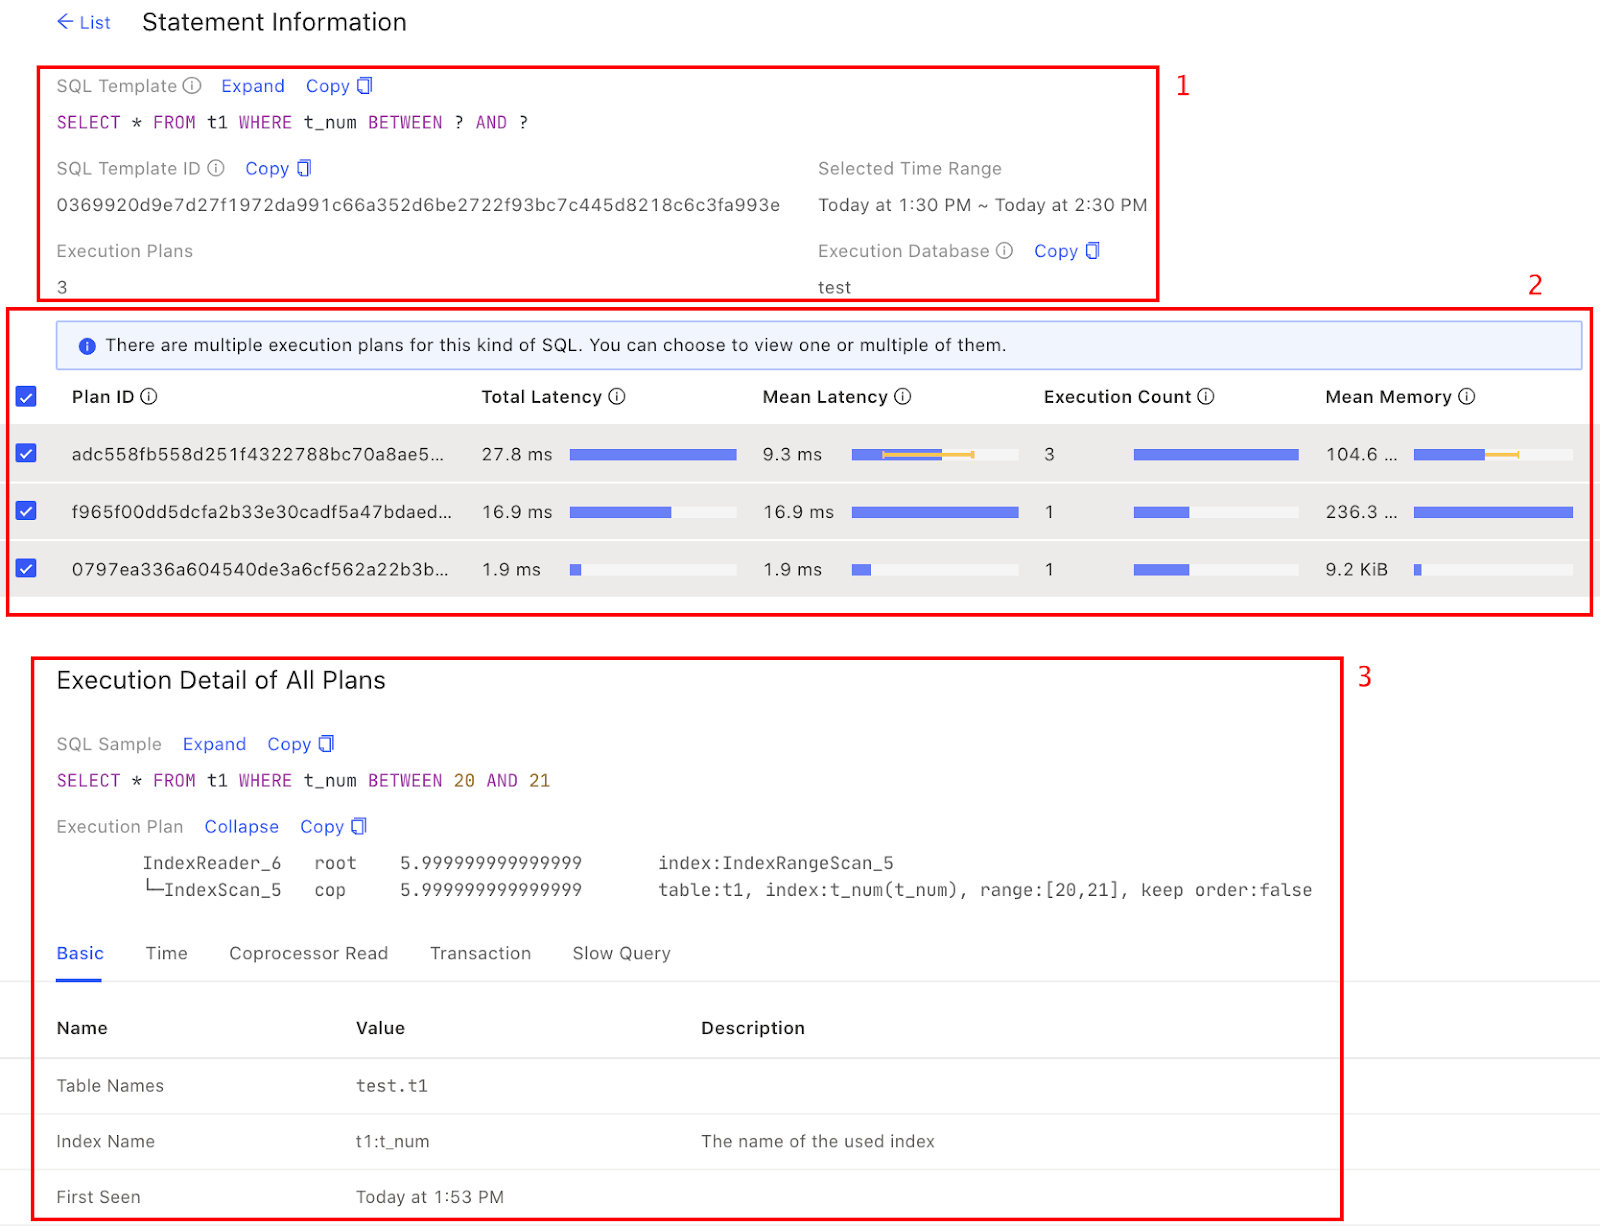
- The overview of SQL statements, which includes the SQL template, the SQL template ID, the current time range of displayed SQL executions, the number of execution plans and the database in which the SQL statement is executed (see area 1 in the image below).
- The execution plan list: If the SQL statement has multiple execution plans, this list is displayed. You can select different execution plans, and the details of the selected plans are displayed below the list. If there is only one execution plan, the list is not displayed (see area 2 below).
- Execution detail of plans, which displays the detailed information of the selected execution plans. See Execution plan in details (area 3 in the image below).
Execution details of plans
The execution detail of plans includes the following information:
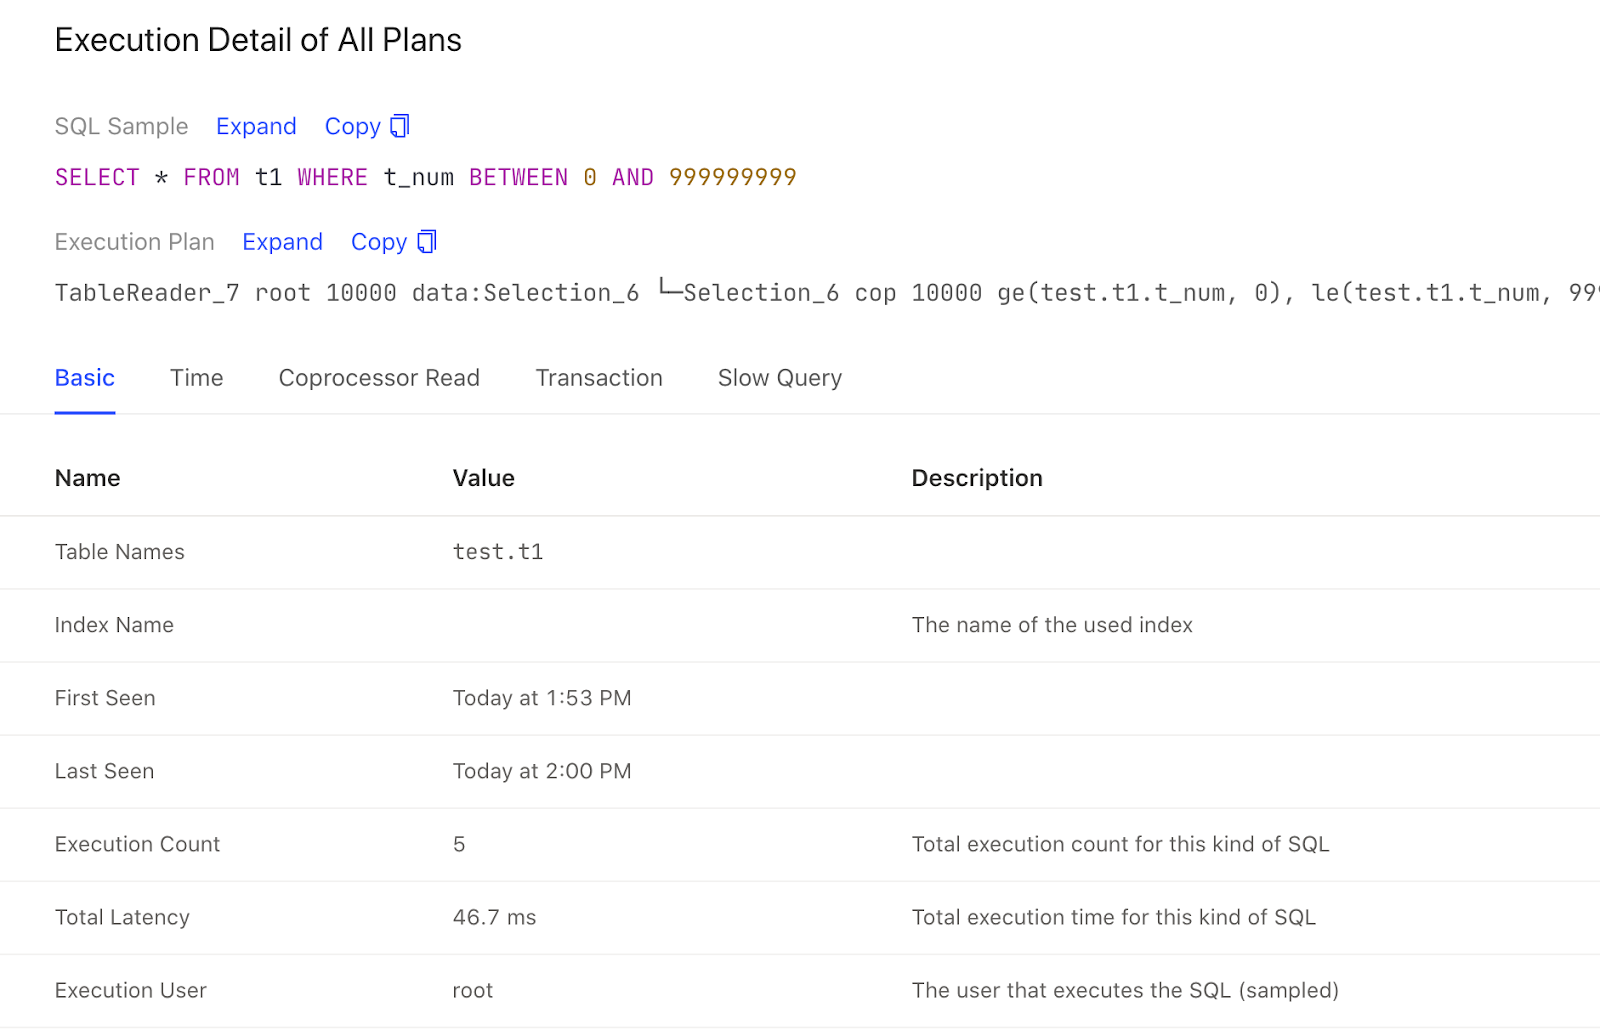
- SQL sample: The text of a certain SQL statement that is actually executed corresponding to the plan. Any SQL statement that has been executed within the time range might be used as a SQL sample.
- Execution plan: For details of the execution plan, see Understand the Query Execution Plan. If multiple execution plans are selected, only (any) one of them is displayed.
- For basic information, execution time, Coprocessor read, transaction, and slow query of the SQL statement, you can click the corresponding tab titles to switch among different information.
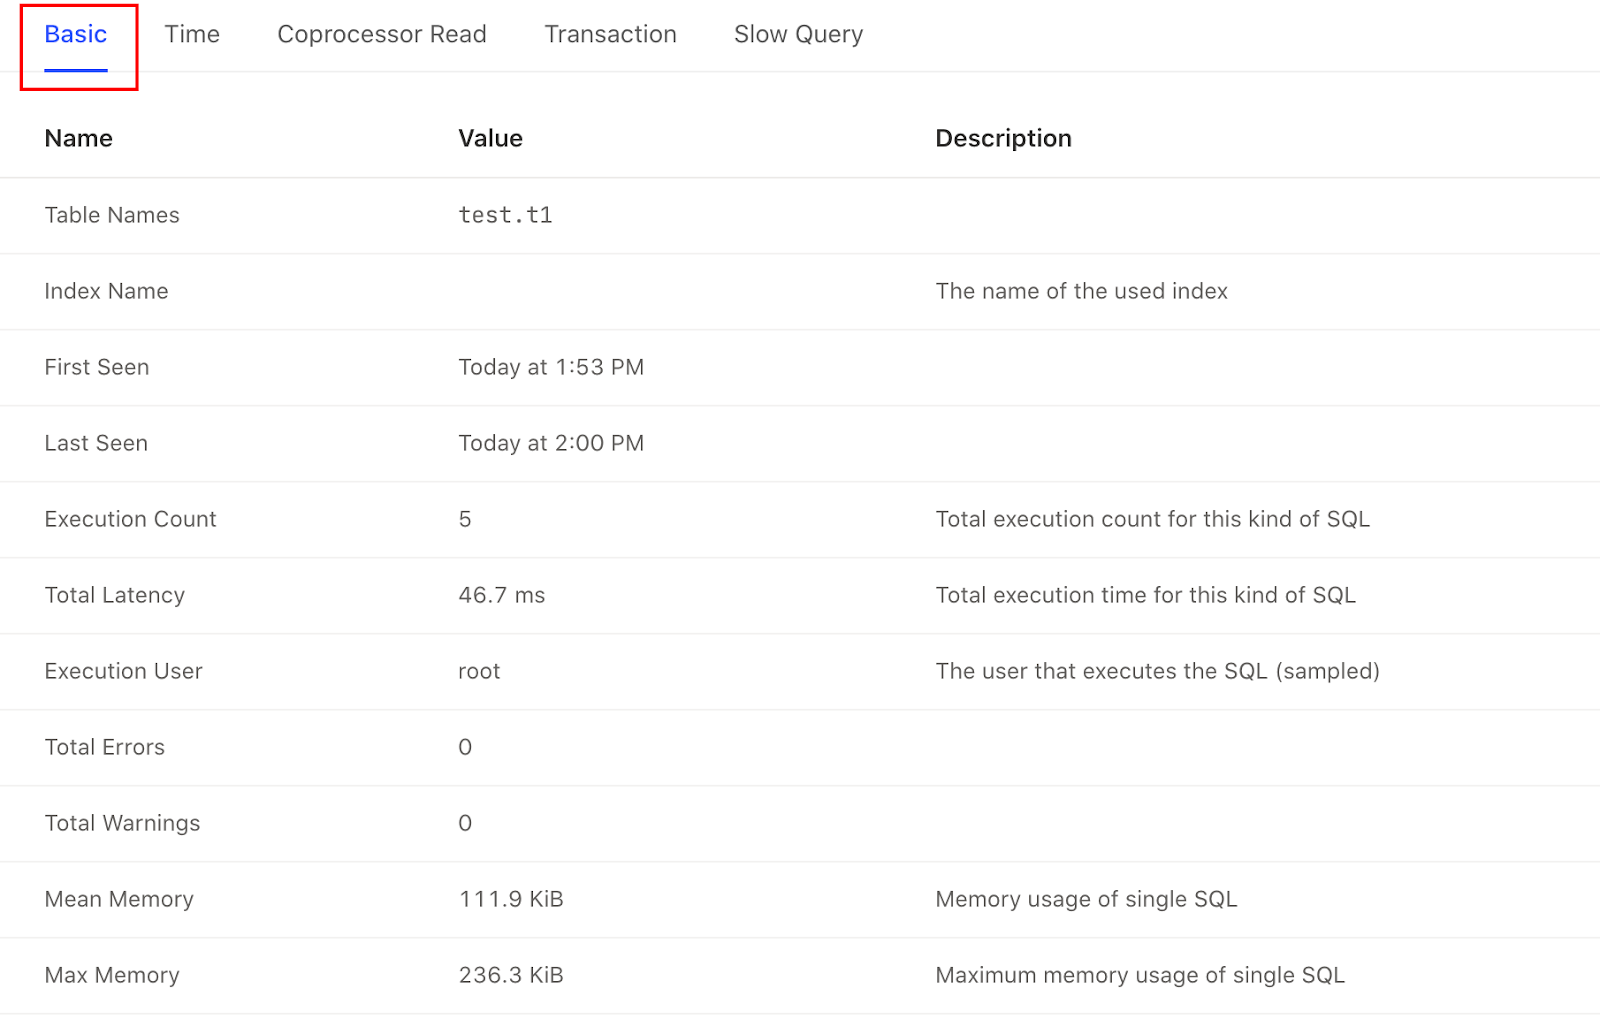
Basic Tab
The basic information of a SQL execution includes the table names, index name, execution count, and total latency. The Description column provides detailed description of each field.
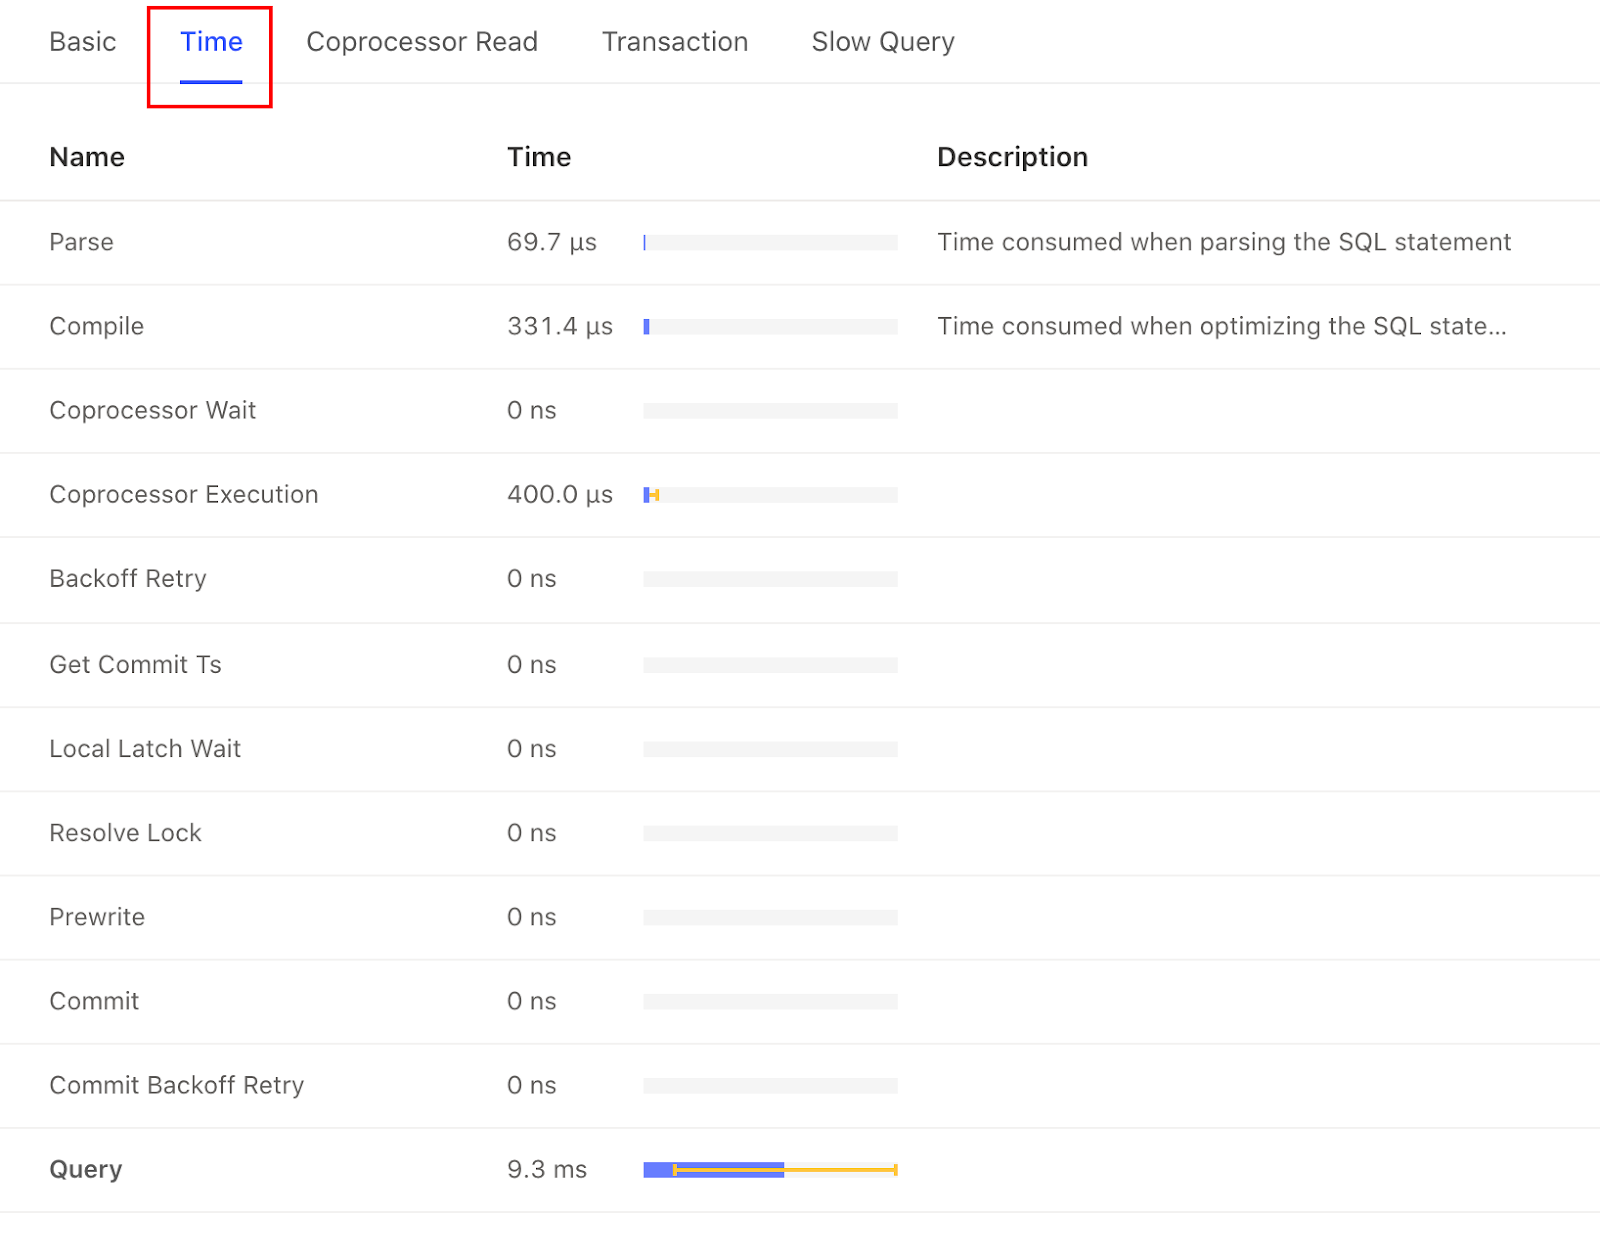
Time Tab
Click the Time tab, and you can see how long each stage of the execution plan lasts.
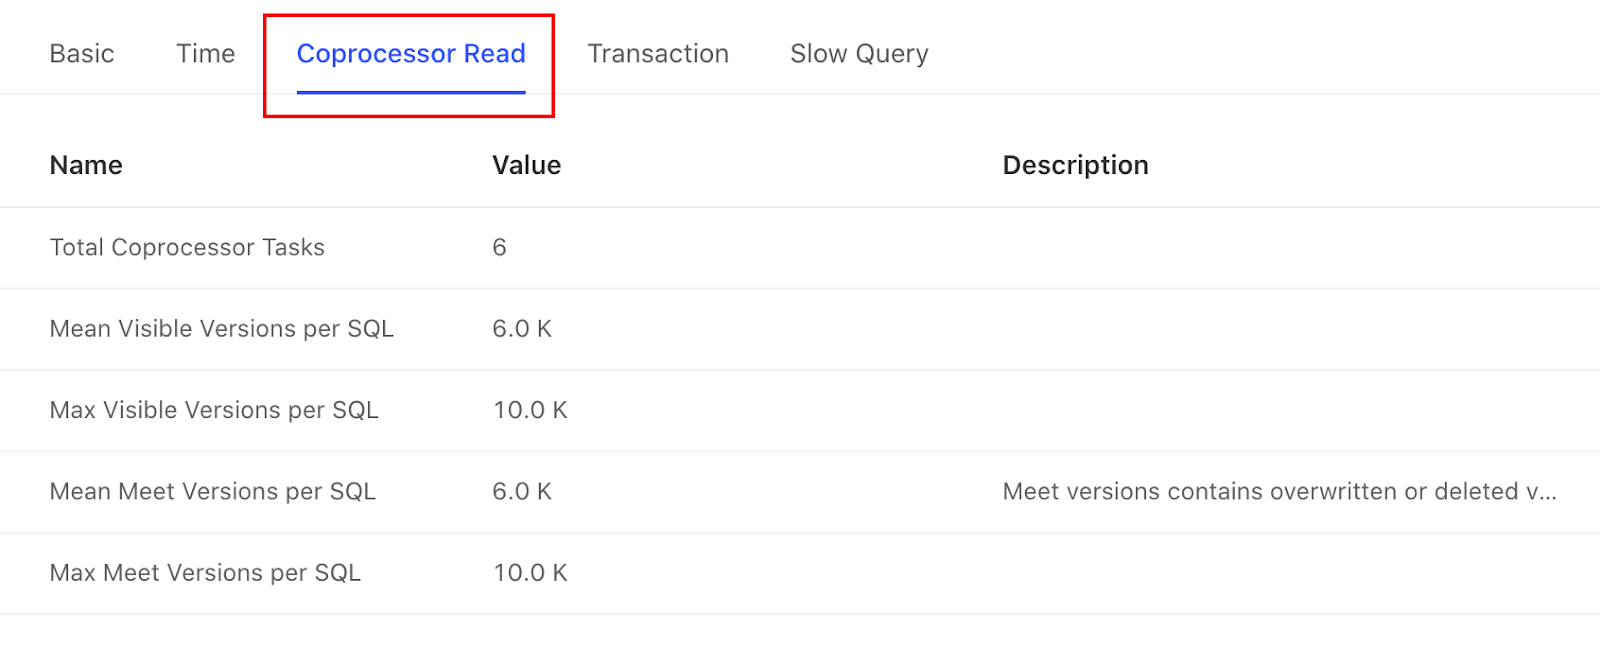
Coprocessor Read Tab
Click the Coprocessor Read tab, and you can see information related to Coprocessor read.
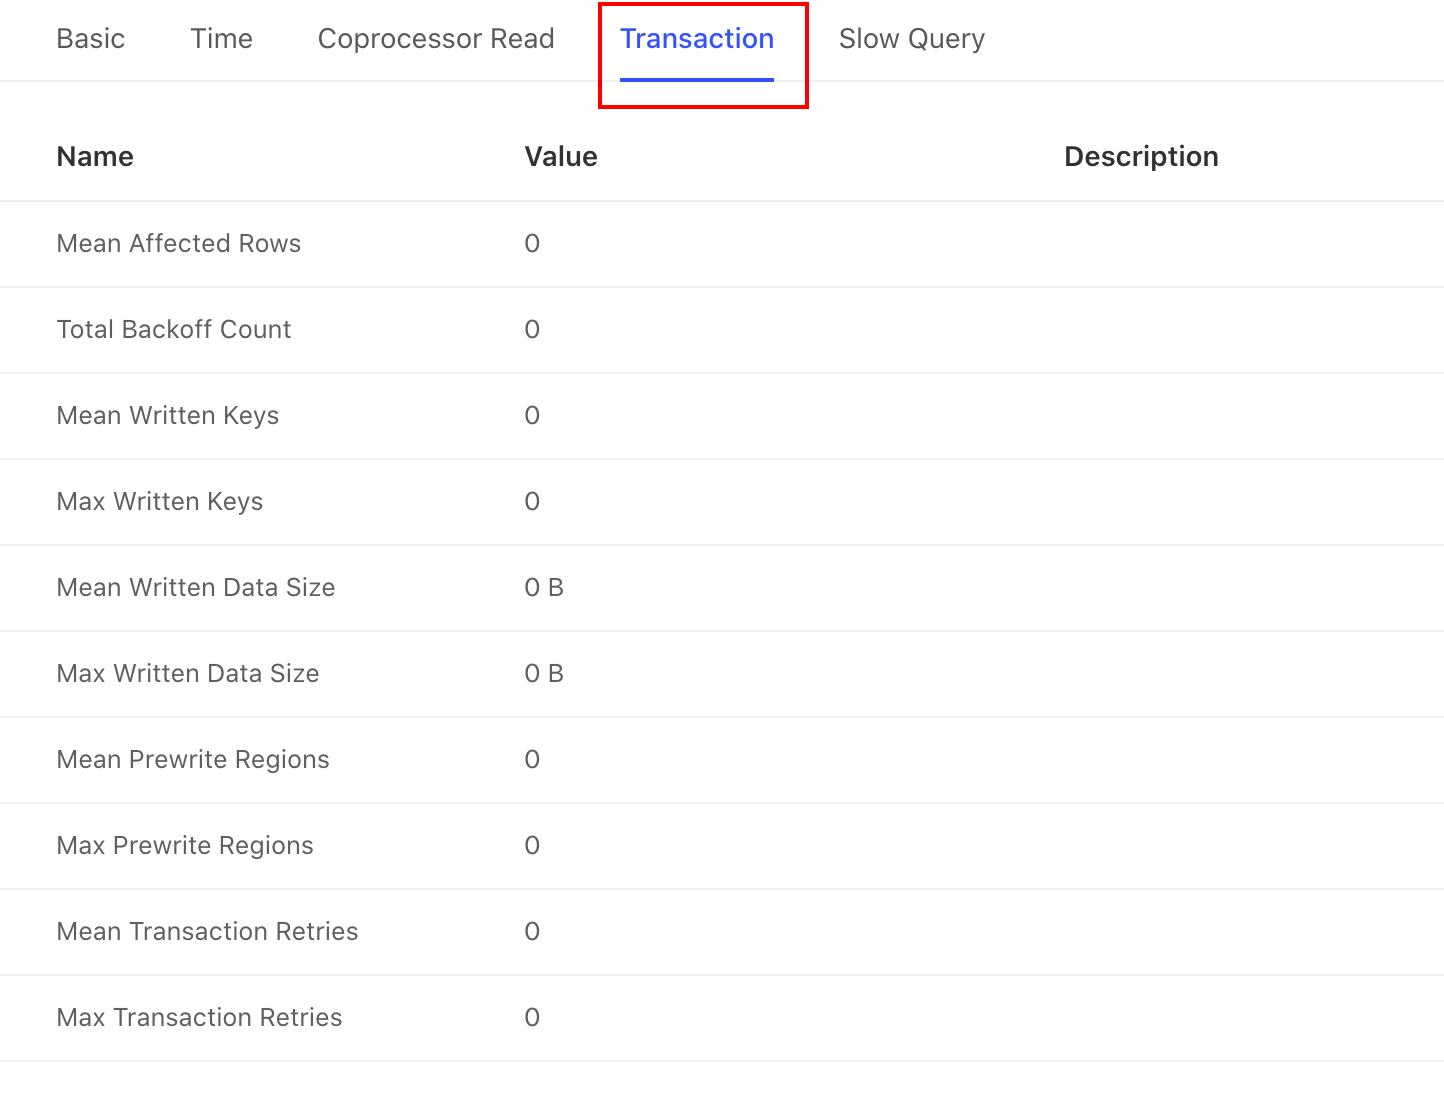
Transaction Tab
Click the Transaction tab, and you can see information related to execution plans and transactions, such as the average number of written keys or the maximum number of written keys.
Slow Query Tab
If an execution plan is executed too slowly, you can see its associated slow query records under the Slow Query tab.
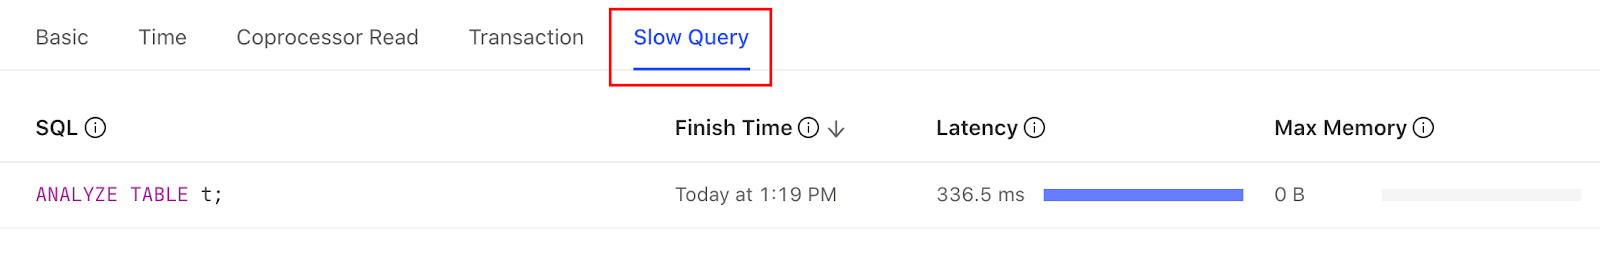
The information displayed in this area has the same structure with the slow query page. See TiDB Dashboard Slow Query Page for details.