Locate Problems Using Diagnostic Report of TiDB Dashboard
This document introduces how to locate problems using diagnostic report of TiDB Dashboard.
Comparison diagnostics
This section demonstrates how to use the comparison diagnostic feature to diagnose QPS jitter or latency increase caused by large queries or writes.
Example 1
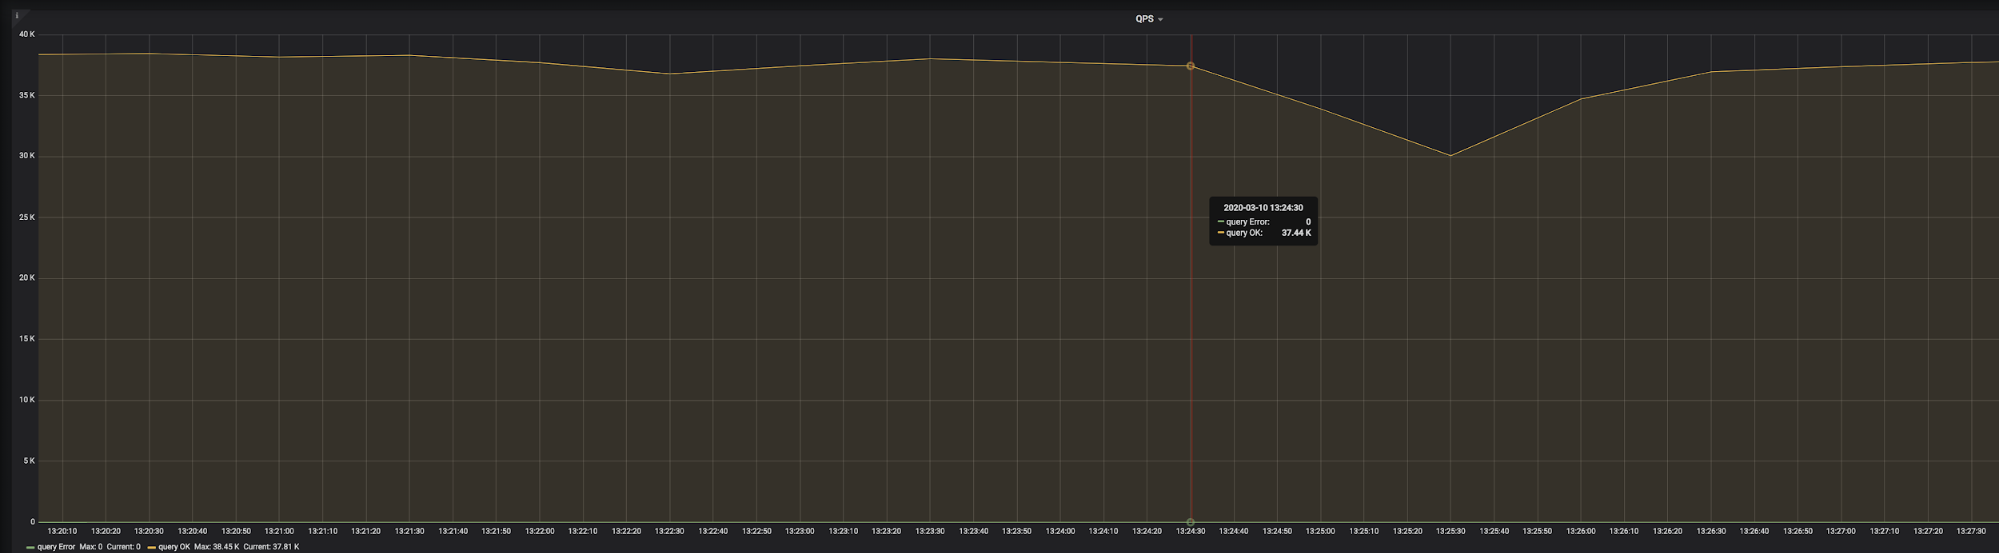
The result of a go-ycsb pressure test is shown in the image above. You can see that at 2020-03-10 13:24:30, QPS suddenly began to decrease. After 3 minutes, QPS began to return to normal. You can use diagnostic report of TiDB Dashboard to find out the cause.
Generate a report that compares the system in the following two time ranges:
T1: 2020-03-10 13:21:00 to 2020-03-10 13:23:00. In this range, the system is normal, which is called a reference range.
T2: 2020-03-10 13:24:30 to 2020-03-10 13:27:30. In this range, QPS began to decrease.
Because the impact range of jitter is 3 minutes, the two time ranges above are both 3 minutes. Because some monitored average values are used for comparison during diagnostics, too long a range will cause the difference of average values to be insignificant, and then the problem cannot be accurately located.
After the report is generated, you can view this report on the Compare Diagnose page.
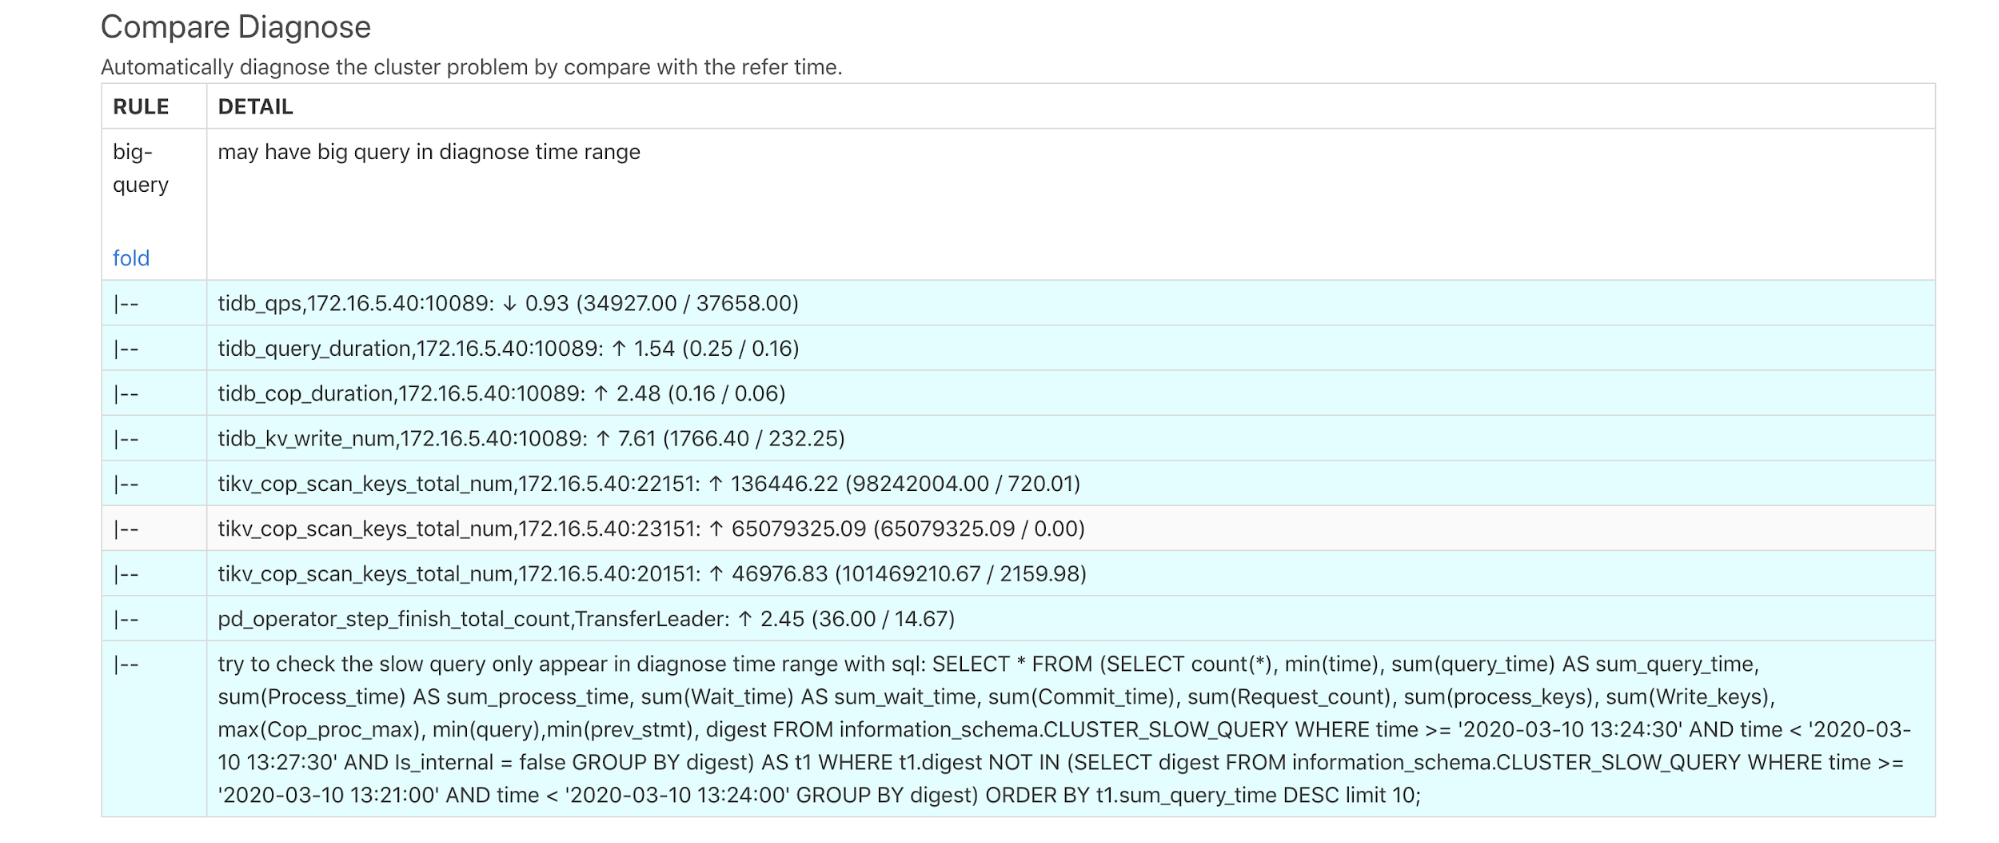
The diagnostic results above show that big queries might exist during the diagnostic time. Each DETAIL in the report above is described as follows:
tidb_qps: QPS decreased by 0.93 times.tidb_query_duration: P999 query latency increased by 1.54 times.tidb_cop_duration: The processing latency of P999 coprocessor requests increased by 2.48 times.tidb_kv_write_num: The number written KVs in the P999 TiDB transaction increased by 7.61 times.tikv_cop_scan_keys_total_nun: The number of keys/values scanned by the TiKV Coprocessor has greatly improved on 3 TiKV instances.- In
pd_operator_step_finish_total_count, the number of transferred leaders increases by 2.45 times, which means that the scheduling in the abnormal time range is higher than that in the normal time range. - The report indicates that there might be slow queries and indicates that you can use SQL statements to query slow queries. The execution result of the SQL statements are as follows:
SELECT * FROM (SELECT count(*), min(time), sum(query_time) AS sum_query_time, sum(Process_time) AS sum_process_time, sum(Wait_time) AS sum_wait_time, sum(Commit_time), sum(Request_count), sum(process_keys), sum(Write_keys), max(Cop_proc_max), min(query),min(prev_stmt), digest FROM information_schema.CLUSTER_SLOW_QUERY WHERE time >= '2020-03-10 13:24:30' AND time < '2020-03-10 13:27:30' AND Is_internal = false GROUP BY digest) AS t1 WHERE t1.digest NOT IN (SELECT digest FROM information_schema.CLUSTER_SLOW_QUERY WHERE time >= '2020-03-10 13:21:00' AND time < '2020-03-10 13:24:00' GROUP BY digest) ORDER BY t1.sum_query_time DESC limit 10\G
***************************[ 1. row ]***************************
count(*) | 196
min(time) | 2020-03-10 13:24:30.204326
sum_query_time | 46.878509117
sum_process_time | 265.924
sum_wait_time | 8.308
sum(Commit_time) | 0.926820886
sum(Request_count) | 6035
sum(process_keys) | 201453000
sum(Write_keys) | 274500
max(Cop_proc_max) | 0.263
min(query) | delete from test.tcs2 limit 5000;
min(prev_stmt) |
digest | 24bd6d8a9b238086c9b8c3d240ad4ef32f79ce94cf5a468c0b8fe1eb5f8d03df
From the result above, you can see that from 13:24:30, there is a large write of batch deletion, which has been executed 196 times in total, each time deleting 5,000 rows of data, in a total duration of 46.8 seconds.
Example 2
If a large query has not been executed, the query is not recorded in the slow log. In this situation, this large query can still be diagnosed. See the following example:
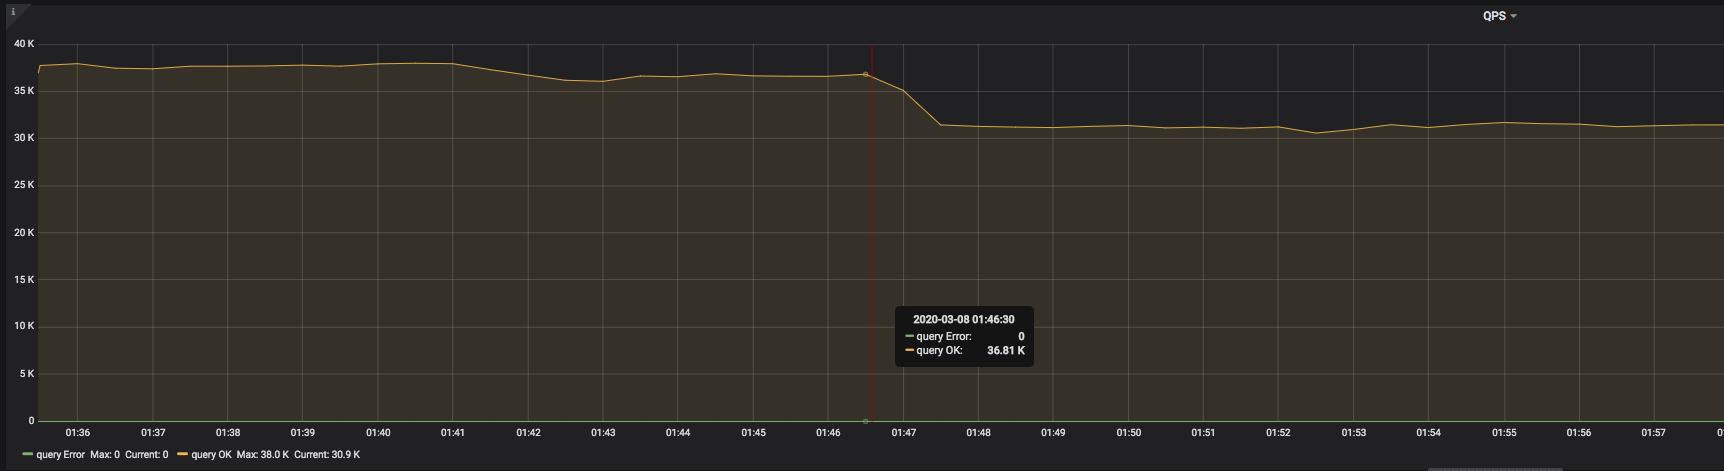
The result of another go-ycsb pressure test is shown in the image above. You can see that at 2020-03-08 01:46:30, QPS suddenly began to drop and did not recover.
Generate a report that compares the system in the following two time ranges:
T1: 2020-03-08 01:36:00 to 2020-03-08 01:41:00. In this range, the system is normal, which is called a reference range.
T2: 2020-03-08 01:46:30 to 2020-03-08 01:51:30. In this range, QPS began to decrease.
After the report is generated, you can view this report on the Compare Diagnose page.
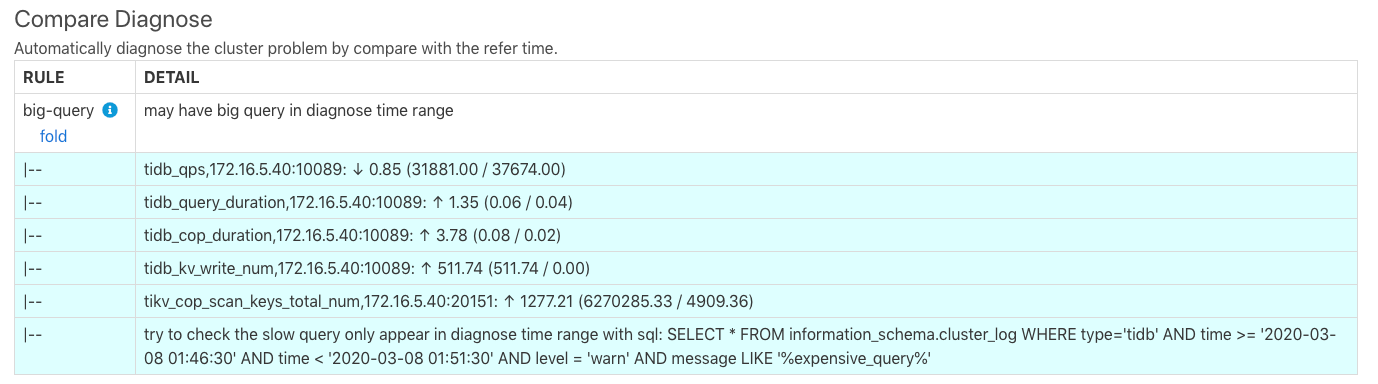
The diagnostic result is similar to that of example 1. The last row of the image above indicates that there might be slow queries and indicate that you can use SQL statements to query the expensive queries in the TiDB log. The execution result of the SQL statements are as follows.
> SELECT * FROM information_schema.cluster_log WHERE type='tidb' AND time >= '2020-03-08 01:46:30' AND time < '2020-03-08 01:51:30' AND level = 'warn' AND message LIKE '%expensive_query%'\G
TIME     | 2020/03/08 01:47:35.846
TYPE     | tidb
INSTANCE | 172.16.5.40:4009
LEVEL    | WARN
MESSAGE  | [expensivequery.go:167] [expensive_query] [cost_time=60.085949605s] [process_time=2.52s] [wait_time=2.52s] [request_count=9] [total_keys=996009] [process_keys=996000] [num_cop_tasks=9] [process_avg_time=0.28s] [process_p90_time=0.344s] [process_max_time=0.344s] [process_max_addr=172.16.5.40:20150] [wait_avg_time=0.000777777s] [wait_p90_time=0.003s] [wait_max_time=0.003s] [wait_max_addr=172.16.5.40:20150] [stats=t_wide:pseudo] [conn_id=19717] [user=root] [database=test] [table_ids="[80,80]"] [txn_start_ts=415132076148785201] [mem_max="23583169 Bytes (22.490662574768066 MB)"] [sql="select count(*) from t_wide as t1 join t_wide as t2 where t1.c0>t2.c1 and t1.c2>0"]
The query result above shows that on this 172.16.5.40:4009 TiDB instance, at 2020/03/08 01:47:35.846 there is an expensive query that has been executed for 60 seconds, but the execution has not yet been finished. This query is a join of Cartesian products.
Locate problems using comparison diagnostic report
Because the diagnostics might be wrong, using a comparison report might help DBAs locate problems more quickly. See the following example.
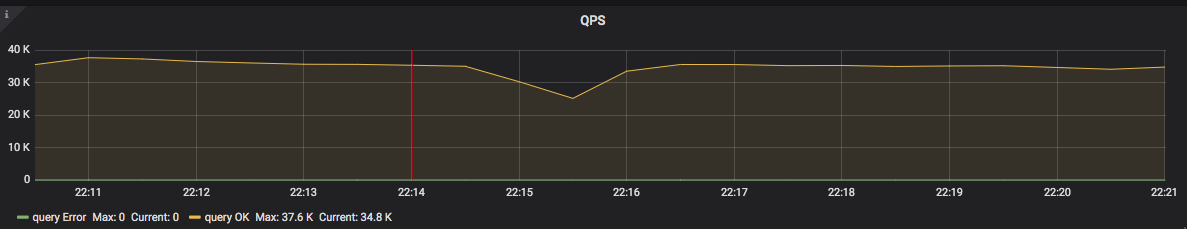
The result of a go-ycsb pressure test is shown in the image above. You can see that at 2020-05-22 22:14:00, QPS suddenly began to decrease. After 3 minutes, QPS began to return to normal. You can use the comparison diagnostic report of TiDB Dashboard to find out the cause.
Generate a report that compares the system in the following two time ranges:
T1: 2020-05-22 22:11:00 to 2020-05-22 22:14:00. In this range, the system is normal, which is called a reference range.
T2: 2020-05-22 22:14:00 2020-05-22 22:17:00. In this range, QPS began to decrease.
After generating the comparison report, check the Max diff item report. This report compares the monitoring items of the two time ranges above and sorts them according to the difference of the monitoring items. The result of this table is as follows:
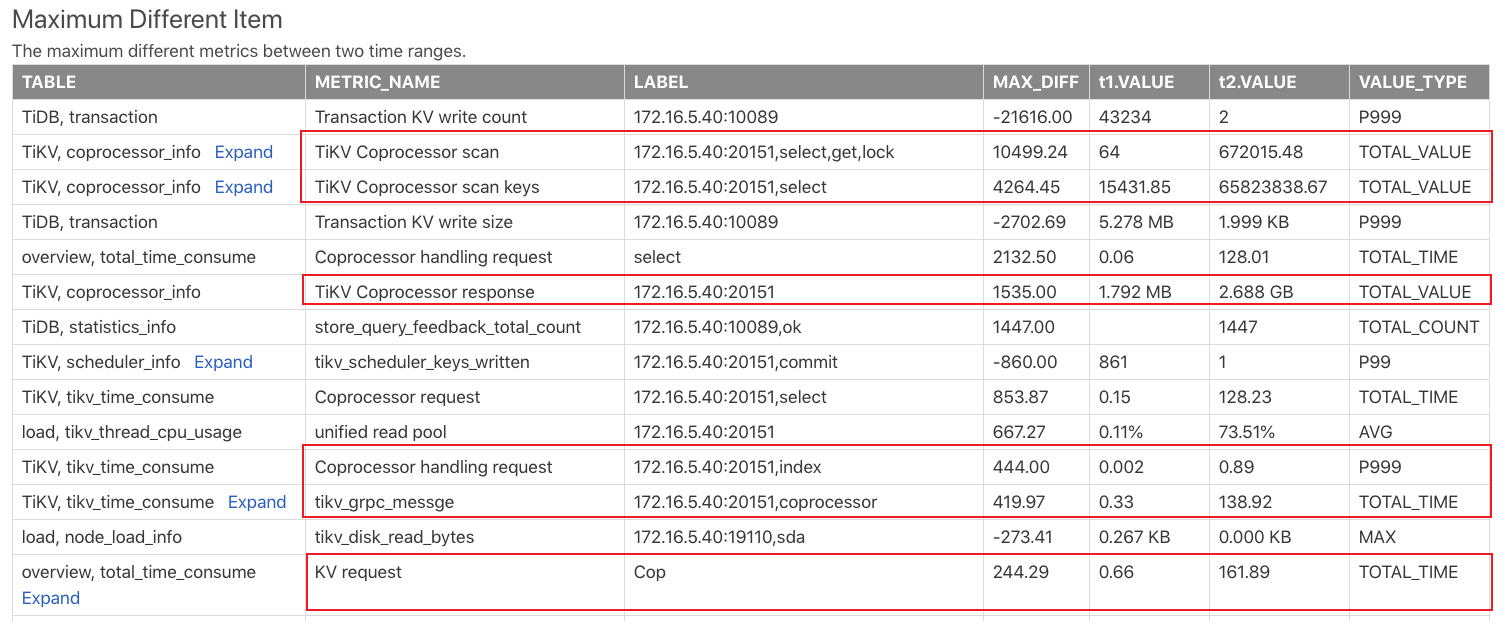
From the result above, you can see that the Coprocessor requests in T2 are much more than those in T1. It might be that some large queries appear in T2 that bring more load.
In fact, during the entire time range from T1 to T2, the go-ycsb pressure test is running. Then 20 tpch queries are running during T2. So it is the tpch queries that cause many Coprocessor requests.
If such a large query whose execution time exceeds the threshold of slow log is recorded in the slow log. You can check the Slow Queries In Time Range t2 report to see whether there is any slow query. However, some queries in T1 might become slow queries in T2, because in T2, other loads cause their executions to slow down.