TiDB Monitoring Framework Overview
The TiDB monitoring framework adopts two open source projects: Prometheus and Grafana. TiDB uses Prometheus to store the monitoring and performance metrics and Grafana to visualize these metrics.
About Prometheus in TiDB
As a time series database, Prometheus has a multi-dimensional data model and flexible query language. As one of the most popular open source projects, Prometheus has been adopted by many companies and organizations and has a very active community. PingCAP is one of the active developers and adopters of Prometheus for monitoring and alerting in TiDB, TiKV and PD.
Prometheus consists of multiple components. Currently, TiDB uses the following of them:
- The Prometheus Server to scrape and store time series data
- The client libraries to customize necessary metrics in the application
- An Alertmanager for the alerting mechanism
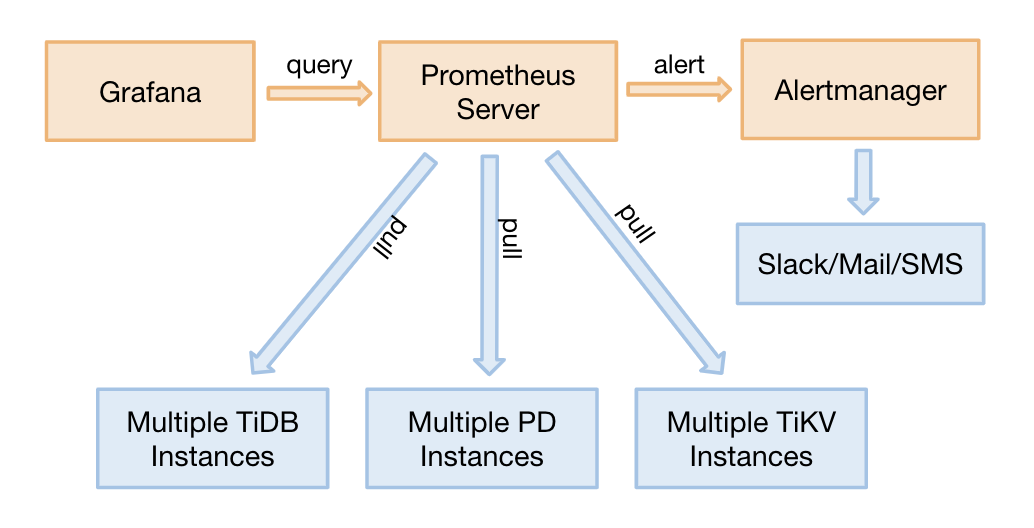
The diagram is as follows:
About Grafana in TiDB
Grafana is an open source project for analyzing and visualizing metrics. TiDB uses Grafana to display the performance metrics as follows:
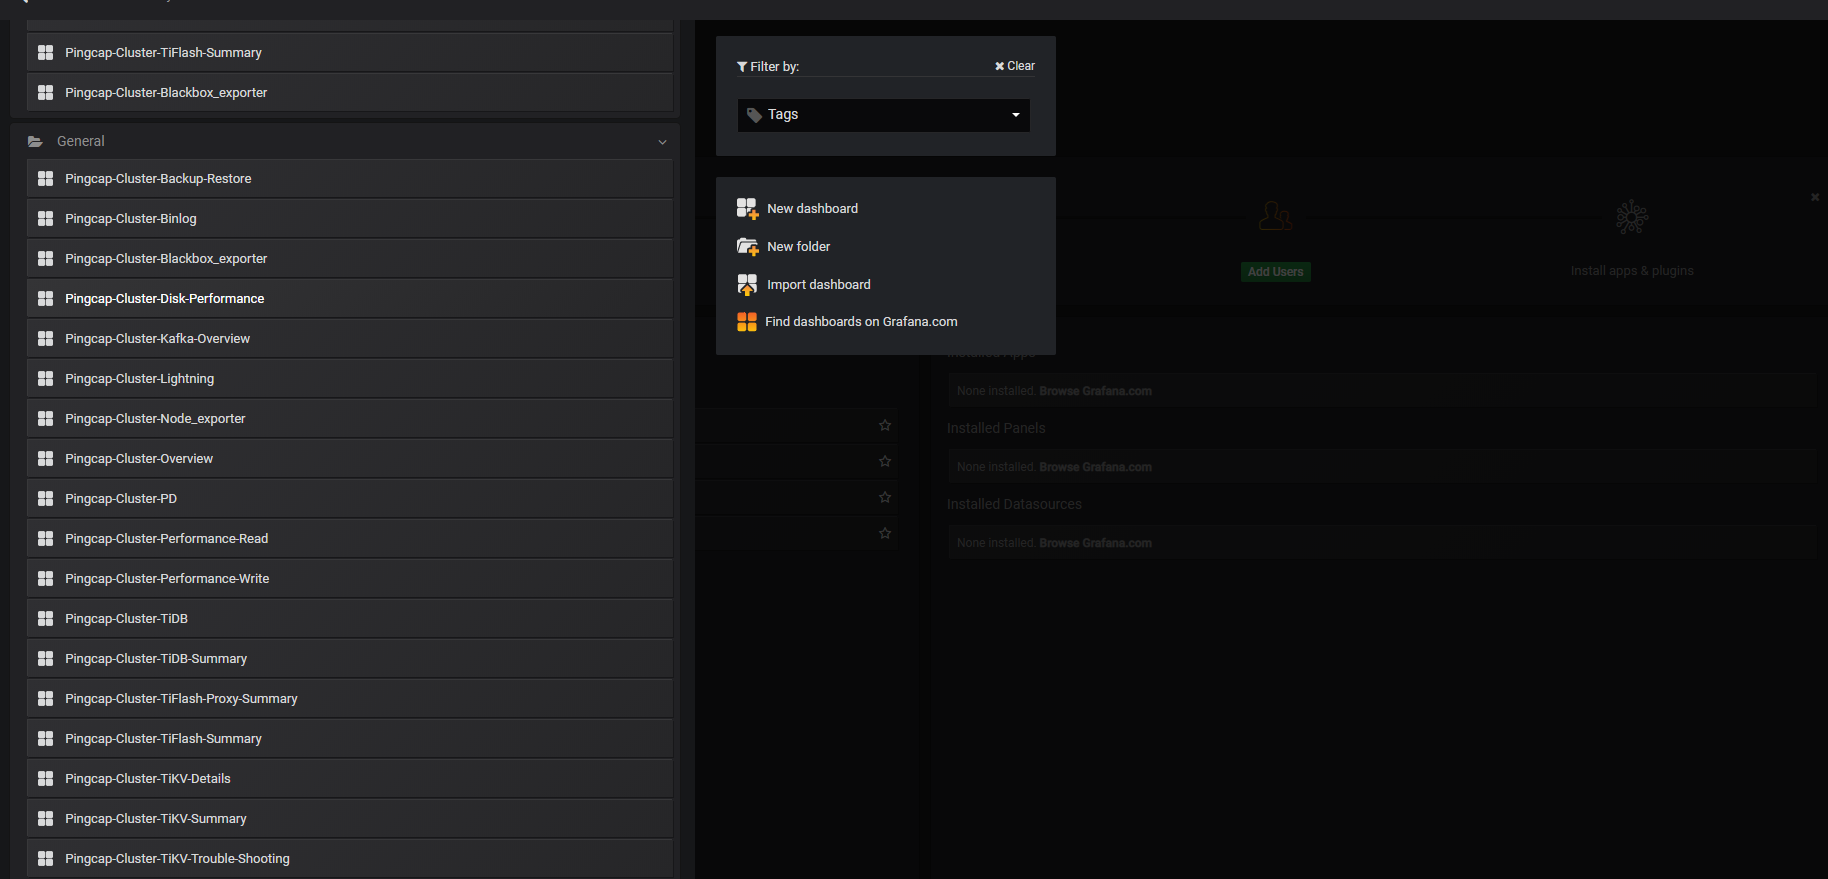
- {TiDB_Cluster_name}-Backup-Restore: Monitoring metrics related to backup and restore.
- {TiDB_Cluster_name}-Binlog: Monitoring metrics related to TiDB Binlog.
- {TiDB_Cluster_name}-Blackbox_exporter: Monitoring metrics related to network probe.
- {TiDB_Cluster_name}-Disk-Performance: Monitoring metrics related to disk performance.
- {TiDB_Cluster_name}-Kafka-Overview: Monitoring metrics related to Kafka.
- {TiDB_Cluster_name}-Lightning: Monitoring metrics related to TiDB Lightning.
- {TiDB_Cluster_name}-Node_exporter: Monitoring metrics related to the operating system.
- {TiDB_Cluster_name}-Overview: Monitoring overview related to important components.
- {TiDB_Cluster_name}-PD: Monitoring metrics related to the PD server.
- {TiDB_Cluster_name}-Performance-Read: Monitoring metrics related to read performance.
- {TiDB_Cluster_name}-Performance-Write: Monitoring metrics related to write performance.
- {TiDB_Cluster_name}-TiDB: Detailed monitoring metrics related to the TiDB server.
- {TiDB_Cluster_name}-TiDB-Summary: Monitoring overview related to TiDB.
- {TiDB_Cluster_name}-TiFlash-Proxy-Summary: Monitoring overview of the proxy server that is used to replicate data to TiFlash.
- {TiDB_Cluster_name}-TiFlash-Summary: Monitoring overview related to TiFlash.
- {TiDB_Cluster_name}-TiKV-Details: Detailed monitoring metrics related to the TiKV server.
- {TiDB_Cluster_name}-TiKV-Summary: Monitoring overview related to the TiKV server.
- {TiDB_Cluster_name}-TiKV-Trouble-Shooting: Monitoring metrics related to the TiKV error diagnostics.
- {TiDB_Cluster_name}-TiCDC:Detailed monitoring metrics related to TiCDC.
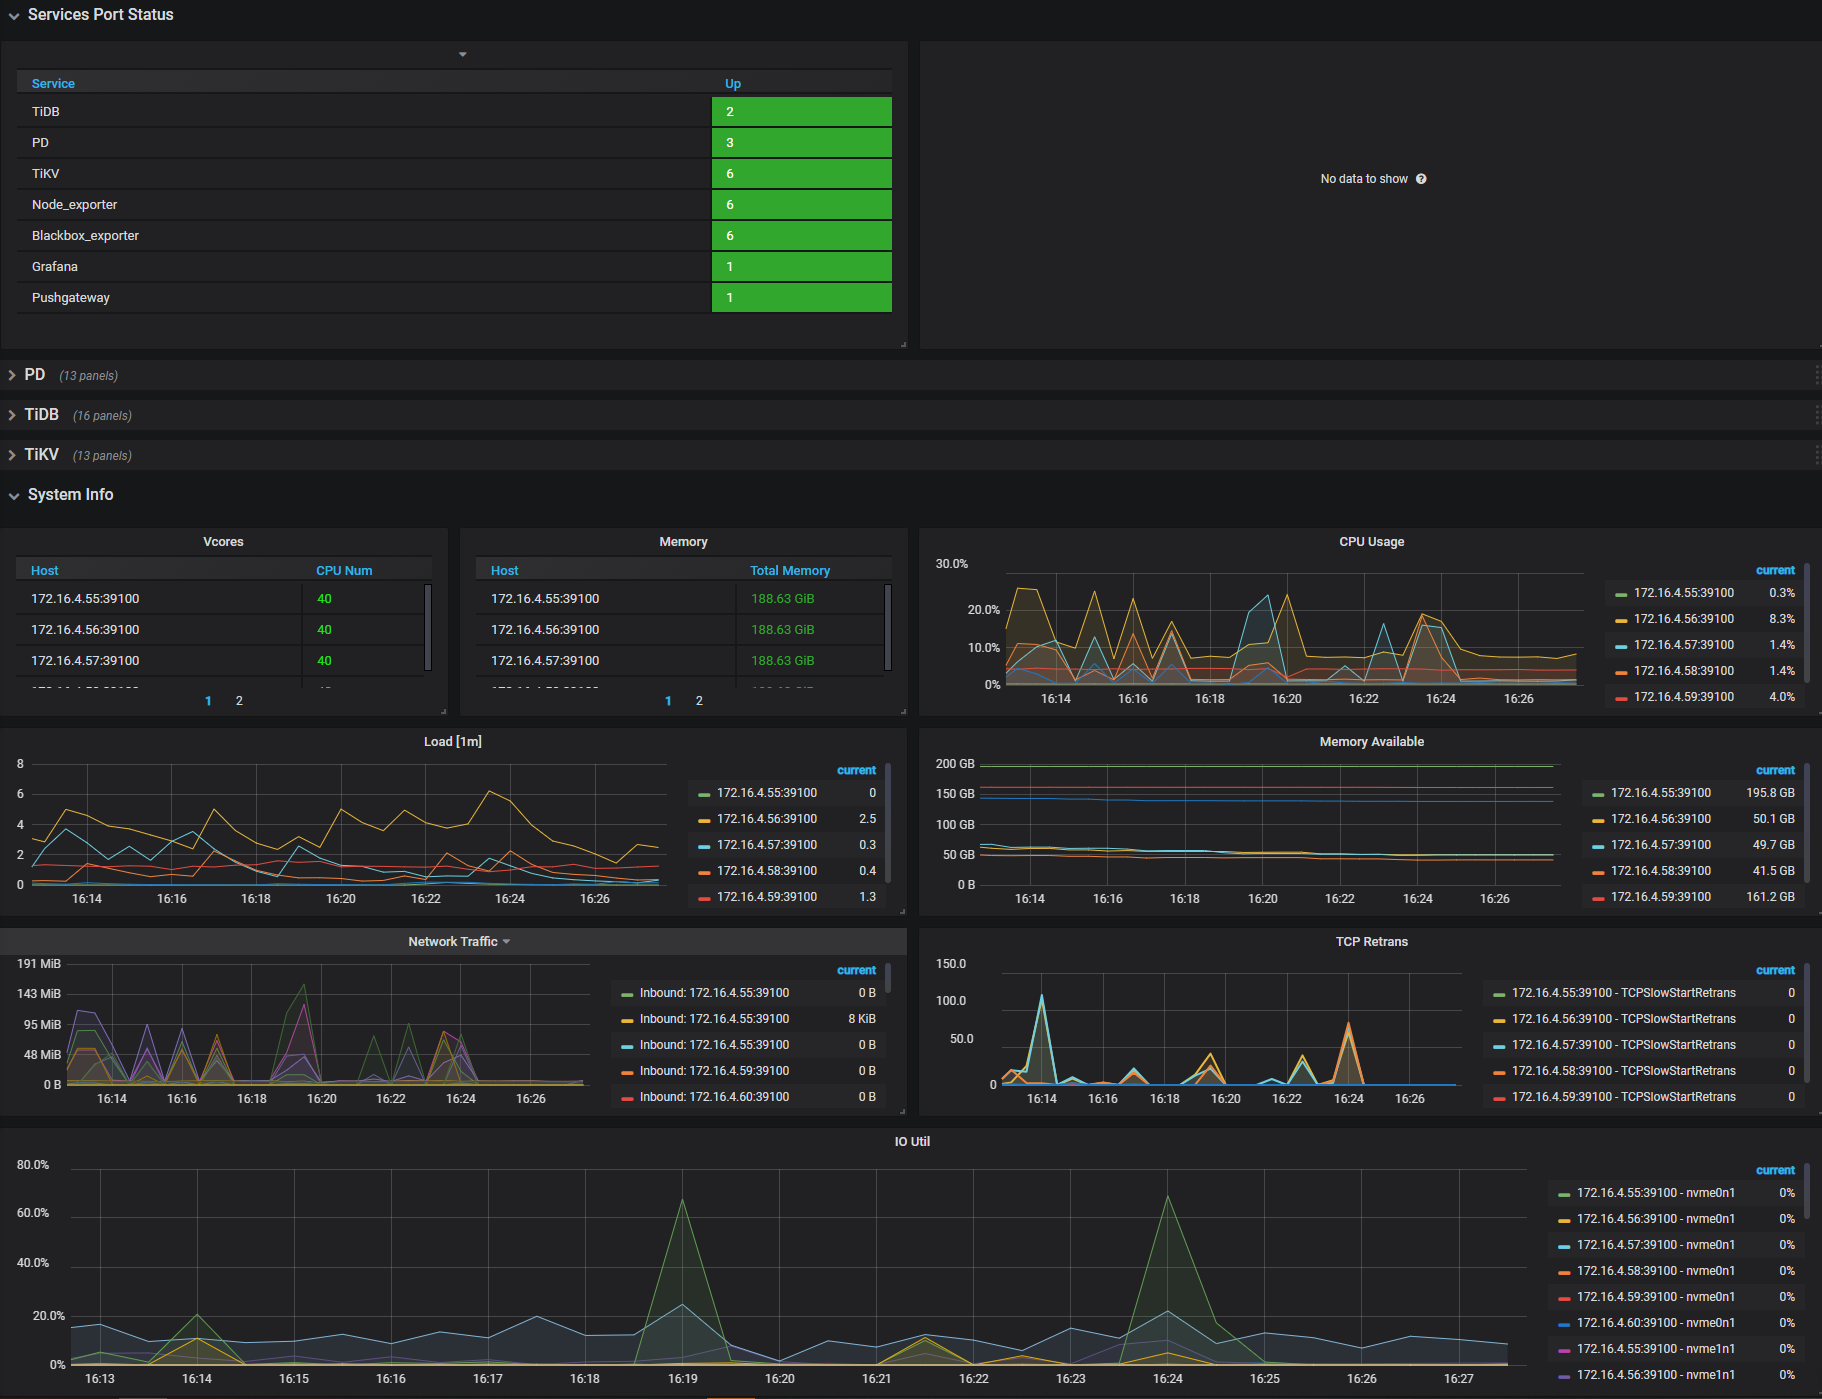
Each group has multiple panel labels of monitoring metrics, and each panel contains detailed information of multiple monitoring metrics. For example, the Overview monitoring group has five panel labels, and each labels corresponds to a monitoring panel. See the following UI: