Introduction to Statistics
In TiDB, the statistical information you need to maintain includes the total number of rows in the table, the equal-depth histogram of columns, Count-Min Sketch, the number of Nulls, the average length, the number of different values, etc. This document briefly introduces the histogram and Count-Min Sketch, and details the collection and maintenance of statistics.
Histogram
A histogram is an approximate representation of the distribution of data. It divides the entire range of values into a series of buckets, and uses simple data to describe each bucket, such as the number of values falling in the bucket. In TiDB, an equal-depth histogram is created for the specific columns of each table. The equal-depth histogram can be used to estimate the interval query.
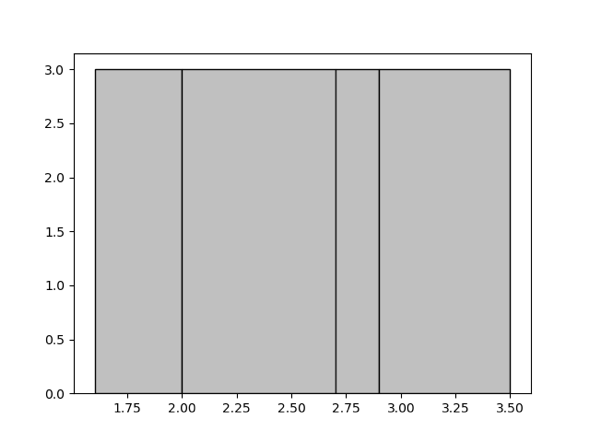
Here "equal-depth" means that the number of values falling into each bucket is as equal as possible. For example, for a given set {1.6, 1.9, 1.9, 2.0, 2.4, 2.6, 2.7, 2.7, 2.8, 2.9, 3.4, 3.5}, you want to generate 4 buckets. The equal-depth histogram is as follows. It contains four buckets [1.6, 1.9], [2.0, 2.6], [2.7, 2.8], [2.9, 3.5]. The bucket depth is 3.
For details about the parameter that determines the upper limit to the number of histogram buckets, refer to Manual Collection. When the number of buckets is larger, the accuracy of the histogram is higher; however, higher accuracy is at the cost of the usage of memory resources. You can adjust this number appropriately according to the actual scenario.
Count-Min Sketch
Count-Min Sketch is a hash structure. When an equivalence query contains a = 1 or IN query (for example, a in (1, 2, 3)), TiDB uses this data structure for estimation.
A hash collision might occur since Count-Min Sketch is a hash structure. In the EXPLAIN statement, if the estimate of the equivalent query deviates greatly from the actual value, it can be considered that a larger value and a smaller value have been hashed together. In this case, you can take one of the following ways to avoid the hash collision:
- Modify the
WITH NUM TOPNparameter. TiDB stores the high-frequency (top x) data separately, with the other data stored in Count-Min Sketch. Therefore, to prevent a larger value and a smaller value from being hashed together, you can increase the value ofWITH NUM TOPN. In TiDB, its default value is 20. The maximum value is 1024. For more information about this parameter, see Full Collection. - Modify two parameters
WITH NUM CMSKETCH DEPTHandWITH NUM CMSKETCH WIDTH. Both affect the number of hash buckets and the collision probability. You can increase the values of the two parameters appropriately according to the actual scenario to reduce the probability of hash collision, but at the cost of higher memory usage of statistics. In TiDB, the default value ofWITH NUM CMSKETCH DEPTHis 5, and the default value ofWITH NUM CMSKETCH WIDTHis 2048. For more information about the two parameters, see Full Collection.
Collect statistics
Manual collection
You can run the ANALYZE statement to collect statistics.
Full collection
You can perform full collection using the following syntax.
To collect statistics of all the tables in
TableNameList:ANALYZE TABLE TableNameList [WITH NUM BUCKETS|TOPN|CMSKETCH DEPTH|CMSKETCH WIDTH|SAMPLES];WITH NUM BUCKETSspecifies the maximum number of buckets in the generated histogram.WITH NUM TOPNspecifies the maximum number of the generatedTOPNs.WITH NUM CMSKETCH DEPTHspecifies the depth of the CM Sketch.WITH NUM CMSKETCH WIDTHspecifies the width of the CM Sketch.WITH NUM SAMPLESspecifies the number of samples.To collect statistics of the index columns on all
IndexNameLists inTableName:ANALYZE TABLE TableName INDEX [IndexNameList] [WITH NUM BUCKETS|TOPN|CMSKETCH DEPTH|CMSKETCH WIDTH|SAMPLES];The statement collects statistics of all index columns when
IndexNameListis empty.To collect statistics of partition in all
PartitionNameLists inTableName:ANALYZE TABLE TableName PARTITION PartitionNameList [WITH NUM BUCKETS|TOPN|CMSKETCH DEPTH|CMSKETCH WIDTH|SAMPLES];To collect statistics of index columns for the partitions in all
PartitionNameLists inTableName:ANALYZE TABLE TableName PARTITION PartitionNameList INDEX [IndexNameList] [WITH NUM BUCKETS|TOPN|CMSKETCH DEPTH|CMSKETCH WIDTH|SAMPLES];
Incremental collection
To improve the speed of analysis after full collection, incremental collection could be used to analyze the newly added sections in monotonically non-decreasing columns such as time columns.
You can perform incremental collection using the following syntax.
To incrementally collect statistics for index columns in all
IndexNameListsinTableName:ANALYZE INCREMENTAL TABLE TableName INDEX [IndexNameList] [WITH NUM BUCKETS|TOPN|CMSKETCH DEPTH|CMSKETCH WIDTH|SAMPLES];To incrementally collect statistics of index columns for partitions in all
PartitionNameListsinTableName:ANALYZE INCREMENTAL TABLE TableName PARTITION PartitionNameList INDEX [IndexNameList] [WITH NUM BUCKETS|TOPN|CMSKETCH DEPTH|CMSKETCH WIDTH|SAMPLES];
Automatic update
For the INSERT, DELETE, or UPDATE statements, TiDB automatically updates the number of rows and updated rows. TiDB persists this information regularly and the update cycle is 20 * stats-lease. The default value of stats-lease is 3s. If you specify the value as 0, it does not update automatically.
Three system variables related to automatic update of statistics are as follows:
| System Variable | Default Value | Description |
|---|---|---|
tidb_auto_analyze_ratio | 0.5 | The threshold value of automatic update |
tidb_auto_analyze_start_time | 00:00 +0000 | The start time in a day when TiDB can perform automatic update |
tidb_auto_analyze_end_time | 23:59 +0000 | The end time in a day when TiDB can perform automatic update |
When the ratio of the number of modified rows to the total number of rows of tbl in a table is greater than tidb_auto_analyze_ratio, and the current time is between tidb_auto_analyze_start_time and tidb_auto_analyze_end_time, TiDB executes the ANALYZE TABLE tbl statement in the background to automatically update the statistics of this table.
Before v4.0,9, when the query is executed, TiDB collects feedback with the probability of feedback-probability and uses it to update the histogram and Count-Min Sketch. Since v4.0.9, this feature is disabled by default, and it is not recommended to enable this feature.
Control ANALYZE concurrency
When you run the ANALYZE statement, you can adjust the concurrency using the following parameters, to control its effect on the system.
tidb_build_stats_concurrency
Currently, when you run the ANALYZE statement, the task is divided into multiple small tasks. Each task only works on one column or index. You can use the tidb_build_stats_concurrency parameter to control the number of simultaneous tasks. The default value is 4.
tidb_distsql_scan_concurrency
When you analyze regular columns, you can use the tidb_distsql_scan_concurrency parameter to control the number of Region to be read at one time. The default value is 15.
tidb_index_serial_scan_concurrency
When you analyze index columns, you can use the tidb_index_serial_scan_concurrency parameter to control the number of Region to be read at one time. The default value is 1.
View ANALYZE state
When executing the ANALYZE statement, you can view the current state of ANALYZE using the following SQL statement:
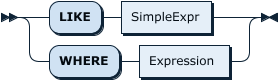
SHOW ANALYZE STATUS [ShowLikeOrWhere]
This statement returns the state of ANALYZE. You can use ShowLikeOrWhere to filter the information you need.
Currently, the SHOW ANALYZE STATUS statement returns the following 7 columns:
| Syntax Element | Description |
|---|---|
| table_schema | The database name |
| table_name | The table name |
| partition_name | The partition name |
| job_info | The task information. The element includes index names when index analysis is performed. |
| row_count | The number of rows that have been analyzed |
| start_time | The time at which the task starts |
| state | The state of a task, including pending, running, finished, and failed |
View statistics
You can view the statistics status using the following statements.
Metadata of tables
You can use the SHOW STATS_META statement to view the total number of rows and the number of updated rows.
The syntax of ShowLikeOrWhereOpt is as follows:
SHOW STATS_META [ShowLikeOrWhere]
Currently, the SHOW STATS_META statement returns the following 6 columns:
| Syntax Element | Description |
|---|---|
db_name | The database name |
table_name | The table name |
partition_name | The partition name |
update_time | The time of the update |
modify_count | The number of modified rows |
row_count | The total number of rows |
Health state of tables
You can use the SHOW STATS_HEALTHY statement to check the health state of tables and roughly estimate the accuracy of the statistics. When modify_count >= row_count, the health state is 0; when modify_count < row_count, the health state is (1 - modify_count/row_count) * 100.
The synopsis of SHOW STATS_HEALTHY is:

and the synopsis of the ShowLikeOrWhereOpt part is:
Currently, the SHOW STATS_HEALTHY statement returns the following 4 columns:
| Syntax Element | Description |
|---|---|
db_name | The database name |
table_name | The table name |
partition_name | The partition name |
healthy | The health state of tables |
Metadata of columns
You can use the SHOW STATS_HISTOGRAMS statement to view the number of different values and the number of NULL in all the columns.
Syntax as follows:
SHOW STATS_HISTOGRAMS [ShowLikeOrWhere]
This statement returns the number of different values and the number of NULL in all the columns. You can use ShowLikeOrWhere to filter the information you need.
Currently, the SHOW STATS_HISTOGRAMS statement returns the following 8 columns:
| Syntax Element | Description |
|---|---|
db_name | The database name |
table_name | The table name |
partition_name | The partition name |
column_name | The column name (when is_index is 0) or the index name (when is_index is 1) |
is_index | Whether it is an index column or not |
update_time | The time of the update |
distinct_count | The number of different values |
null_count | The number of NULL |
avg_col_size | The average length of columns |
Buckets of histogram
You can use the SHOW STATS_BUCKETS statement to view each bucket of the histogram.
The syntax is as follows:
SHOW STATS_BUCKETS [ShowLikeOrWhere]
The diagram is as follows:

This statement returns information about all the buckets. You can use ShowLikeOrWhere to filter the information you need.
Currently, the SHOW STATS_BUCKETS statement returns the following 10 columns:
| Syntax Element | Description |
|---|---|
db_name | The database name |
table_name | The table name |
partition_name | The partition name |
column_name | The column name (when is_index is 0) or the index name (when is_index is 1) |
is_index | Whether it is an index column or not |
bucket_id | The ID of a bucket |
count | The number of all the values that falls on the bucket and the previous buckets |
repeats | The occurrence number of the maximum value |
lower_bound | The minimum value |
upper_bound | The maximum value |
Delete statistics
You can run the DROP STATS statement to delete statistics.
Syntax as follows:
DROP STATS TableName
The statement deletes statistics of all the tables in TableName.
Import and export statistics
Export statistics
The interface to export statistics is as follows:
To obtain the JSON format statistics of the
${table_name}table in the${db_name}database:http://${tidb-server-ip}:${tidb-server-status-port}/stats/dump/${db_name}/${table_name}To obtain the JSON format statistics of the
${table_name}table in the${db_name}database at specific time:http://${tidb-server-ip}:${tidb-server-status-port}/stats/dump/${db_name}/${table_name}/${yyyyMMddHHmmss}
Import statistics
Generally, the imported statistics refer to the JSON file obtained using the export interface.
Syntax:
LOAD STATS 'file_name'
file_name is the file name of the statistics to be imported.