TiDB Dashboard Cluster Diagnostics Page
The cluster diagnostics feature in TiDB Dashboard diagnoses the problems that might exist in a cluster within a specified time range, and summarizes the diagnostic results and the cluster-related load monitoring information into a diagnostic report. This diagnostic report is in the form of a web page. You can browse the page offline and circulate this page link after saving the page from a browser.
Access the page
You can use one of the following methods to access the cluster diagnostics page:
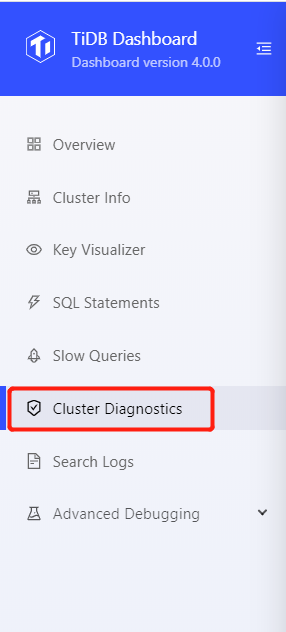
After logging into TiDB Dashboard, click Cluster Diagnostics on the left navigation menu:
Visit
http://127.0.0.1:2379/dashboard/#/diagnosein your browser. Replace127.0.0.1:2379with the actual PD address and port number.
Generate diagnostic report
To diagnose a cluster within a specified time range and check the cluster load, you can take the following steps to generate a diagnostic report:
- Set the Range Start Time, such as
2020-05-21 14:40:00. - Set the Range Duration, such as
10 min. - Click Start.
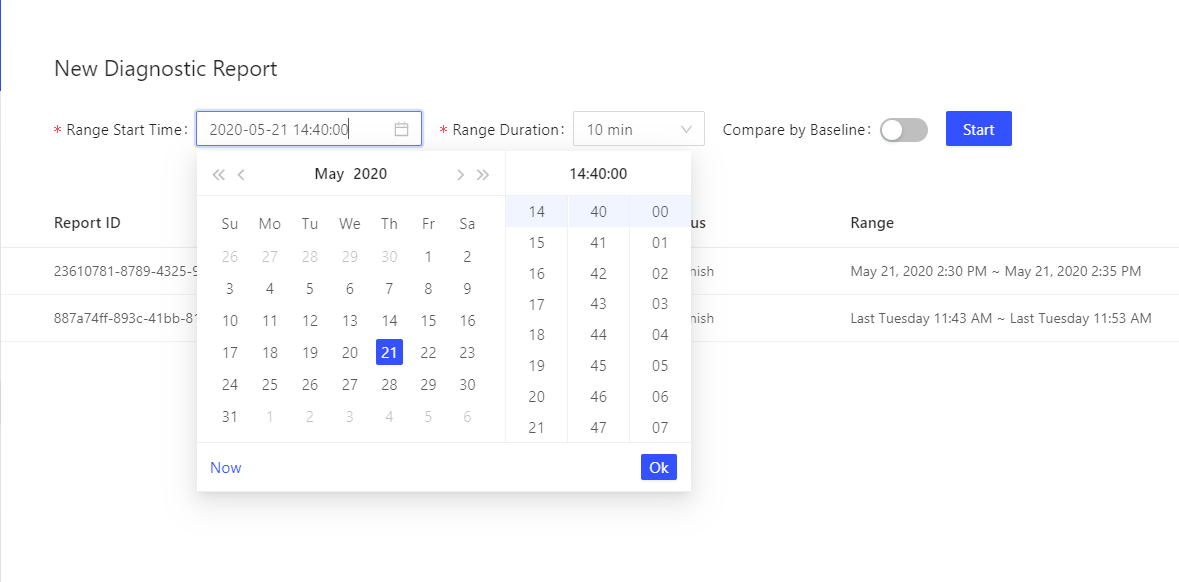
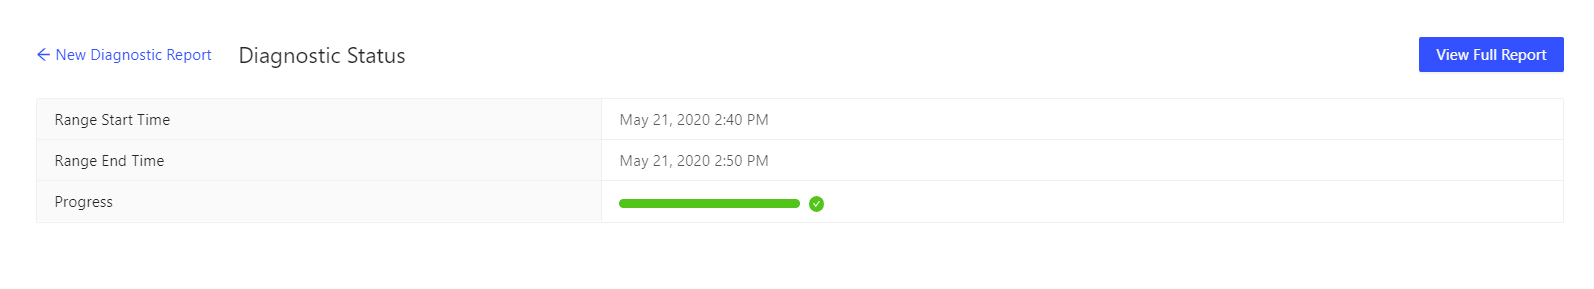
The steps above generate a diagnostic report for the time range from 2020-05-21 14:40:00 to 2020-05-21 14:50:00. After clicking Start, you can see the interface below. Progress is the progress bar of the diagnostic report. After the report is generated, click View Full Report.
Generate comparison report
If a system exception occurs at a certain point, for example, QPS jitter or higher latency, a diagnostic report can be generated. Particularly, this report compares the system in the abnormal time range with the system in the normal time range. For example:
- Abnormal time range:
2020-05-21 14:40:00-2020-05-21 14:45:00. Within this time range, the system is abnormal. - Normal time range:
2020-05-21 14:30:00-2020-05-21 14:35:00. Within this time range, the system is normal.
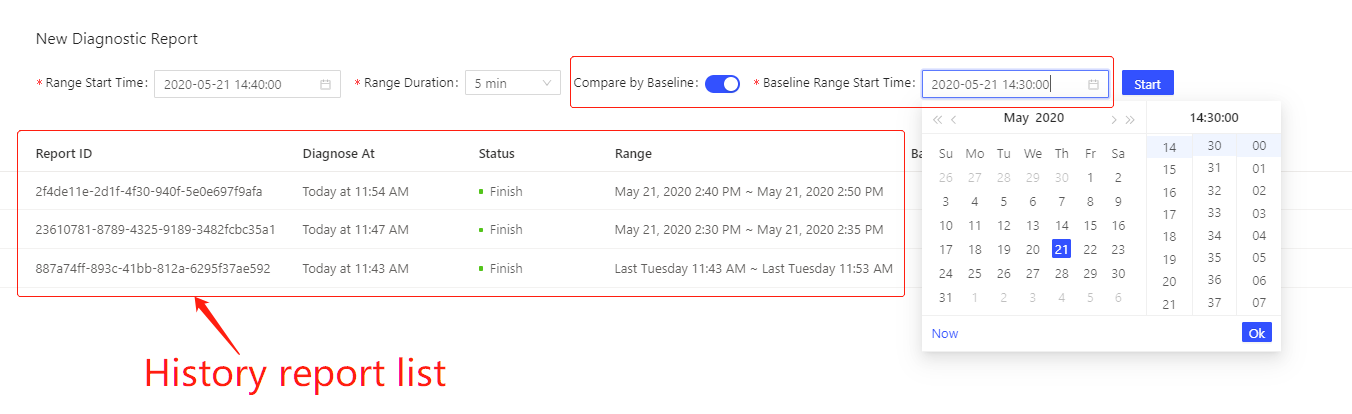
You can take the following steps to generate a comparison report for the two time ranges above:
- Set the Range Start Time, which is the start time of the range in which the system becomes abnormal, such as
2020-05-21 14:40:00. - Set the Range Duration. Generally, this duration is the duration of system anomalies, such as 5 minutes.
- Enable Compare by baseline.
- Set the Baseline Range Start Time, which is the start time of the range (to be compared with) in which the system is normal, such as
2020-05-21 14:30:00. - Click Start.
Then wait for the report to be generated and click View Full Report.
In addition, the historical diagnostic report is displayed in the list on the main page of the diagnostic report. You can click to view these historical reports directly.