Best Practices for TiKV Performance Tuning with Massive Regions
In TiDB, data is split into Regions, each storing data for a specific key range. These Regions are distributed among multiple TiKV instances. As data is written into a cluster, millions of or even tens of millions of Regions are created. Too many Regions on a single TiKV instance can bring a heavy burden to the cluster and affect its performance.
This document introduces the workflow of Raftstore (a core module of TiKV), explains why a massive amount of Regions affect the performance, and offers methods for tuning TiKV performance.
Raftstore workflow
A TiKV instance has multiple Regions on it. The Raftstore module drives the Raft state machine to process Region messages. These messages include processing read or write requests on Regions, persisting or replicating Raft logs, and processing Raft heartbeats. However, an increasing number of Regions can affect performance of the whole cluster. To understand this, it is necessary to learn the workflow of Raftstore shown as follows:
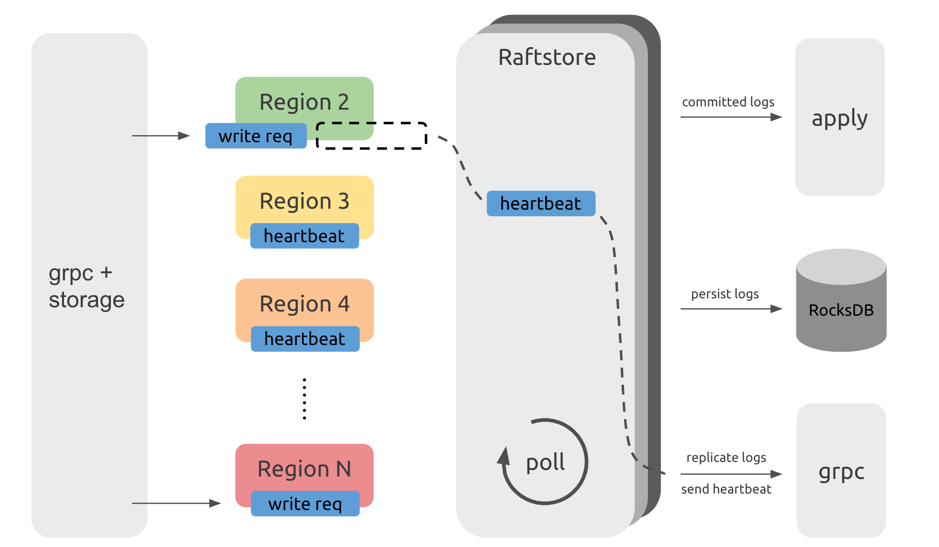
From the above diagram, you can see that requests from the TiDB servers, after passing through the gRPC and storage modules, become read and write messages of KV (key-value), and are sent to the corresponding Regions. These messages are not immediately processed but are temporarily stored. Raftstore polls to check whether each Region has messages to process. If a Region has messages to process, Raftstore drives the Raft state machine of this Region to process these messages and perform subsequent operations according to the state changes of these messages. For example, when write requests come in, the Raft state machine stores logs into disk and sends logs to other Region replicas; when the heartbeat interval is reached, the Raft state machine sends heartbeat information to other Region replicas.
Performance problem
From the Raftstore workflow diagram, messages in each Region are processed one by one. When a large number of Regions exist, it takes Raftstore some time to process the heartbeats of these Regions, which can cause some delay. As a result, some read and write requests are not processed in time. If read and write pressure is high, the CPU usage of the Raftstore thread might easily become the bottleneck, which further increases the delay and affects the performance.
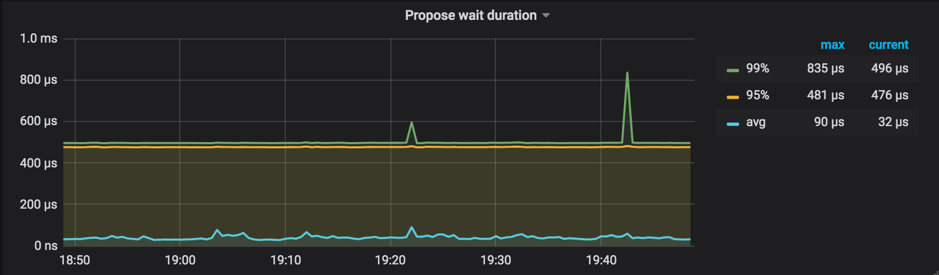
Generally, if the CPU usage of the loaded Raftstore reaches 85% or higher, Raftstore goes into a busy state and becomes the bottleneck. At the same time, propose wait duration can be as high as hundreds of milliseconds.
Performance monitoring
You can check the following monitoring metrics in Grafana's TiKV panel:
Raft store CPUin the Thread-CPU panelReference value: lower than
raftstore.store-pool-size * 85%. TiDB v2.1 does not have theraftstore.store-pool-sizeconfiguration item, so you can take this item's value as1in v2.1 versions.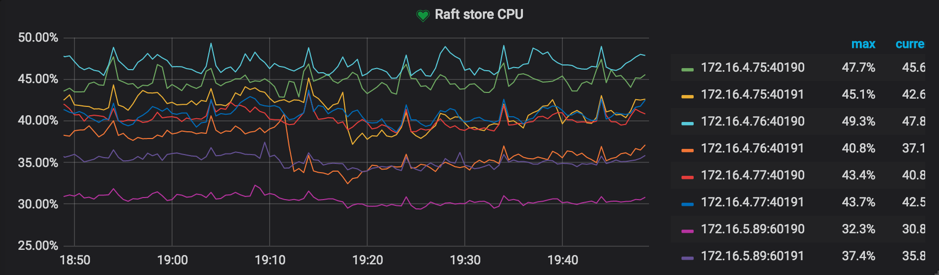
Propose wait durationin the Raft Propose panelPropose wait durationis the delay between the time a request is sent to Raftstore and the time Raftstore actually starts processing the request. Long delay means that Raftstore is busy, or that processing the append log is time-consuming, making Raftstore unable to process the request in time.Reference value: lower than 50~100 ms according to the cluster size
Performance tuning method
After finding out the cause of a performance problem, try to solve it from the following two aspects:
- Reduce the number of Regions on a single TiKV instance
- Reduce the number of messages for a single Region
In TiDB v2.1, the Raftstore is single-threaded. Therefore, when the number of Regions exceeds a hundred thousand, the CPU usage of Raftstore thread gradually becomes the bottleneck.
Method 1: Increase the number of TiKV instances
If I/O resources and CPU resources are sufficient, you can deploy multiple TiKV instances on a single machine to reduce the number of Regions on a single TiKV instance; or you can increase the number of machines in the TiKV cluster.
Method 2: Enable Region Merge
You can also reduce the number of Regions by enabling Region Merge. Contrary to Region Split, Region Merge is the process of merging adjacent small Regions through scheduling. After dropping data or executing the Drop Table or Truncate Table statement, you can merge small Regions or even empty Regions to reduce resource consumption.
Enable Region Merge by configuring the following parameters:
>> pd-ctl config set max-merge-region-size 20
>> pd-ctl config set max-merge-region-keys 200000
>> pd-ctl config set merge-schedule-limit 8
Refer to Region Merge for more details.
The default configuration of the Region Merge parameters is rather conservative. You can speed up the Region Merge process by referring to the method provided in PD Scheduling Best Practices.
Method 3: Adjust raft-base-tick-interval
In addition to reducing the number of Regions, you can also reduce pressure on Raftstore by reducing the number of messages for each Region within a unit of time. For example, you can properly increase the value of the raft-base-tick-interval configuration item:
[raftstore]
raft-base-tick-interval = "2s"
In the above configuration, raft-base-tick-interval is the time interval at which Raftstore drives the Raft state machine of each Region, which means at this time interval, Raftstore sends a tick message to the Raft state machine. Increasing this interval can effectively reduce the number of messages from Raftstore.
Note that this interval between tick messages also determines the intervals between election timeout and heartbeat. See the following example:
raft-election-timeout = raft-base-tick-interval * raft-election-timeout-ticks
raft-heartbeat-interval = raft-base-tick-interval * raft-heartbeat-ticks
If Region followers have not received the heartbeat from the leader within the raft-election-timeout interval, these followers determine that the leader has failed and start a new election. raft-heartbeat-interval is the interval at which a leader sends a heartbeat to followers. Therefore, increasing the value of raft-base-tick-interval can reduce the number of network messages sent from Raft state machines but also makes it longer for Raft state machines to detect the leader failure.
Other problems and solutions
This section describes some other problems and solutions.
Switching PD Leader is slow
PD needs to persist Region Meta information on etcd to ensure that PD can quickly resume to provide Region routing services after switching the PD Leader node. As the number of Regions increases, the performance problem of etcd appears, making it slower for PD to get Region Meta information from etcd when PD is switching the Leader. With millions of Regions, it might take more than ten seconds or even tens of seconds to get the meta information from etcd.
To address this problem, use-region-storage is enabled by default in PD in TiDB v3.0. With this feature enabled, PD stores Region Meta information on local LevelDB and synchronizes the information among PD nodes through other mechanisms.
PD routing information is not updated in time
In TiKV, pd-worker regularly reports Region Meta information to PD. When TiKV is restarted or switches the Region leader, PD needs to recalculate Region's approximate size / keys through statistics. Therefore, with a large number of Regions, the single-threaded pd-worker might become the bottleneck, causing tasks to be piled up and not processed in time. In this situation, PD cannot obtain certain Region Meta information in time so that the routing information is not updated in time. This problem does not affect the actual reads and writes, but might cause inaccurate PD scheduling and require several round trips when TiDB updates Region cache.
You can check Worker pending tasks under Task in the TiKV Grafana panel to determine whether pd-worker has tasks piled up. Generally, pending tasks should be kept at a relatively low value.
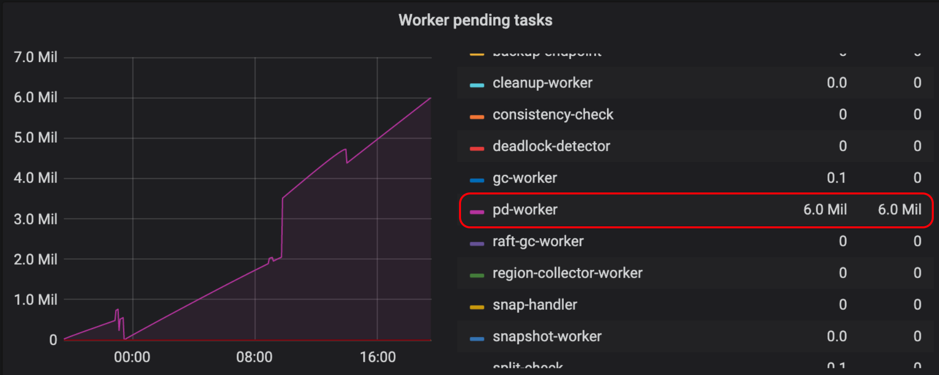
Currently, pd-worker is optimized for better efficiency in #5620 on TiKV master, which is applied since v3.0.5. If you encounter a similar problem, it is recommended to upgrade to v3.0.5 or later versions.
Prometheus is slow to query metrics
In a large-scale cluster, as the number of TiKV instances increases, Prometheus has greater pressure to query metrics, making it slower for Grafana to display these metrics. To ease this problem, metrics pre-calculation is configured in v3.0.