Key Monitoring Metrics of TiKV
If you use TiDB Ansible to deploy the TiDB cluster, the monitoring system is deployed at the same time. For more information, see Overview of the Monitoring Framework.
The Grafana dashboard is divided into a series of sub dashboards which include Overview, PD, TiDB, TiKV, Node_exporter, Disk Performance, and so on. A lot of metrics are there to help you diagnose.
You can get an overview of the component TiKV status from the TiKV dashboard, where the key metrics are displayed. This document provides a detailed description of these key metrics.
Key metrics description
To understand the key metrics displayed on the Overview dashboard, check the following table:
| Service | Panel name | Description | Normal range |
|---|---|---|---|
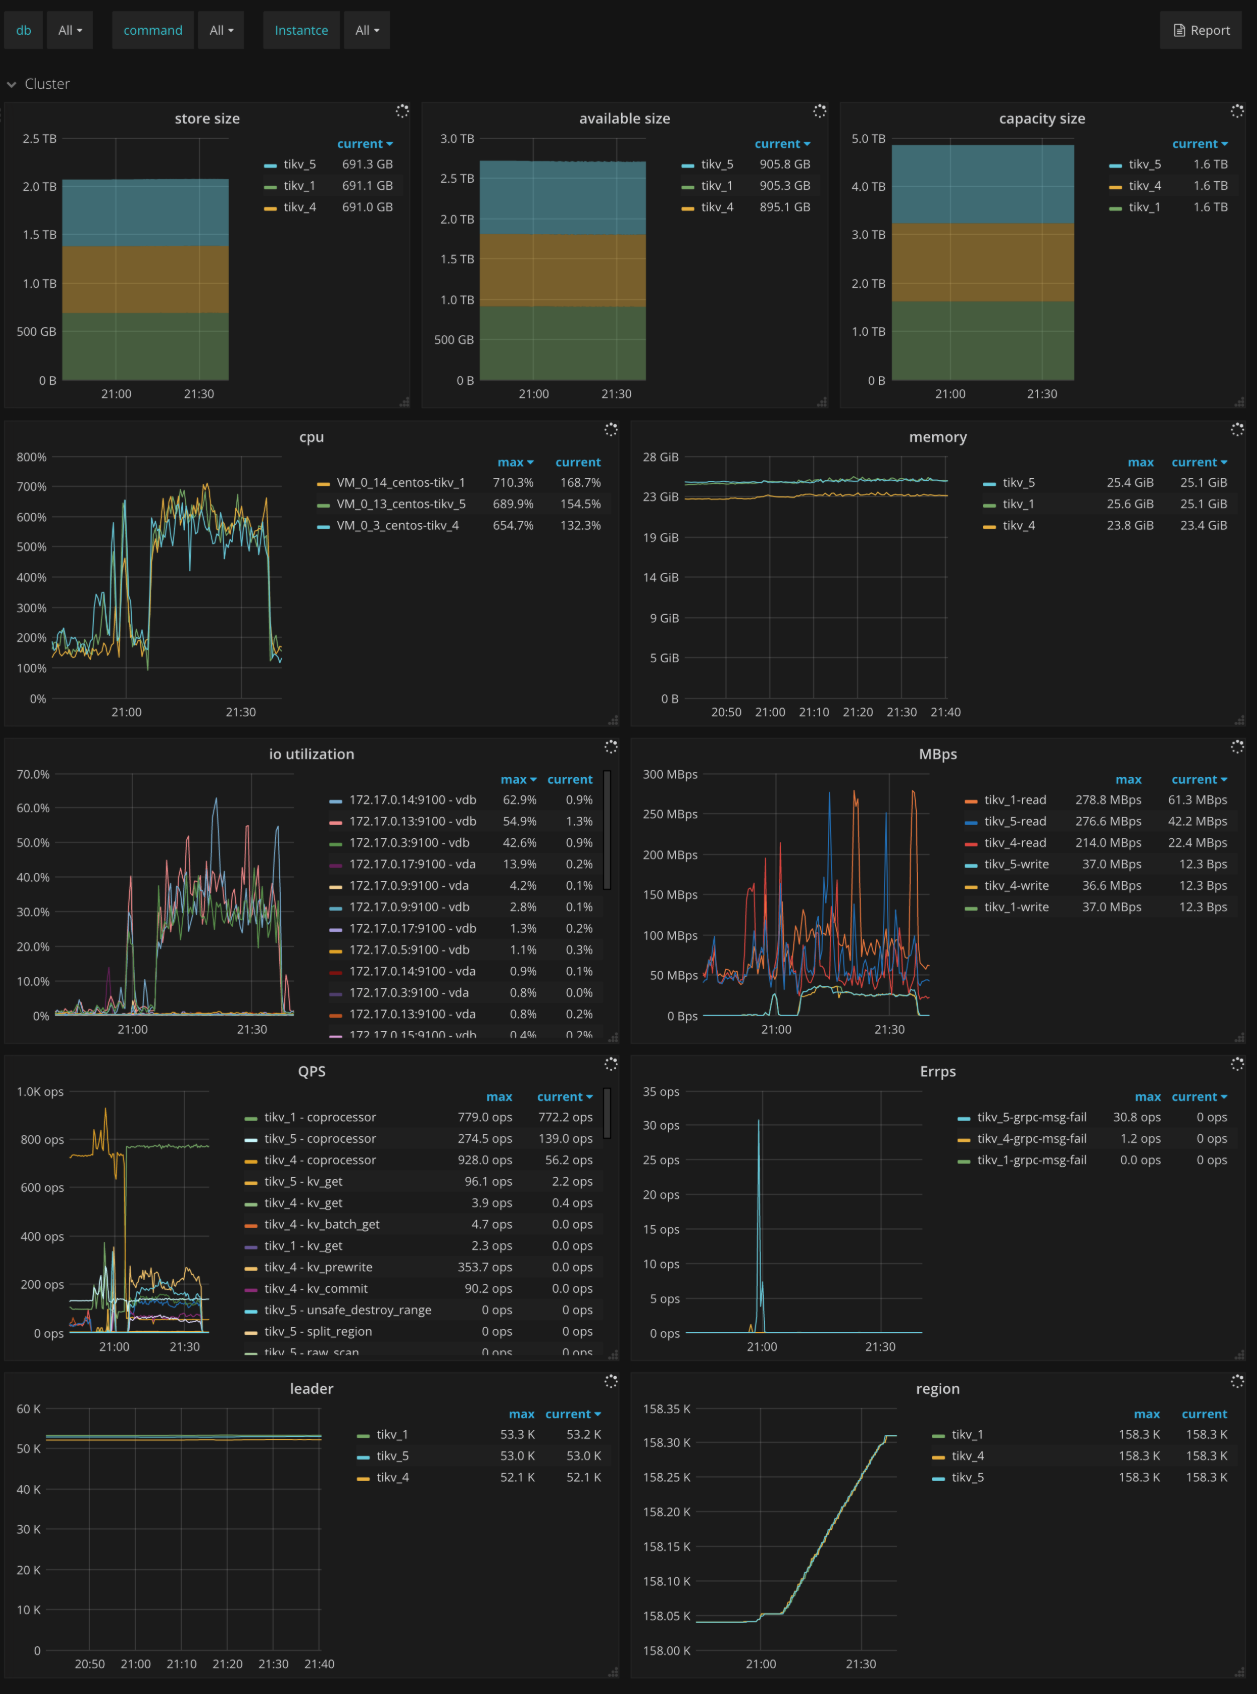
| Cluster | Store size | The storage size of each TiKV instance | |
| Cluster | Available size | The available capacity size of each TiKV instance | |
| Cluster | Capacity size | The capacity size of each TiKV instance | |
| Cluster | CPU | The CPU usage of each TiKV instance | |
| Cluster | Memory | The memory usage of each TiKV instance | |
| Cluster | IO utilization | The I/O utilization of each TiKV instance | |
| Cluster | MBps | The total bytes and keys of read and write on each TiKV instance | |
| Cluster | QPS | The QPS of different kinds of commands in each TiKV instance | |
| Cluster | Errps | The total number of the gRPC message failures | |
| Cluster | Leader | The number of leaders on each TiKV instance | |
| Cluster | Region | The number of Regions on each TiKV instance | |
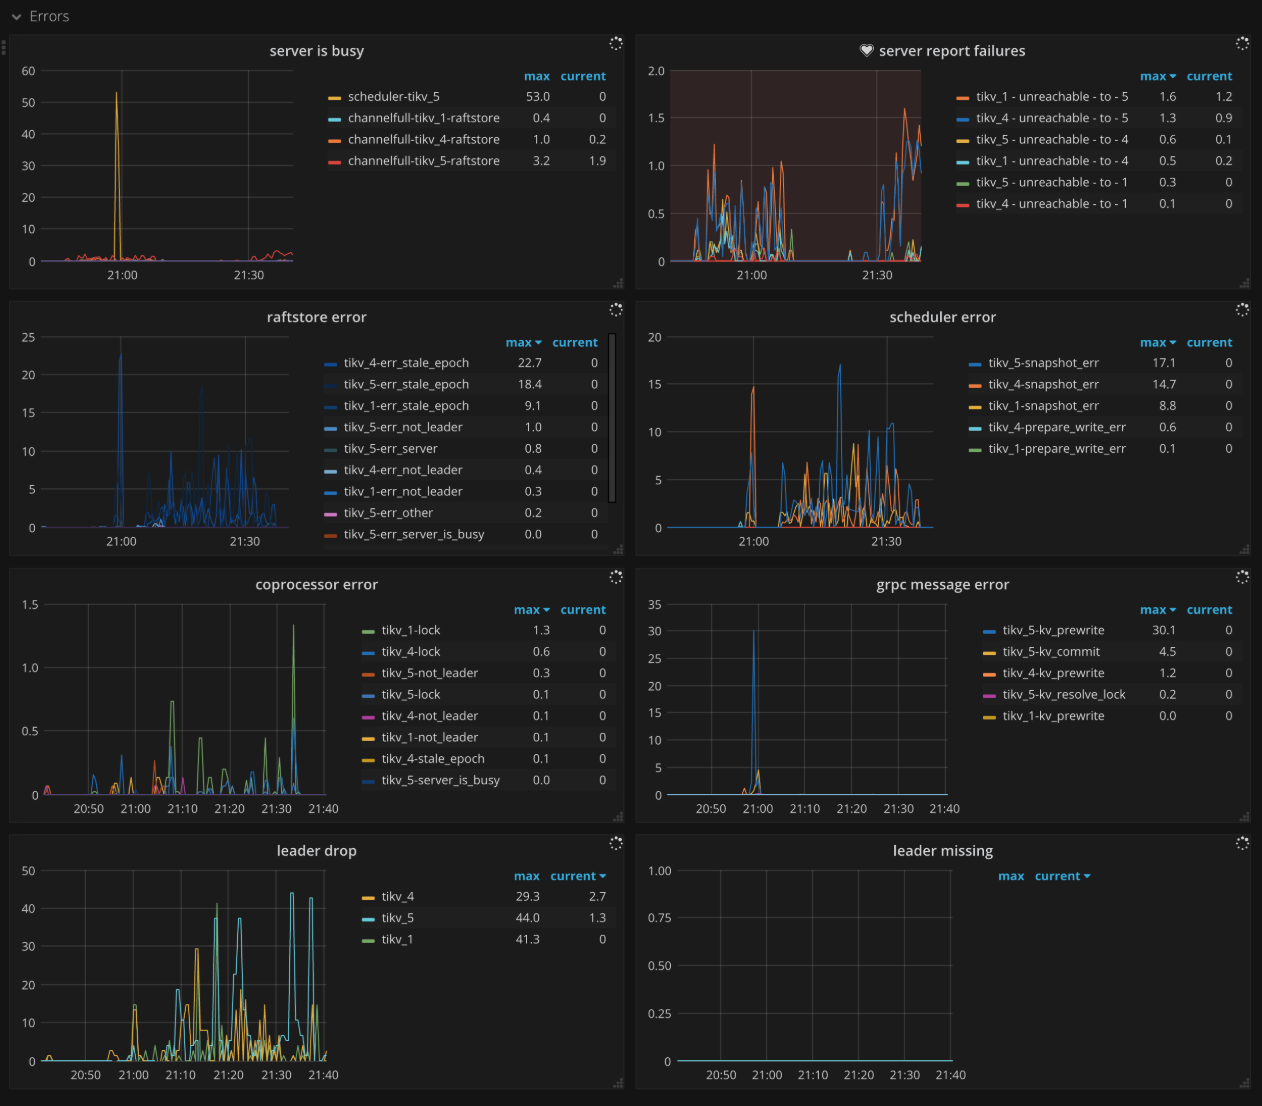
| Errors | Server is busy | It contains some kinds of events such as write stall, channel full, scheduler busy, and coprocessor full, which will make the TiKV instance unavailable temporarily. | |
| Errors | Server report failures | The total number of reporting failure messages | It should be 0 in normal case. |
| Errors | Raftstore error | The number of different raftstore errors on each TiKV instance | |
| Errors | Scheduler error | The number of different scheduler errors on each TiKV instance | |
| Errors | Coprocessor error | The number of different coprocessor errors on each TiKV instance | |
| Errors | gRPC message error | The number of different gRPC message errors on each TiKV instance | |
| Errors | Leader drop | The count of dropped leader in each TiKV instance | |
| Errors | Leader missing | The count of missing leader in each TiKV instance | |
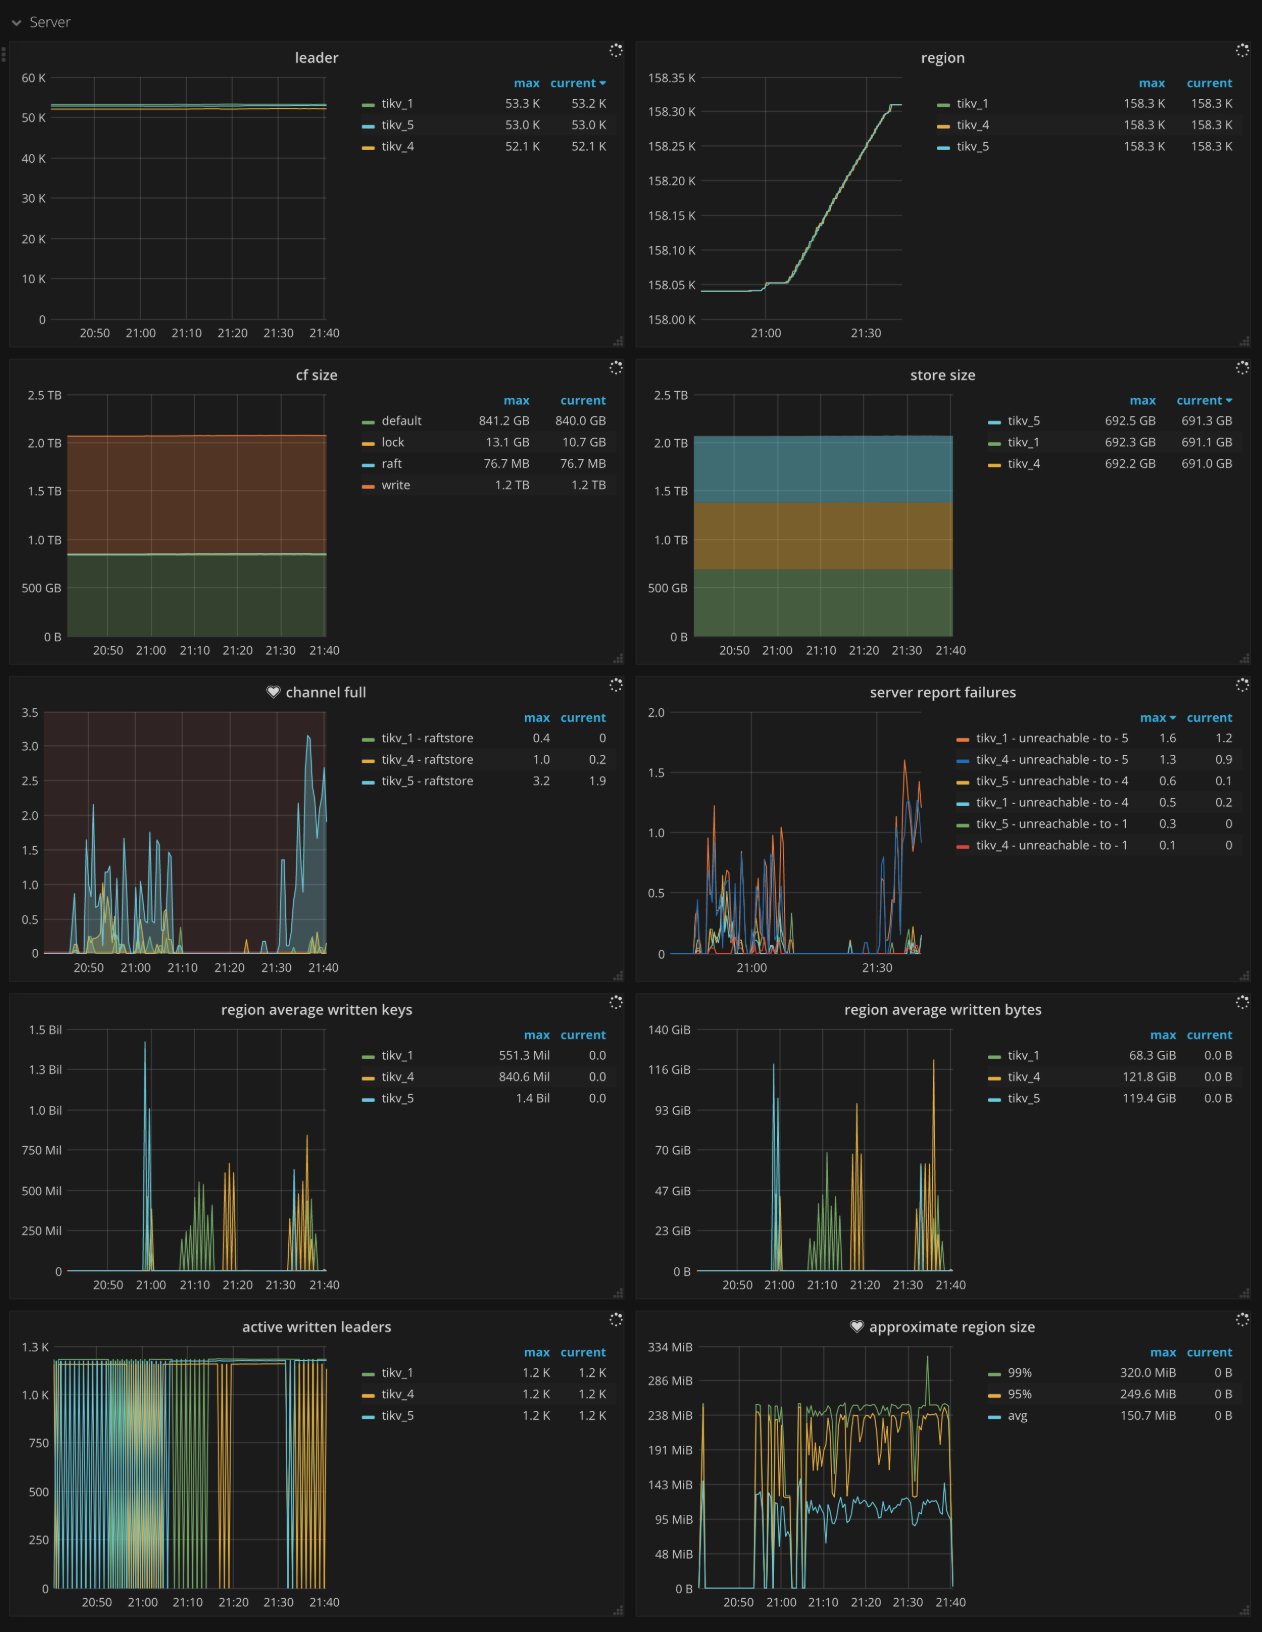
| Server | Leader | The number of leaders on each TiKV instance | |
| Server | Region | The number of Regions on each TiKV instance | |
| Server | CF size | The total size of each column family | |
| Server | Store size | The storage size of each TiKV instance | |
| Server | Channel full | The total number of channel full errors on each TiKV instance | It should be 0 in normal case. |
| Server | Server report failures | The total number of reporting failure messages | |
| Server | Region average written keys | The average rate of writing keys to Regions on each TiKV instance | |
| Server | Region average written bytes | The average rate of writing bytes to Regions on each TiKV instance | |
| Server | Active written leaders | The number of active leaders on each TiKV instance | |
| Server | Approximate Region size | The approximate Region size | |
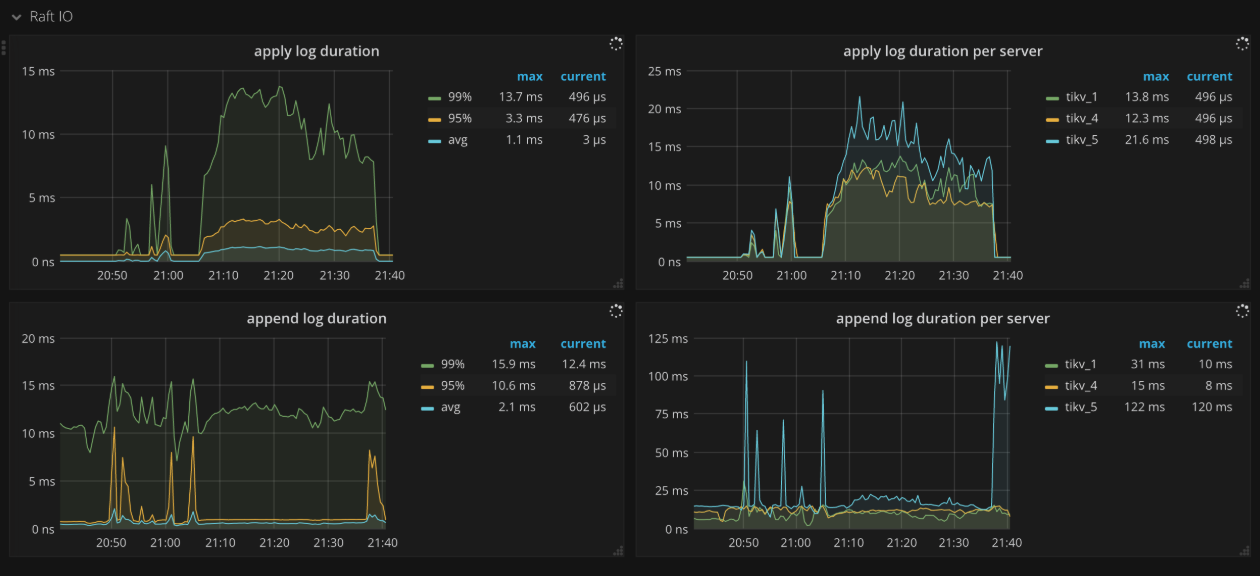
| Raft IO | Apply log duration | The time consumed when Raft applies log | |
| Raft IO | Apply log duration per server | The time consumed when Raft applies log on each TiKV instance | |
| Raft IO | Append log duration | The time consumed when Raft appends log | |
| Raft IO | Append log duration per server | The time consumed when Raft appends log on each TiKV instance | |
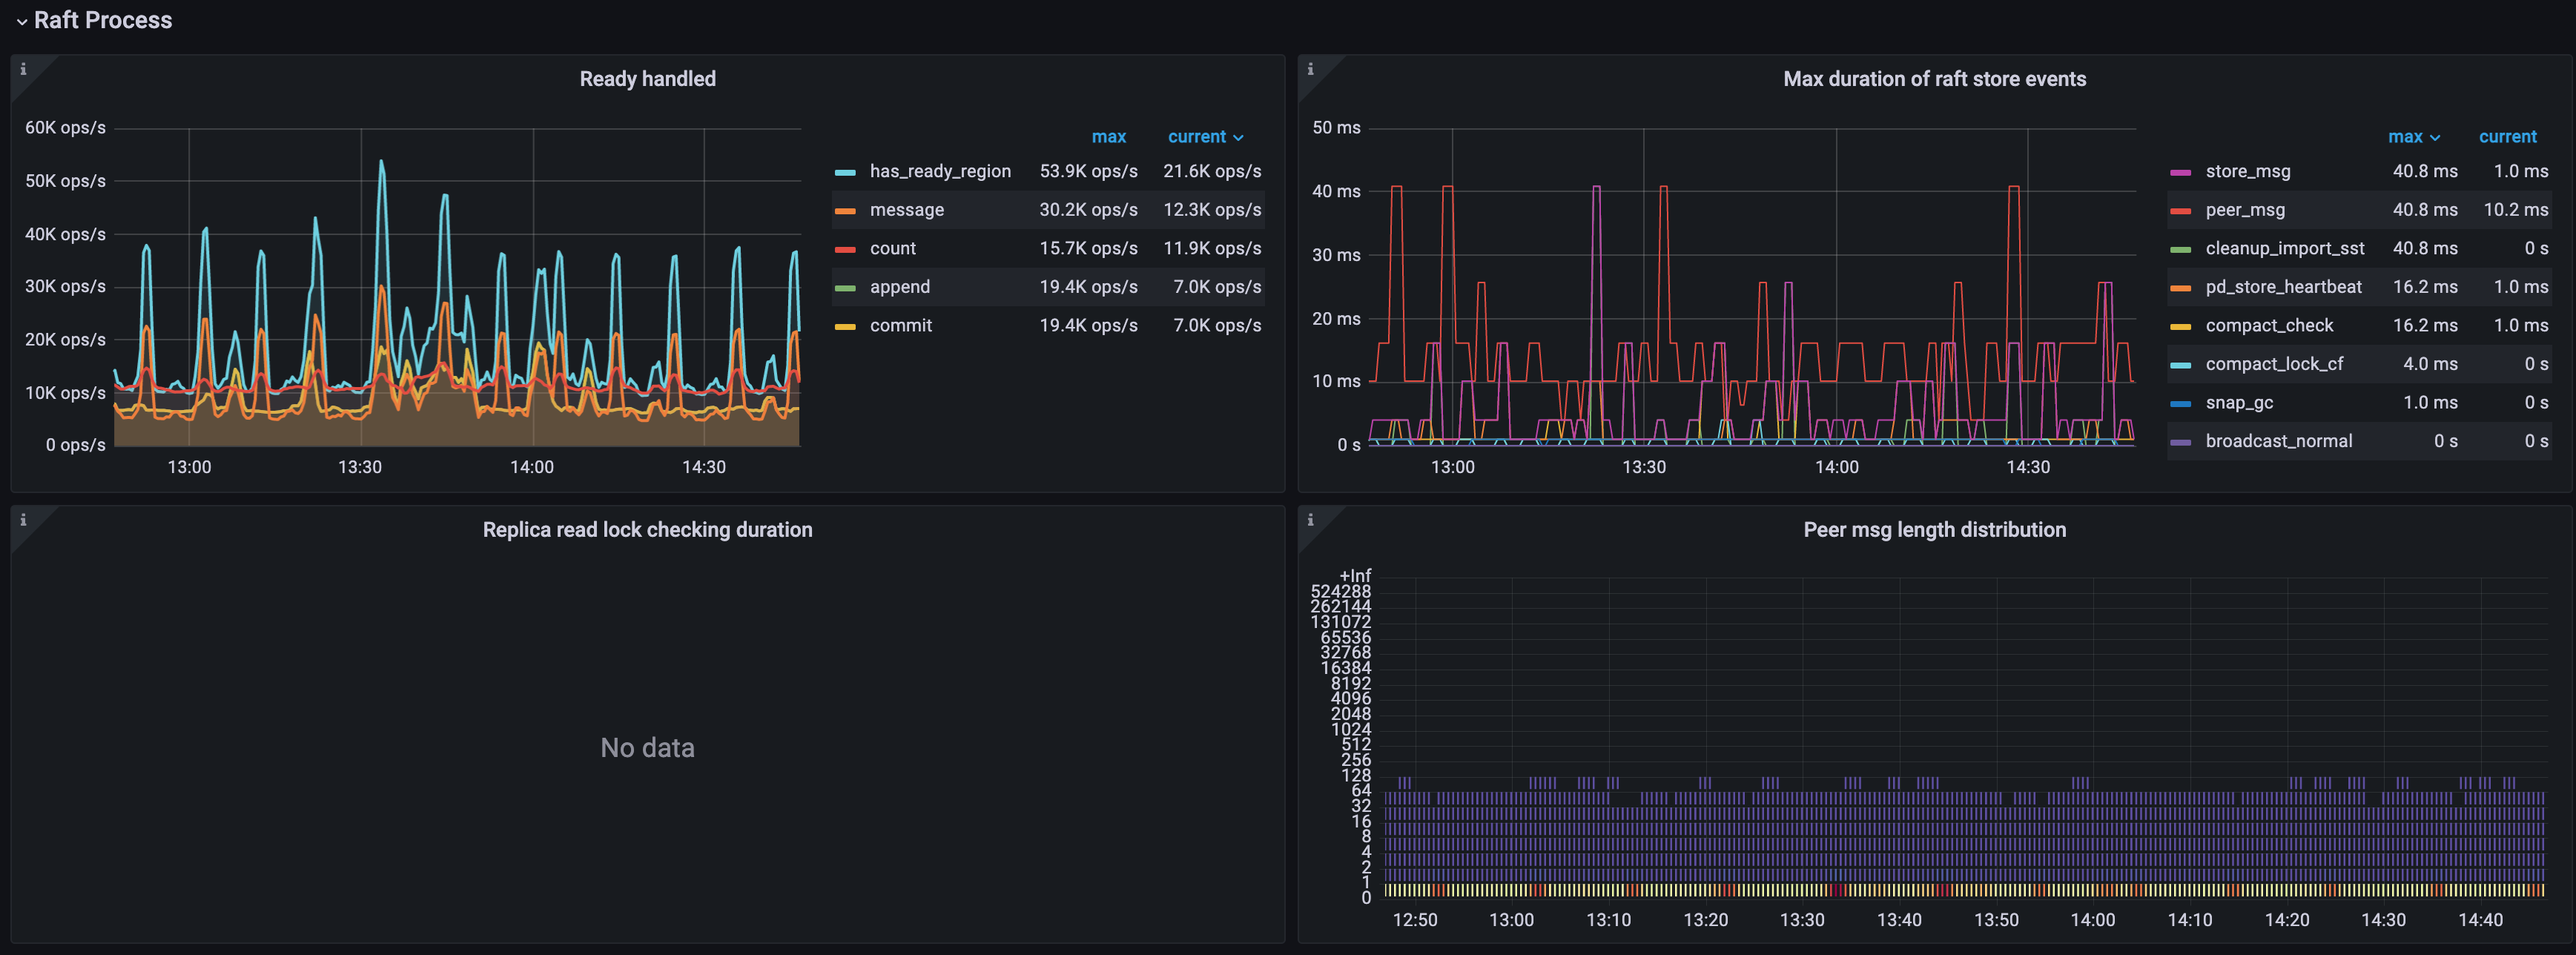
| Raft process | Ready handled | The count of different ready type of Raft | |
| Raft process | Process ready duration per server | The time consumed when the peer processes ready in Raft | It should be less than 2s in .9999. |
| Raft process | Process tick duration per server | The time consumed when the peer processes tick in Raft | |
| Raft process | 0.99 Duration of raftstore events | The time consumed by raftstore events in .99 | |
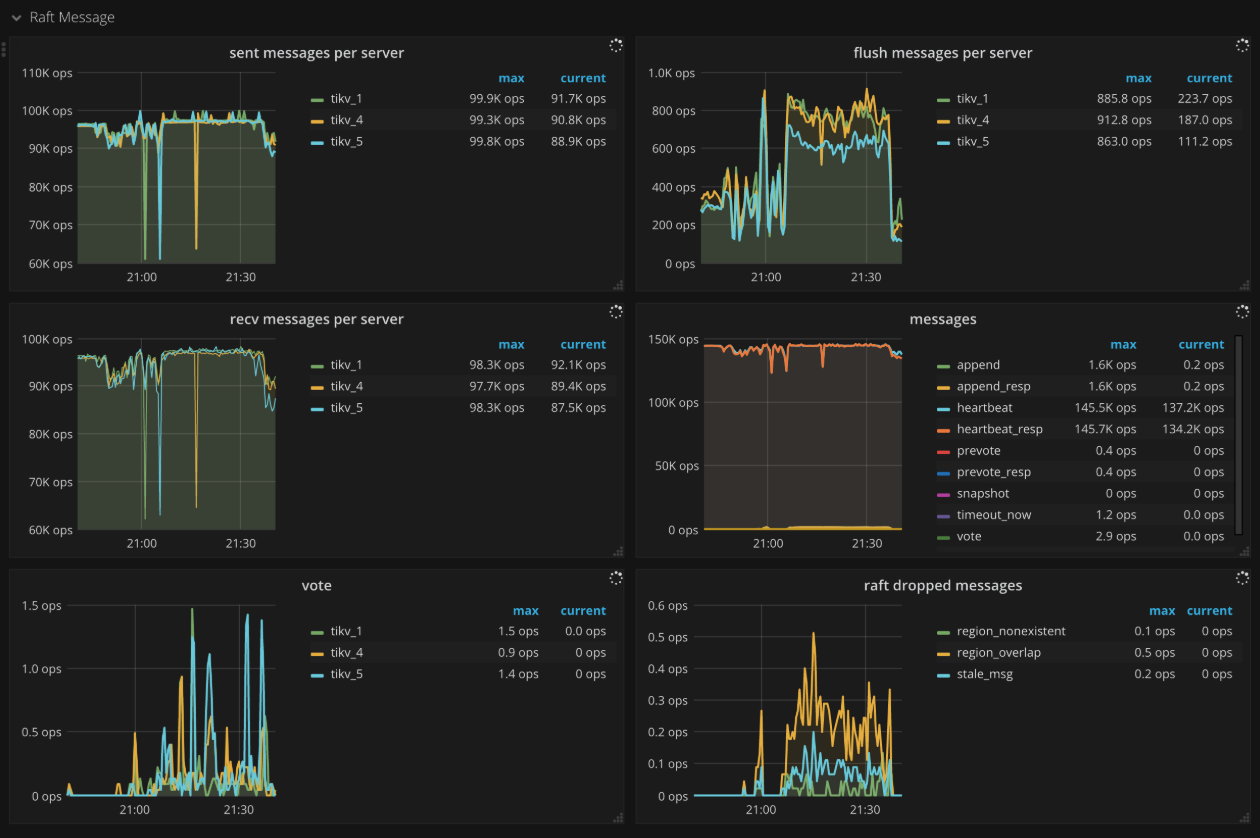
| Raft message | Sent messages per server | The number of Raft messages sent by each TiKV instance | |
| Raft message | Flush messages per server | The number of Raft messages flushed by each TiKV instance | |
| Raft message | Receive messages per server | The number of Raft messages received by each TiKV instance | |
| Raft message | Messages | The number of different types of Raft messages that are sent | |
| Raft message | Vote | The total number of vote messages that are sent in Raft | |
| Raft message | Raft dropped messages | The number of different types of Raft messages that are dropped | |
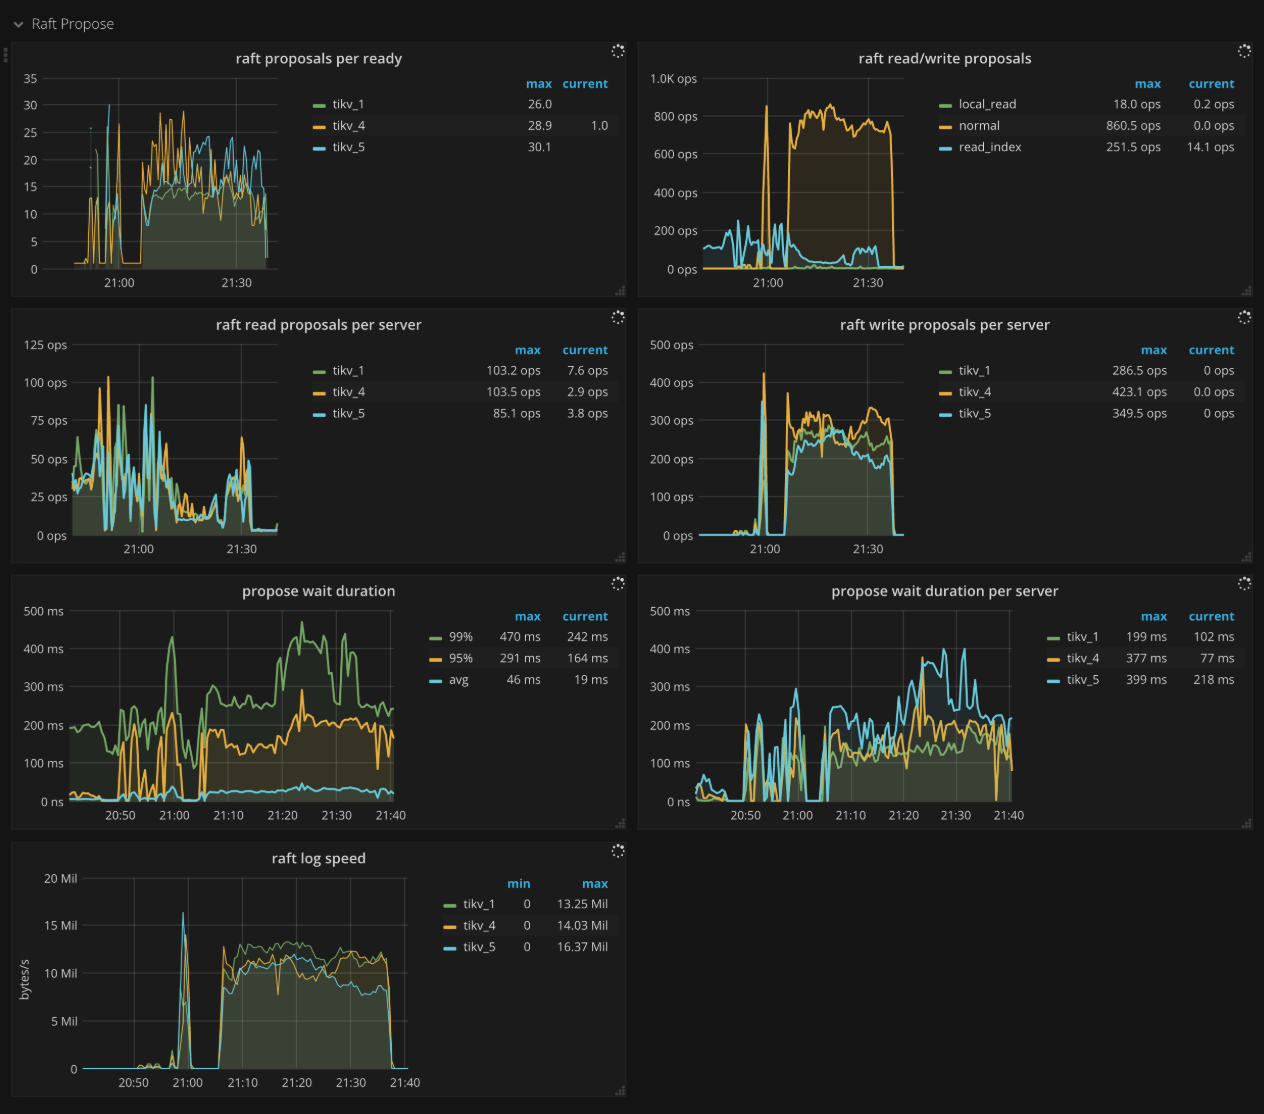
| Raft propose | Raft proposals per ready | The proposal count of all Regions in a mio tick | |
| Raft propose | Raft read/write proposals | The total number of different kinds of proposals | |
| Raft propose | Raft read proposals per server | The number of read proposals which are made by each TiKV instance | |
| Raft propose | Raft write proposals per server | The number of write proposals which are made by each TiKV instance | |
| Raft propose | Propose wait duration | The wait time of each proposal | |
| Raft propose | Propose wait duration per server | The wait time of each proposal in each TiKV instance | |
| Raft propose | Raft log speed | The speed that peers propose log | |
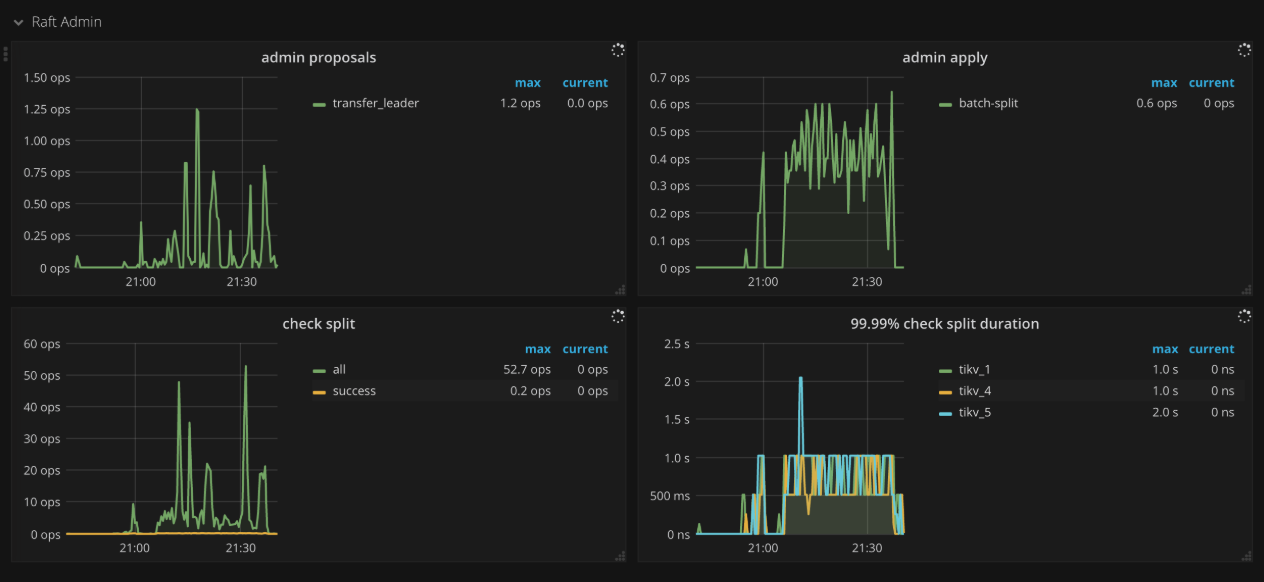
| Raft admin | Admin proposals | The number of admin proposals | |
| Raft admin | Admin apply | The number of the processed apply command | |
| Raft admin | Check split | The number of raftstore split check | |
| Raft admin | 99.99% Check split duration | The time consumed when running split check in .9999 | |
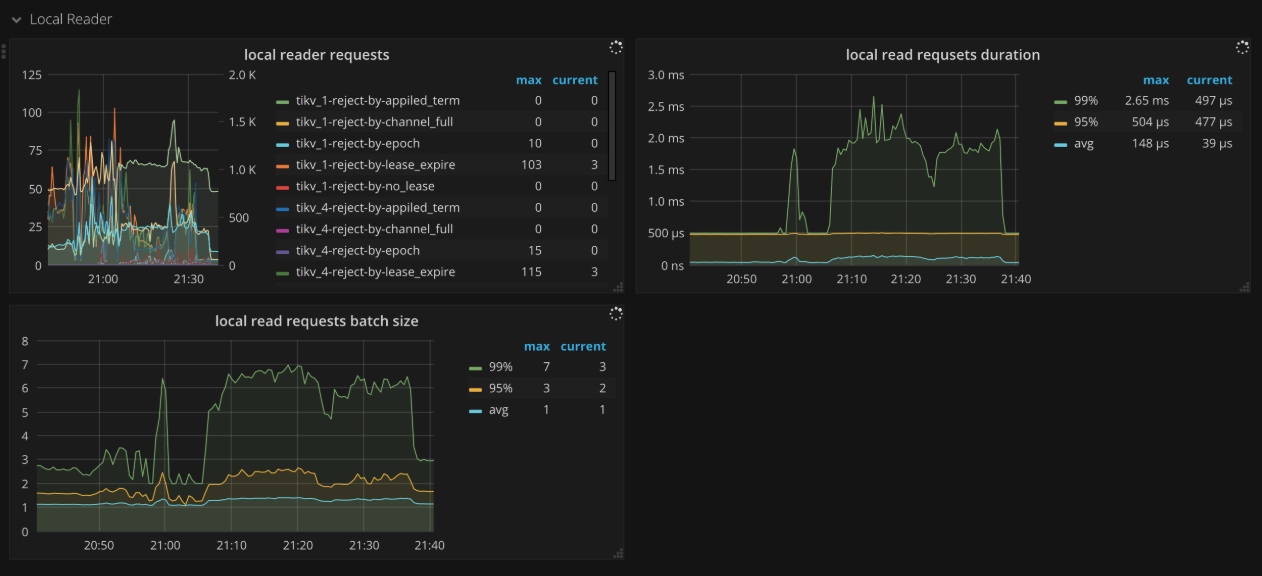
| Local reader | Local reader requests | The number of rejections from the local read thread and The number of total requests | |
| Local reader | Local read requests duration | The wait time of local read requests | |
| Local reader | Local read requests batch size | The batch size of local read requests | |
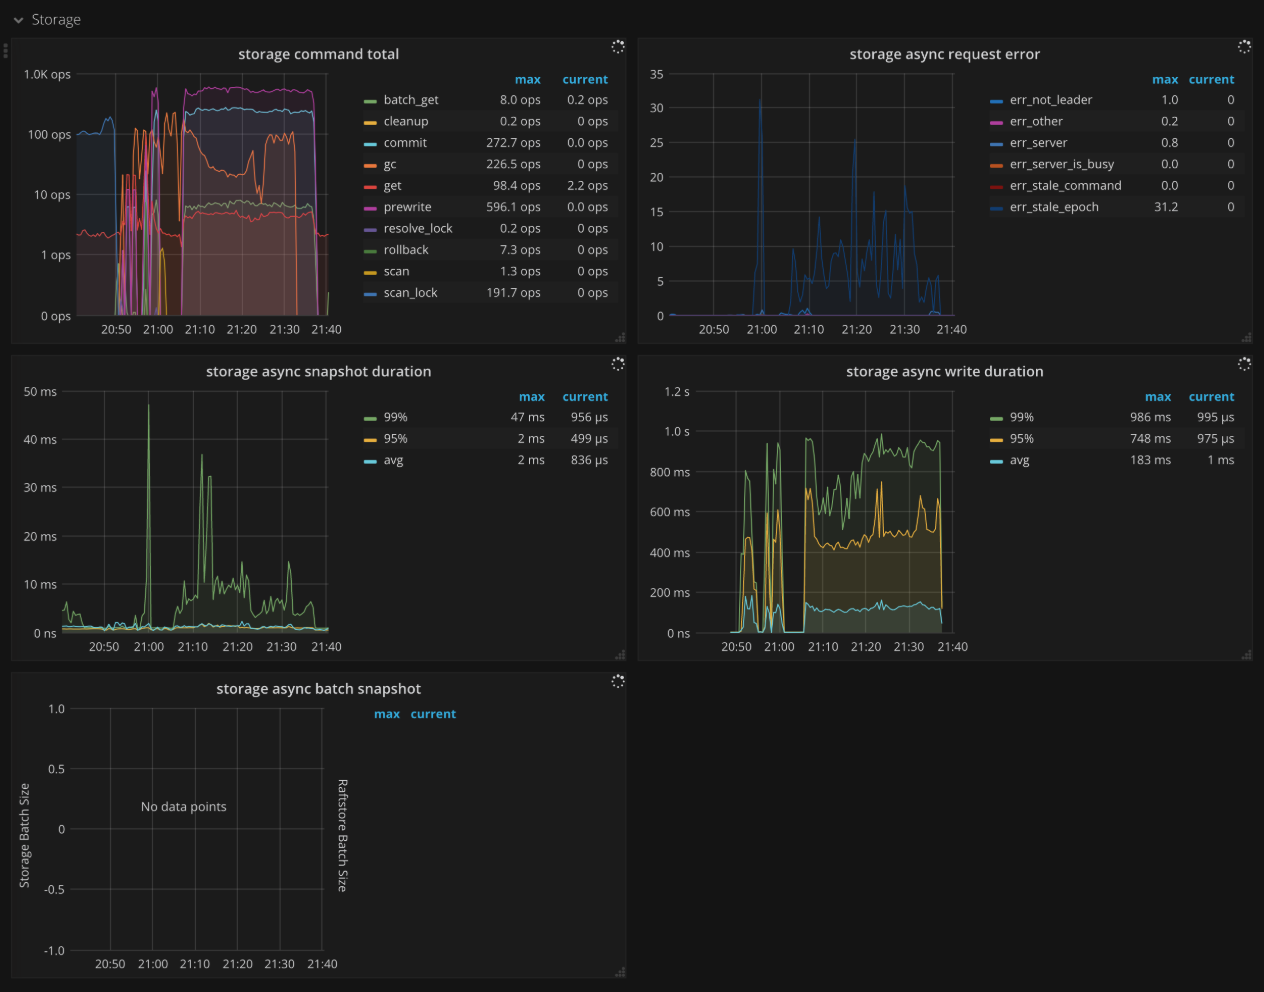
| Storage | Storage command total | The total count of different kinds of commands received | |
| Storage | Storage async request error | The total number of engine asynchronous request errors | |
| Storage | Storage async snapshot duration | The time consumed by processing asynchronous snapshot requests | It should be less than 1s in .99. |
| Storage | Storage async write duration | The time consumed by processing asynchronous write requests | It should be less than 1s in .99. |
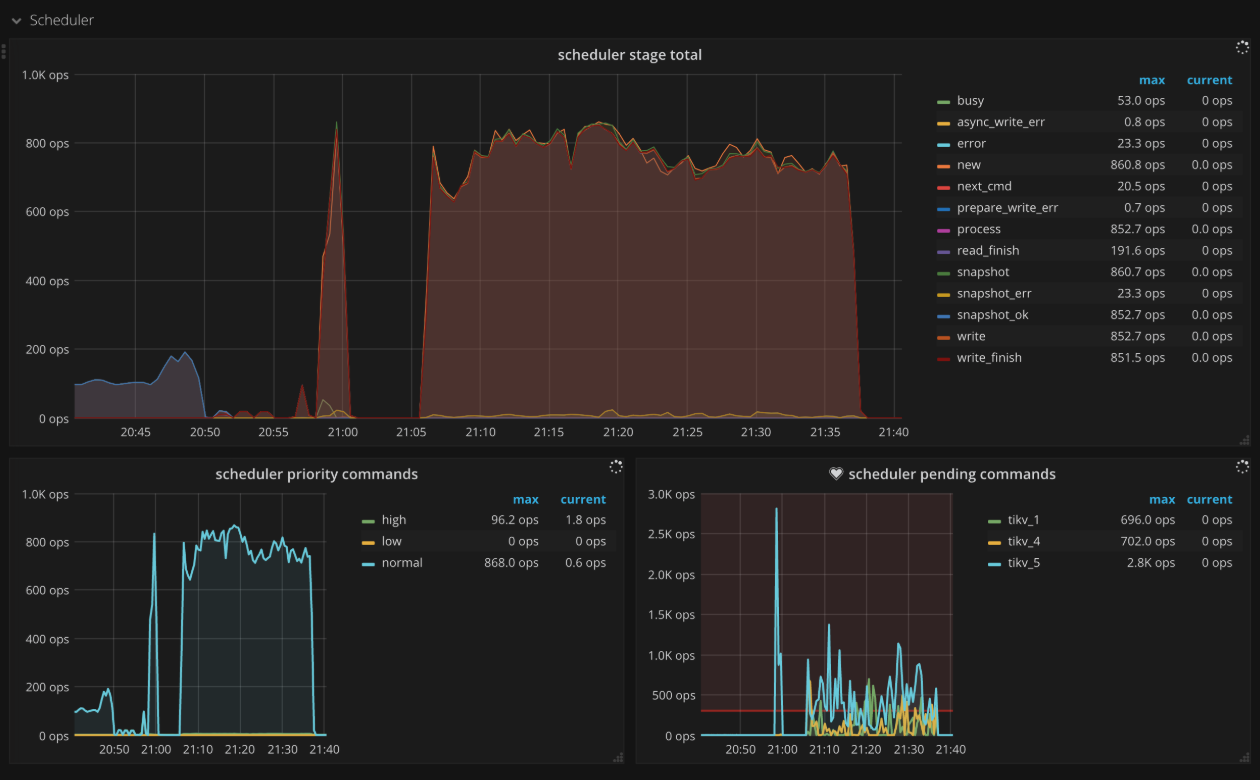
| Scheduler | Scheduler stage total | The total number of commands on each stage | There should not be lots of errors in a short time. |
| Scheduler | Scheduler priority commands | The count of different priority commands | |
| Scheduler | Scheduler pending commands | The count of pending commands on each TiKV instance | |
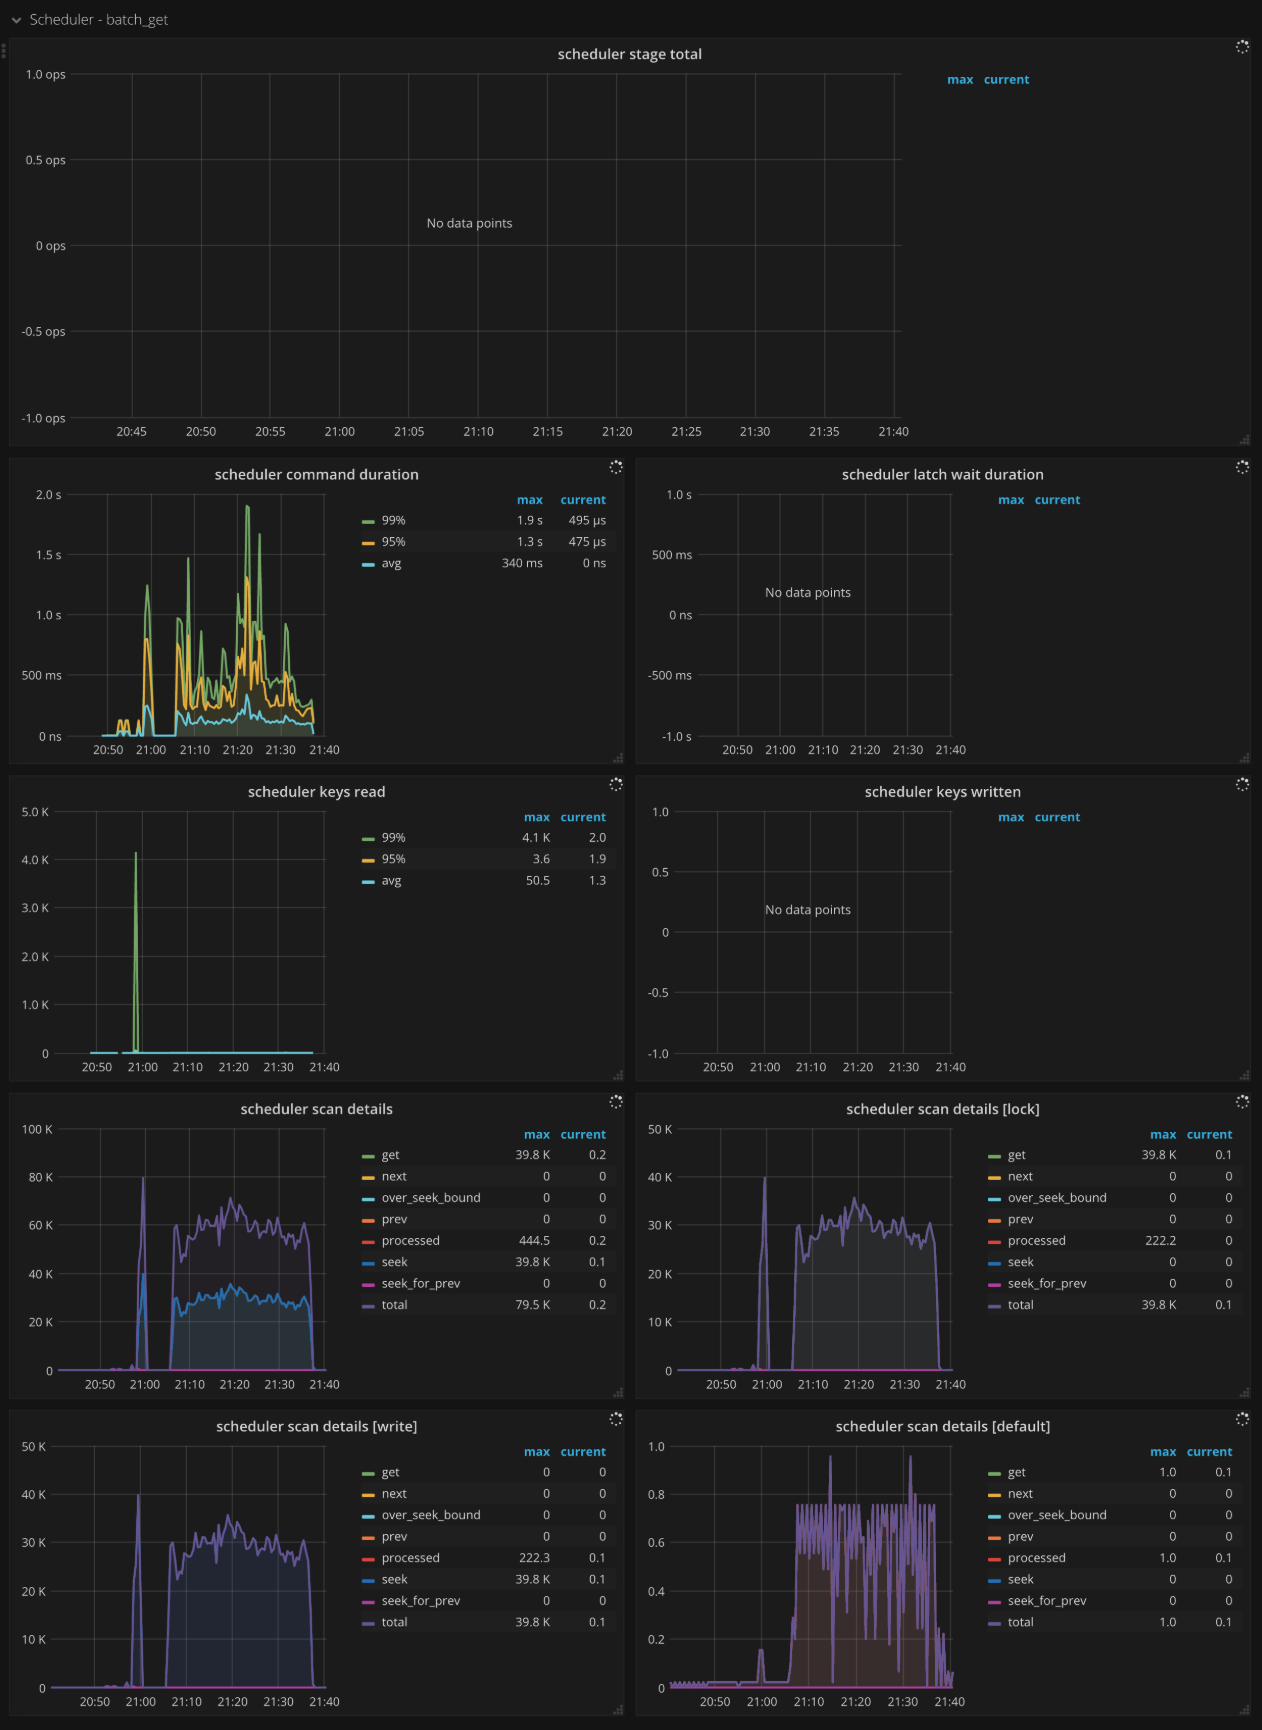
| Scheduler - batch_get | Scheduler stage total | The total number of commands on each stage in batch_get command | There should not be lots of errors in a short time. |
| Scheduler - batch_get | Scheduler command duration | The time consumed when executing batch_get command | It should be less than 1s. |
| Scheduler - batch_get | Scheduler latch wait duration | The time which is caused by latch wait in batch_get command | It should be less than 1s. |
| Scheduler - batch_get | Scheduler keys read | The count of keys read by a batch_get command | |
| Scheduler - batch_get | Scheduler keys written | The count of keys written by a batch_get command | |
| Scheduler - batch_get | Scheduler scan details | The keys scan details of each CF when executing batch_get command | |
| Scheduler - batch_get | Scheduler scan details [lock] | The keys scan details of lock CF when executing batch_get command | |
| Scheduler - batch_get | Scheduler scan details [write] | The keys scan details of write CF when executing batch_get command | |
| Scheduler - batch_get | Scheduler scan details [default] | The keys scan details of default CF when executing batch_get command | |
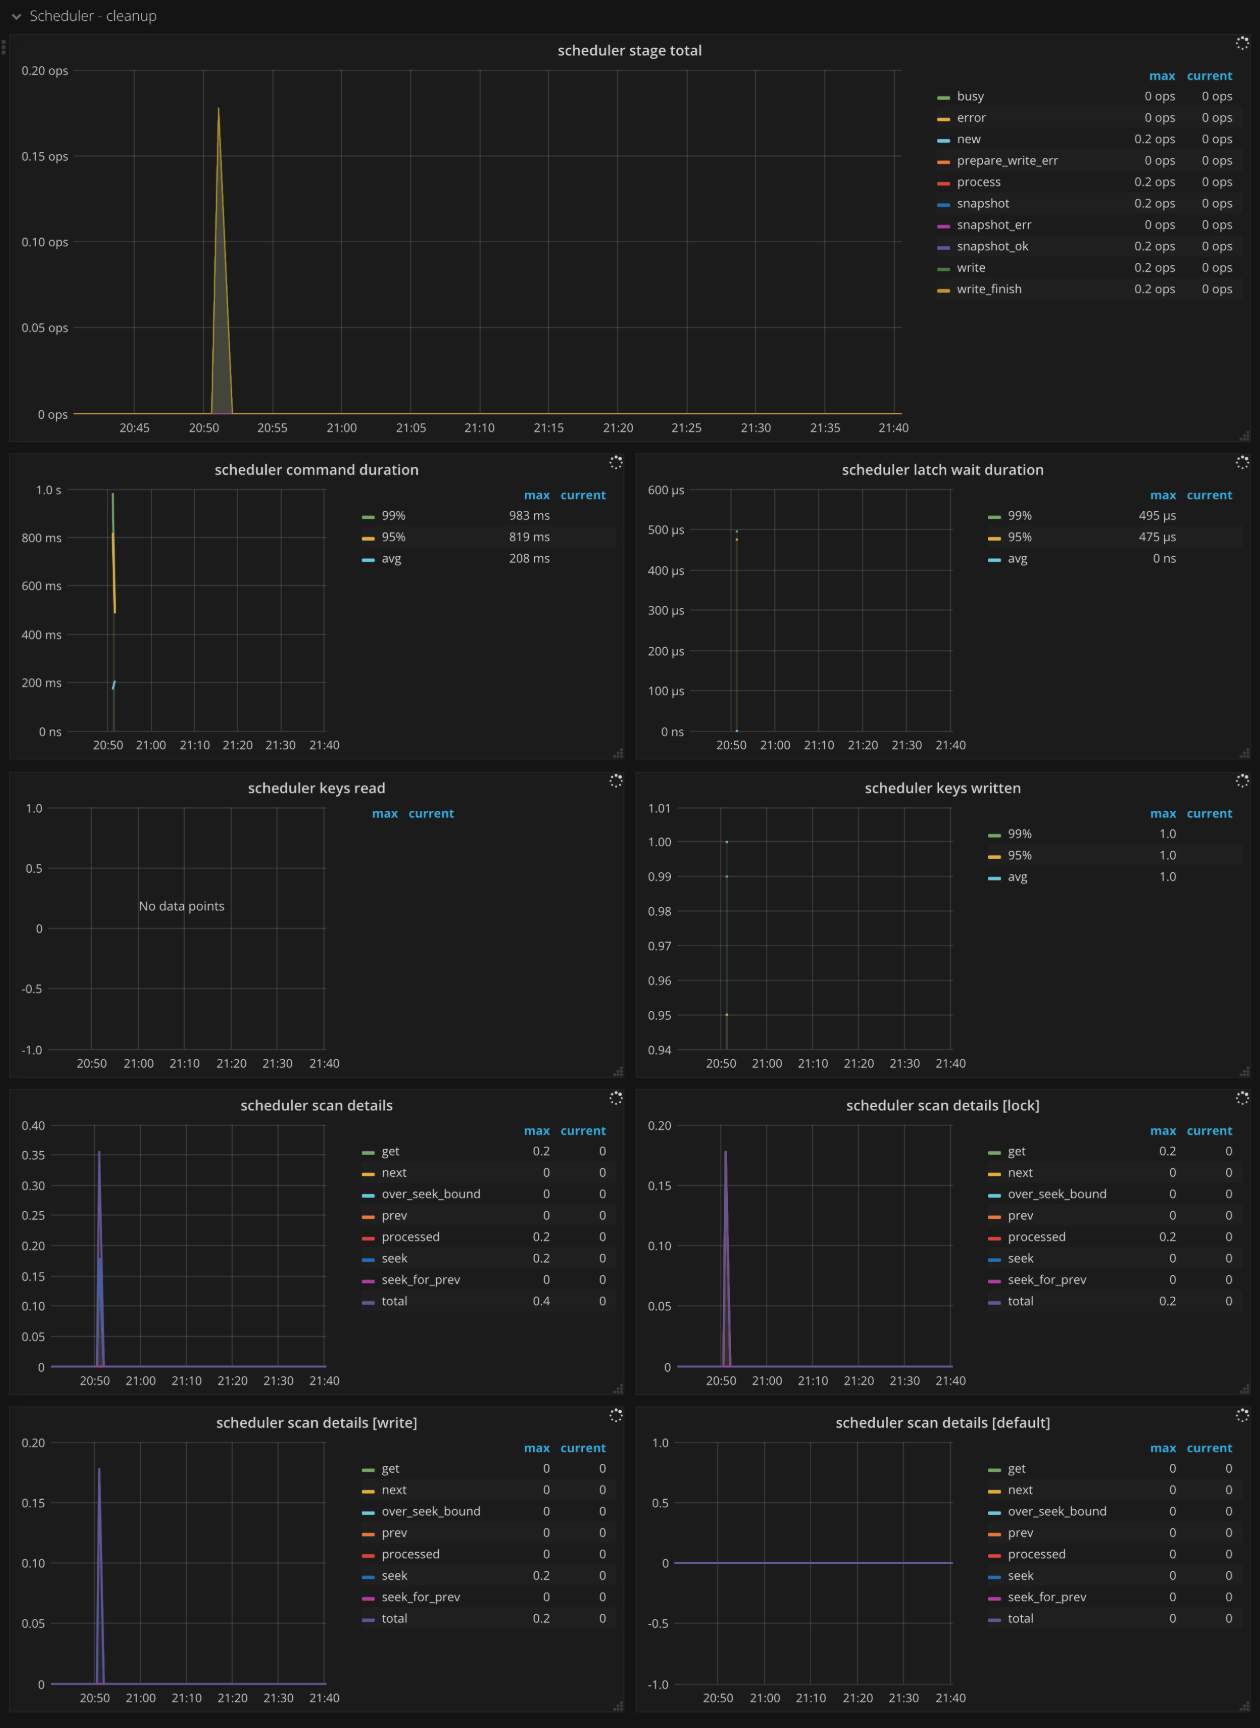
| Scheduler - cleanup | Scheduler stage total | The total number of commands on each stage in cleanup command | There should not be lots of errors in a short time. |
| Scheduler - cleanup | Scheduler command duration | The time consumed when executing cleanup command | It should be less than 1s. |
| Scheduler - cleanup | Scheduler latch wait duration | The time which is caused by latch wait in cleanup command | It should be less than 1s. |
| Scheduler - cleanup | Scheduler keys read | The count of keys read by a cleanup command | |
| Scheduler - cleanup | Scheduler keys written | The count of keys written by a cleanup command | |
| Scheduler - cleanup | Scheduler scan details | The keys scan details of each CF when executing cleanup command | |
| Scheduler - cleanup | Scheduler scan details [lock] | The keys scan details of lock CF when executing cleanup command | |
| Scheduler - cleanup | Scheduler scan details [write] | The keys scan details of write CF when executing cleanup command | |
| Scheduler - cleanup | Scheduler scan details [default] | The keys scan details of default CF when executing cleanup command | |
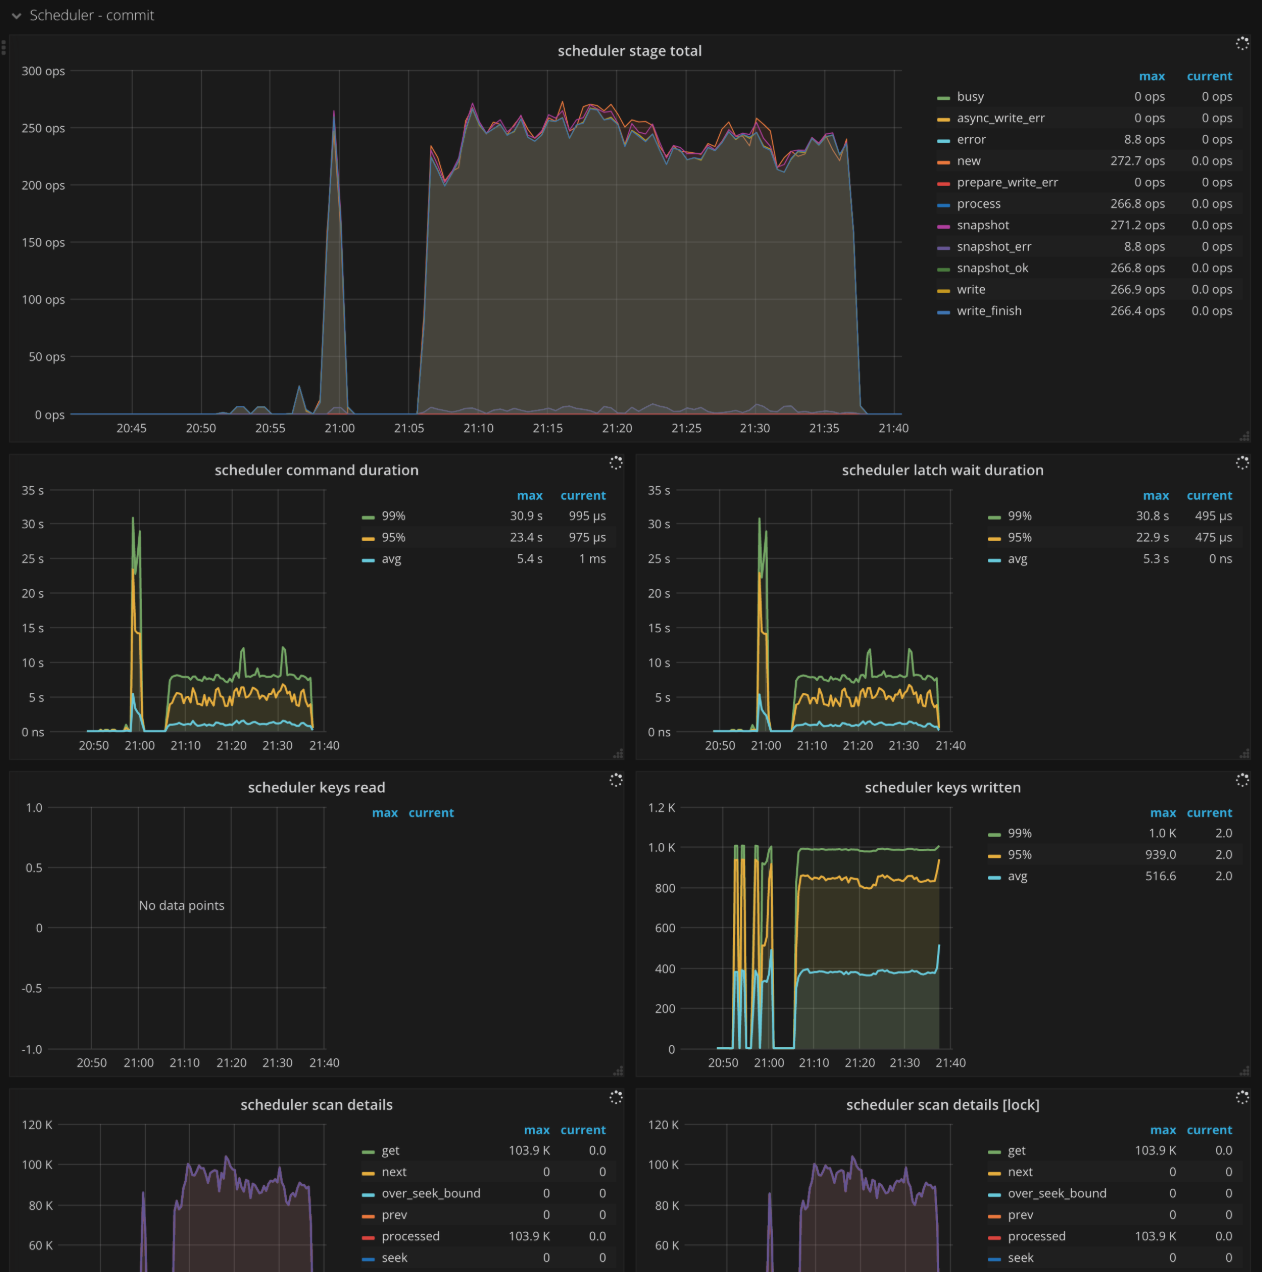
| Scheduler - commit | Scheduler stage total | The total number of commands on each stage in commit command | There should not be lots of errors in a short time. |
| Scheduler - commit | Scheduler command duration | The time consumed when executing commit command | It should be less than 1s. |
| Scheduler - commit | Scheduler latch wait duration | The time which is caused by latch wait in commit command | It should be less than 1s. |
| Scheduler - commit | Scheduler keys read | The count of keys read by a commit command | |
| Scheduler - commit | Scheduler keys written | The count of keys written by a commit command | |
| Scheduler - commit | Scheduler scan details | The keys scan details of each CF when executing commit command | |
| Scheduler - commit | Scheduler scan details [lock] | The keys scan details of lock CF when executing commit command | |
| Scheduler - commit | Scheduler scan details [write] | The keys scan details of write CF when executing commit command | |
| Scheduler - commit | Scheduler scan details [default] | The keys scan details of default CF when executing commit command | |
| Scheduler - gc | Scheduler stage total | The total number of commands on each stage in gc command | There should not be lots of errors in a short time. |
| Scheduler - gc | Scheduler command duration | The time consumed when executing gc command | It should be less than 1s. |
| Scheduler - gc | Scheduler latch wait duration | The time which is caused by latch wait in gc command | It should be less than 1s. |
| Scheduler - gc | Scheduler keys read | The count of keys read by a gc command | |
| Scheduler - gc | Scheduler keys written | The count of keys written by a gc command | |
| Scheduler - gc | Scheduler scan details | The keys scan details of each CF when executing gc command | |
| Scheduler - gc | Scheduler scan details [lock] | The keys scan details of lock CF when executing gc command | |
| Scheduler - gc | Scheduler scan details [write] | The keys scan details of write CF when executing gc command | |
| Scheduler - gc | Scheduler scan details [default] | The keys scan details of default CF when executing gc command | |
| Scheduler - get | Scheduler stage total | The total number of commands on each stage in get command | There should not be lots of errors in a short time. |
| Scheduler - get | Scheduler command duration | The time consumed when executing get command | It should be less than 1s. |
| Scheduler - get | Scheduler latch wait duration | The time which is caused by latch wait in get command | It should be less than 1s. |
| Scheduler - get | Scheduler keys read | The count of keys read by a get command | |
| Scheduler - get | Scheduler keys written | The count of keys written by a get command | |
| Scheduler - get | Scheduler scan details | The keys scan details of each CF when executing get command | |
| Scheduler - get | Scheduler scan details [lock] | The keys scan details of lock CF when executing get command | |
| Scheduler - get | Scheduler scan details [write] | The keys scan details of write CF when executing get command | |
| Scheduler - get | Scheduler scan details [default] | The keys scan details of default CF when executing get command | |
| Scheduler - key_mvcc | Scheduler stage total | The total number of commands on each stage in key_mvcc command | There should not be lots of errors in a short time. |
| Scheduler - key_mvcc | Scheduler command duration | The time consumed when executing key_mvcc command | It should be less than 1s. |
| Scheduler - key_mvcc | Scheduler latch wait duration | The time which is caused by latch wait in key_mvcc command | It should be less than 1s. |
| Scheduler - key_mvcc | Scheduler keys read | The count of keys read by a key_mvcc command | |
| Scheduler - key_mvcc | Scheduler keys written | The count of keys written by a key_mvcc command | |
| Scheduler - key_mvcc | Scheduler scan details | The keys scan details of each CF when executing key_mvcc command | |
| Scheduler - key_mvcc | Scheduler scan details [lock] | The keys scan details of lock CF when executing key_mvcc command | |
| Scheduler - key_mvcc | Scheduler scan details [write] | The keys scan details of write CF when executing key_mvcc command | |
| Scheduler - key_mvcc | Scheduler scan details [default] | The keys scan details of default CF when executing key_mvcc command | |
| Scheduler - prewrite | Scheduler stage total | The total number of commands on each stage in prewrite command | There should not be lots of errors in a short time. |
| Scheduler - prewrite | Scheduler command duration | The time consumed when executing prewrite command | It should be less than 1s. |
| Scheduler - prewrite | Scheduler latch wait duration | The time which is caused by latch wait in prewrite command | It should be less than 1s. |
| Scheduler - prewrite | Scheduler keys read | The count of keys read by a prewrite command | |
| Scheduler - prewrite | Scheduler keys written | The count of keys written by a prewrite command | |
| Scheduler - prewrite | Scheduler scan details | The keys scan details of each CF when executing prewrite command | |
| Scheduler - prewrite | Scheduler scan details [lock] | The keys scan details of lock CF when executing prewrite command | |
| Scheduler - prewrite | Scheduler scan details [write] | The keys scan details of write CF when executing prewrite command | |
| Scheduler - prewrite | Scheduler scan details [default] | The keys scan details of default CF when executing prewrite command | |
| Scheduler - resolve_lock | Scheduler stage total | The total number of commands on each stage in resolve_lock command | There should not be lots of errors in a short time. |
| Scheduler - resolve_lock | Scheduler command duration | The time consumed when executing resolve_lock command | It should be less than 1s. |
| Scheduler - resolve_lock | Scheduler latch wait duration | The time which is caused by latch wait in resolve_lock command | It should be less than 1s. |
| Scheduler - resolve_lock | Scheduler keys read | The count of keys read by a resolve_lock command | |
| Scheduler - resolve_lock | Scheduler keys written | The count of keys written by a resolve_lock command | |
| Scheduler - resolve_lock | Scheduler scan details | The keys scan details of each CF when executing resolve_lock command | |
| Scheduler - resolve_lock | Scheduler scan details [lock] | The keys scan details of lock CF when executing resolve_lock command | |
| Scheduler - resolve_lock | Scheduler scan details [write] | The keys scan details of write CF when executing resolve_lock command | |
| Scheduler - resolve_lock | Scheduler scan details [default] | The keys scan details of default CF when executing resolve_lock command | |
| Scheduler - scan | Scheduler stage total | The total number of commands on each stage in scan command | There should not be lots of errors in a short time. |
| Scheduler - scan | Scheduler command duration | The time consumed when executing scan command | It should be less than 1s. |
| Scheduler - scan | Scheduler latch wait duration | The time which is caused by latch wait in scan command | It should be less than 1s. |
| Scheduler - scan | Scheduler keys read | The count of keys read by a scan command | |
| Scheduler - scan | Scheduler keys written | The count of keys written by a scan command | |
| Scheduler - scan | Scheduler scan details | The keys scan details of each CF when executing scan command | |
| Scheduler - scan | Scheduler scan details [lock] | The keys scan details of lock CF when executing scan command | |
| Scheduler - scan | Scheduler scan details [write] | The keys scan details of write CF when executing scan command | |
| Scheduler - scan | Scheduler scan details [default] | The keys scan details of default CF when executing scan command | |
| Scheduler - scan_lock | Scheduler stage total | The total number of commands on each stage in scan_lock command | There should not be lots of errors in a short time. |
| Scheduler - scan_lock | Scheduler command duration | The time consumed when executing scan_lock command | It should be less than 1s. |
| Scheduler - scan_lock | Scheduler latch wait duration | The time which is caused by latch wait in scan_lock command | It should be less than 1s. |
| Scheduler - scan_lock | Scheduler keys read | The count of keys read by a scan_lock command | |
| Scheduler - scan_lock | Scheduler keys written | The count of keys written by a scan_lock command | |
| Scheduler - scan_lock | Scheduler scan details | The keys scan details of each CF when executing scan_lock command | |
| Scheduler - scan_lock | Scheduler scan details [lock] | The keys scan details of lock CF when executing scan_lock command | |
| Scheduler - scan_lock | Scheduler scan details [write] | The keys scan details of write CF when executing scan_lock command | |
| Scheduler - scan_lock | Scheduler scan details [default] | The keys scan details of default CF when executing scan_lock command | |
| Scheduler - start_ts_mvcc | Scheduler stage total | The total number of commands on each stage in start_ts_mvcc command | There should not be lots of errors in a short time. |
| Scheduler - start_ts_mvcc | Scheduler command duration | The time consumed when executing start_ts_mvcc command | It should be less than 1s. |
| Scheduler - start_ts_mvcc | Scheduler latch wait duration | The time which is caused by latch wait in start_ts_mvcc command | It should be less than 1s. |
| Scheduler - start_ts_mvcc | Scheduler keys read | The count of keys read by a start_ts_mvcc command | |
| Scheduler - start_ts_mvcc | Scheduler keys written | The count of keys written by a start_ts_mvcc command | |
| Scheduler - start_ts_mvcc | Scheduler scan details | The keys scan details of each CF when executing start_ts_mvcc command | |
| Scheduler - start_ts_mvcc | Scheduler scan details [lock] | The keys scan details of lock CF when executing start_ts_mvcc command | |
| Scheduler - start_ts_mvcc | Scheduler scan details [write] | The keys scan details of write CF when executing start_ts_mvcc command | |
| Scheduler - start_ts_mvcc | Scheduler scan details [default] | The keys scan details of default CF when executing start_ts_mvcc command | |
| Scheduler - unsafe_destroy_range | Scheduler stage total | The total number of commands on each stage in unsafe_destroy_range command | There should not be lots of errors in a short time. |
| Scheduler - unsafe_destroy_range | Scheduler command duration | The time consumed when executing unsafe_destroy_range command | It should be less than 1s. |
| Scheduler - unsafe_destroy_range | Scheduler latch wait duration | The time which is caused by latch wait in unsafe_destroy_range command | It should be less than 1s. |
| Scheduler - unsafe_destroy_range | Scheduler keys read | The count of keys read by a unsafe_destroy_range command | |
| Scheduler - unsafe_destroy_range | Scheduler keys written | The count of keys written by a unsafe_destroy_range command | |
| Scheduler - unsafe_destroy_range | Scheduler scan details | The keys scan details of each CF when executing unsafe_destroy_range command | |
| Scheduler - unsafe_destroy_range | Scheduler scan details [lock] | The keys scan details of lock CF when executing unsafe_destroy_range command | |
| Scheduler - unsafe_destroy_range | Scheduler scan details [write] | The keys scan details of write CF when executing unsafe_destroy_range command | |
| Scheduler - unsafe_destroy_range | Scheduler scan details [default] | The keys scan details of default CF when executing unsafe_destroy_range command | |
| Coprocessor | Request duration | The time consumed when handling coprocessor read requests | |
| Coprocessor | Wait duration | The time consumed when coprocessor requests are wait for being handled | It should be less than 10s in .9999. |
| Coprocessor | Handle duration | The time consumed when handling coprocessor requests | |
| Coprocessor | 95% Request duration by store | The time consumed when handling coprocessor read requests in each TiKV instance | |
| Coprocessor | 95% Wait duration by store | The time consumed when coprocessor requests are wait for being handled in each TiKV instance | |
| Coprocessor | 95% Handle duration by store | The time consumed when handling coprocessor requests in each TiKV instance | |
| Coprocessor | Request errors | The total number of the push down request errors | There should not be lots of errors in a short time. |
| Coprocessor | DAG executors | The total number of DAG executors | |
| Coprocessor | Scan keys | The number of keys that each request scans | |
| Coprocessor | Scan details | The scan details for each CF | |
| Coprocessor | Table Scan - Details by CF | The table scan details for each CF | |
| Coprocessor | Index Scan - Details by CF | The index scan details for each CF | |
| Coprocessor | Table Scan - Perf Statistics | The total number of RocksDB internal operations from PerfContext when executing table scan | |
| Coprocessor | Index Scan - Perf Statistics | The total number of RocksDB internal operations from PerfContext when executing index scan | |
| GC | MVCC versions | The number of versions for each key | |
| GC | MVCC delete versions | The number of versions deleted by GC for each key | |
| GC | GC tasks | The count of GC tasks processed by gc_worker | |
| GC | GC tasks Duration | The time consumed when executing GC tasks | |
| GC | GC keys (write CF) | The count of keys in write CF affected during GC | |
| GC | TiDB GC actions result | The TiDB GC action result on Region level | |
| GC | TiDB GC worker actions | The count of TiDB GC worker actions | |
| GC | TiDB GC seconds | The time consumed when TiDB is doing GC | |
| GC | TiDB GC failure | The count of TiDB GC job failure | |
| GC | GC lifetime | The lifetime of TiDB GC | |
| GC | GC interval | The interval of TiDB GC | |
| Snapshot | Rate snapshot message | The rate of Raft snapshot messages sent | |
| Snapshot | 99% Handle snapshot duration | The time consumed when handling snapshots | |
| Snapshot | Snapshot state count | The number of snapshots in different states | |
| Snapshot | 99.99% Snapshot size | The snapshot size in .9999 | |
| Snapshot | 99.99% Snapshot KV count | The number of KV within a snapshot in .9999 | |
| Task | Worker handled tasks | The number of tasks handled by worker | |
| Task | Worker pending tasks | Current pending and running tasks of worker | It should be less than 1000. |
| Task | FuturePool pending tasks | Current pending and running tasks of future_pool | |
| Thread CPU | Raft store CPU | The CPU utilization of raftstore thread | The CPU usage should be less than 80%. |
| Thread CPU | Async apply CPU | The CPU utilization of async apply | The CPU usage should be less than 90%. |
| Thread CPU | Scheduler CPU | The CPU utilization of scheduler | The CPU usage should be less than 80%. |
| Thread CPU | Scheduler Worker CPU | The CPU utilization of scheduler worker | |
| Thread CPU | Storage ReadPool CPU | The CPU utilization of readpool | |
| Thread CPU | Coprocessor CPU | The CPU utilization of coprocessor | |
| Thread CPU | Snapshot worker CPU | The CPU utilization of snapshot worker | |
| Thread CPU | Split check CPU | The CPU utilization of split check | |
| Thread CPU | RocksDB CPU | The CPU utilization of RocksDB | |
| Thread CPU | gRPC poll CPU | The CPU utilization of gRPC | The CPU usage should be less than 80%. |
| RocksDB - kv | Get operations | The count of get operations | |
| RocksDB - kv | Get duration | The time consumed when executing get operation | |
| RocksDB - kv | Seek operations | The count of seek operations | |
| RocksDB - kv | Seek duration | The time consumed when executing seek operation | |
| RocksDB - kv | Write operations | The count of write operations | |
| RocksDB - kv | Write duration | The time consumed when executing write operation | |
| RocksDB - kv | WAL sync operations | The count of WAL sync operations | |
| RocksDB - kv | WAL sync duration | The time consumed when executing WAL sync operation | |
| RocksDB - kv | Compaction operations | The count of compaction and flush operations | |
| RocksDB - kv | Compaction duration | The time consumed when executing compaction and flush operation | |
| RocksDB - kv | SST read duration | The time consumed when reading SST files | |
| RocksDB - kv | Write stall duration | The time which is caused by write stall | It should be 0 in normal case. |
| RocksDB - kv | Memtable size | The memtable size of each column family | |
| RocksDB - kv | Memtable hit | The hit rate of memtable | |
| RocksDB - kv | Block cache size | The block cache size of each column family | |
| RocksDB - kv | Block cache hit | The hit rate of block cache | |
| RocksDB - kv | Block cache flow | The flow of different kinds of block cache operations | |
| RocksDB - kv | Block cache operations | The count of different kinds of block cache operations | |
| RocksDB - kv | Keys flow | The flow of different kinds of operations on keys | |
| RocksDB - kv | Total keys | The count of keys in each column family | |
| RocksDB - kv | Read flow | The flow of different kinds of read operations | |
| RocksDB - kv | Bytes / Read | The bytes per read | |
| RocksDB - kv | Write flow | The flow of different kinds of write operations | |
| RocksDB - kv | Bytes / Write | The bytes per write | |
| RocksDB - kv | Compaction flow | The flow of different kinds of compaction operations | |
| RocksDB - kv | Compaction pending bytes | The pending bytes when executing compaction | |
| RocksDB - kv | Read amplification | The read amplification in each TiKV instance | |
| RocksDB - kv | Compression ratio | The compression ratio of each level | |
| RocksDB - kv | Number of snapshots | The number of snapshot of each TiKV instance | |
| RocksDB - kv | Oldest snapshots duration | The time that the oldest unreleased snapshot survivals | |
| RocksDB - kv | Number files at each level | The number of SST files for different column families in each level | |
| RocksDB - kv | Ingest SST duration seconds | The time consumed when ingesting SST files | |
| RocksDB - kv | Stall conditions changed of each CF | Stall conditions changed of each column family | |
| RocksDB - raft | Get operations | The count of get operations | |
| RocksDB - raft | Get duration | The time consumed when executing get operation | |
| RocksDB - raft | Seek operations | The count of seek operations | |
| RocksDB - raft | Seek duration | The time consumed when executing seek operation | |
| RocksDB - raft | Write operations | The count of write operations | |
| RocksDB - raft | Write duration | The time consumed when executing write operation | |
| RocksDB - raft | WAL sync operations | The count of WAL sync operations | |
| RocksDB - raft | WAL sync duration | The time consumed when executing WAL sync operation | |
| RocksDB - raft | Compaction operations | The count of compaction and flush operations | |
| RocksDB - raft | Compaction duration | The time consumed when executing compaction and flush operation | |
| RocksDB - raft | SST read duration | The time consumed when reading SST files | |
| RocksDB - raft | Write stall duration | The time which is caused by write stall | It should be 0 in normal case. |
| RocksDB - raft | Memtable size | The memtable size of each column family | |
| RocksDB - raft | Memtable hit | The hit rate of memtable | |
| RocksDB - raft | Block cache size | The block cache size of each column family | |
| RocksDB - raft | Block cache hit | The hit rate of block cache | |
| RocksDB - raft | Block cache flow | The flow of different kinds of block cache operations | |
| RocksDB - raft | Block cache operations | The count of different kinds of block cache operations | |
| RocksDB - raft | Keys flow | The flow of different kinds of operations on keys | |
| RocksDB - raft | Total keys | The count of keys in each column family | |
| RocksDB - raft | Read flow | The flow of different kinds of read operations | |
| RocksDB - raft | Bytes / Read | The bytes per read | |
| RocksDB - raft | Write flow | The flow of different kinds of write operations | |
| RocksDB - raft | Bytes / Write | The bytes per write | |
| RocksDB - raft | Compaction flow | The flow of different kinds of compaction operations | |
| RocksDB - raft | Compaction pending Bytes | The pending bytes when executing compaction | |
| RocksDB - raft | Read amplification | The read amplification in each TiKV instance | |
| RocksDB - raft | Compression ratio | The compression ratio of each level | |
| RocksDB - raft | Number of snapshots | The number of snapshot of each TiKV instance | |
| RocksDB - raft | Oldest snapshots duration | The time that the oldest unreleased snapshot survivals | |
| RocksDB - raft | Number files at each level | The number of SST files for different column families in each level | |
| RocksDB - raft | Ingest SST duration seconds | The time consumed when ingesting SST files | |
| RocksDB - raft | Stall conditions changed of each CF | Stall conditions changed of each column family | |
| gRPC | gRPC message count | The count of different kinds of gRPC message | |
| gRPC | gRPC message failed | The count of different kinds of gRPC message which is failed | |
| gRPC | 99% gRPC message duration | The execution time of gRPC message | |
| gRPC | gRPC GC message count | The count of gRPC GC message | |
| gRPC | 99% gRPC KV GC message duration | The execution time of gRPC GC message | |
| PD | PD requests | The count of requests that TiKV sends to PD | |
| PD | PD request duration (average) | The time consumed by requests that TiKV sends to PD | |
| PD | PD heartbeats | The total number of PD heartbeat messages | |
| PD | PD validate peers | The total number of peers validated by the PD worker |
TiKV dashboard interface
This section shows images of the service panels on the TiKV dashboard.
Cluster
Errors
Server
Raft IO
Raft process
Raft message
Raft propose
Raft admin
Local reader
Storage
Scheduler
Scheduler - batch_get
Scheduler - cleanup
Scheduler - commit