TiCDC Monitoring Metrics Summary
Starting from v7.0.0, when you deploy Grafana using TiUP, the TiCDC Summary Dashboard is automatically added to the Grafana monitoring page. Through this dashboard, you can quickly understand the status of TiCDC servers and changefeeds.
The following image shows the monitoring panels of the TiCDC Summary Dashboard:
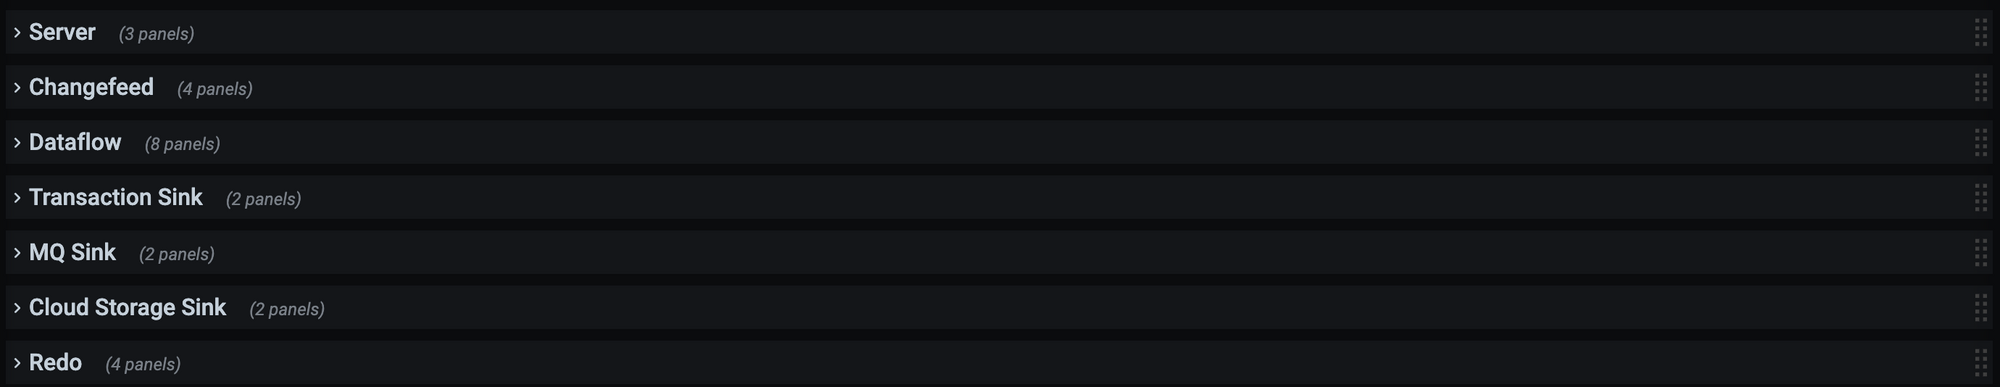
Each monitoring panel is described as follows:
- Server: summary of TiCDC nodes in the cluster.
- Changefeed: the latency and status information of TiCDC changefeeds.
- Dataflow: statistics of data changes processed by TiCDC internal modules.
- Transaction Sink: the write latency of the downstream MySQL or TiDB.
- MQ Sink: the write latency of the downstream MQ system.
- Cloud Storage Sink: the write speed of the downstream cloud storage.
- Redo: the write latency when the redo feature is enabled.
Server panel
The Server panel is as follows:
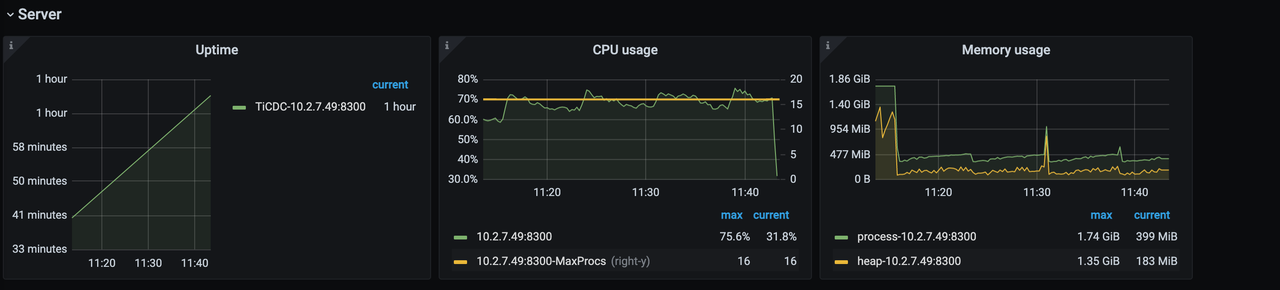
- Uptime: the time that TiCDC nodes have been running.
- CPU usage: the CPU usage of TiCDC nodes.
- Memory usage: the memory usage of TiCDC nodes.
Changefeed panel
The Changefeed panel is as follows:
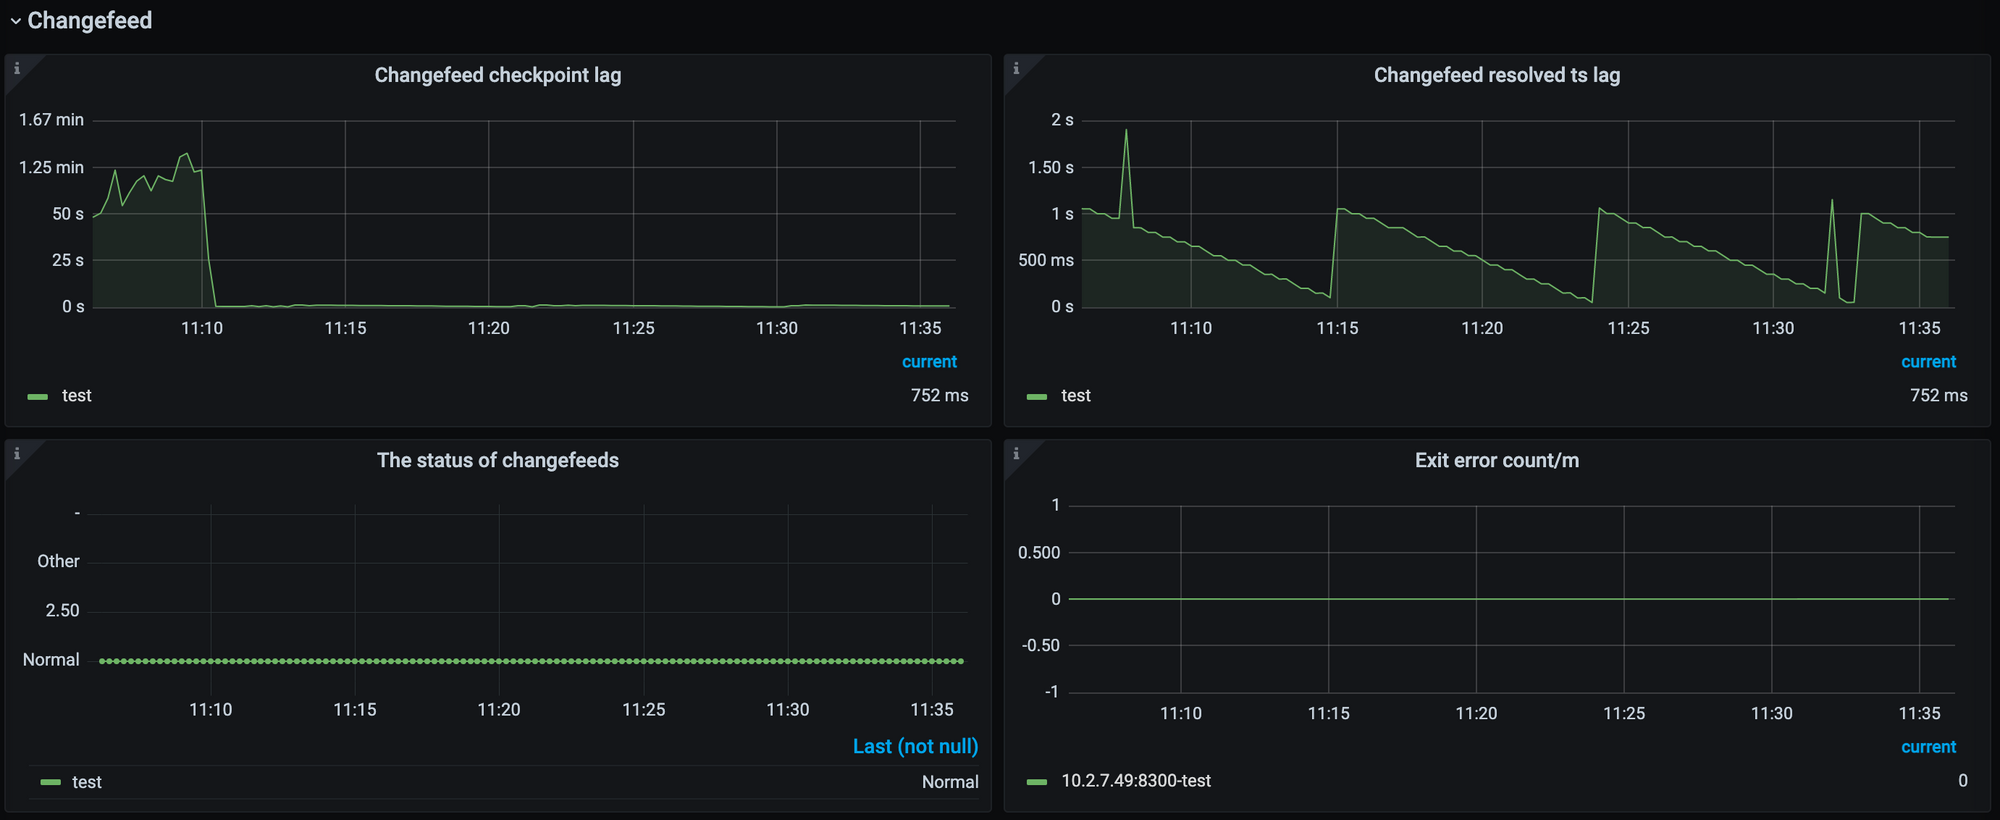
- Changefeed checkpoint lag: indicates the data replication latency between the upstream TiDB cluster and the downstream system, measured in time. In general, this metric reflects the overall health of the data replication task. Usually, the smaller the lag, the better the status of the replication task. When the lag increases, it usually indicates that the replication ability of the changefeed or the consumption ability of the downstream system cannot keep up with the write speed of the upstream.
- Changefeed resolved ts lag: indicates the data latency between the upstream TiDB cluster and the TiCDC node, measured in time. This metric reflects the ability of the changefeed to pull the data changes from the upstream. When the lag increases, it means that the changefeed cannot pull the data changes generated by the upstream in time.
Dataflow panel
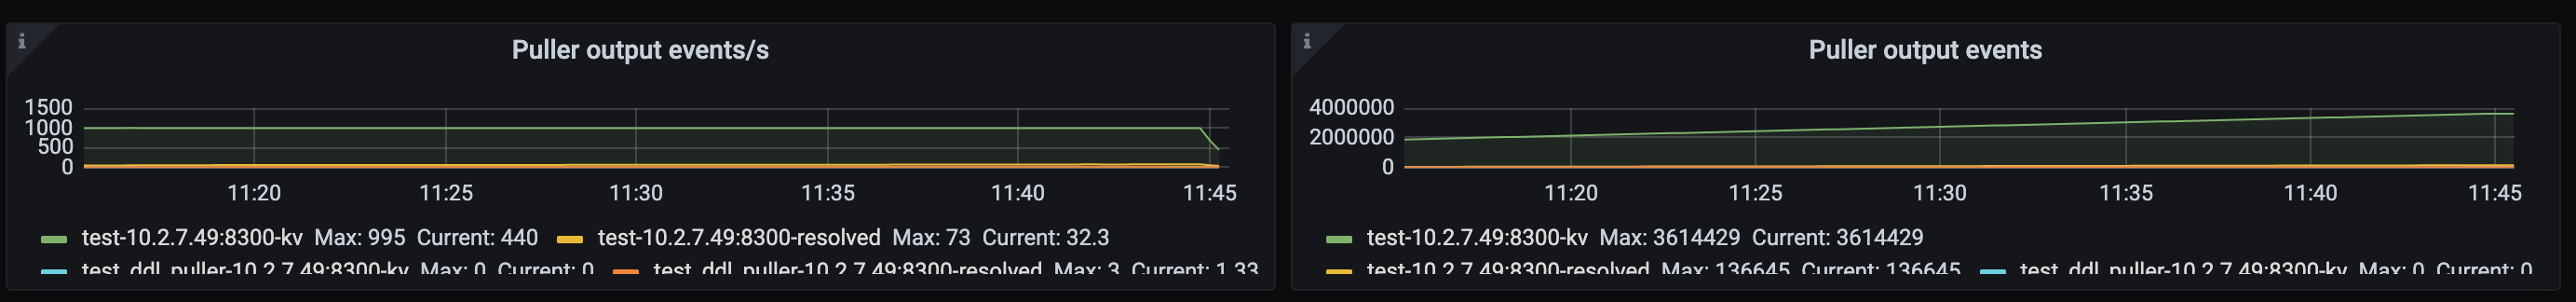
- Puller output events/s: the number of data changes output by the Puller module to the Sorter module per second in the TiCDC node. This metric reflects the speed at which TiCDC pulls the data changes from the upstream.
- Puller output events: the total number of data changes output by the Puller module to the Sorter module in the TiCDC node.

Sorter output events/s: the number of data changes output by the Sorter module per second to the Sink module in the TiCDC node. Note that the data output rate of Sorter is affected by the Sink module. Therefore, when you find that the output rate of the Sorter module is lower than that of the Puller module, it does not necessarily mean that the sorting speed of the Sorter module is too slow. You need to first observe the metrics related to the Sink module to confirm whether the Sink module takes a long time to flush data, resulting in a decrease in Sorter module output.
Sorter output event: the total number of data changes output by the Sorter module to the Sink module in the TiCDC node.
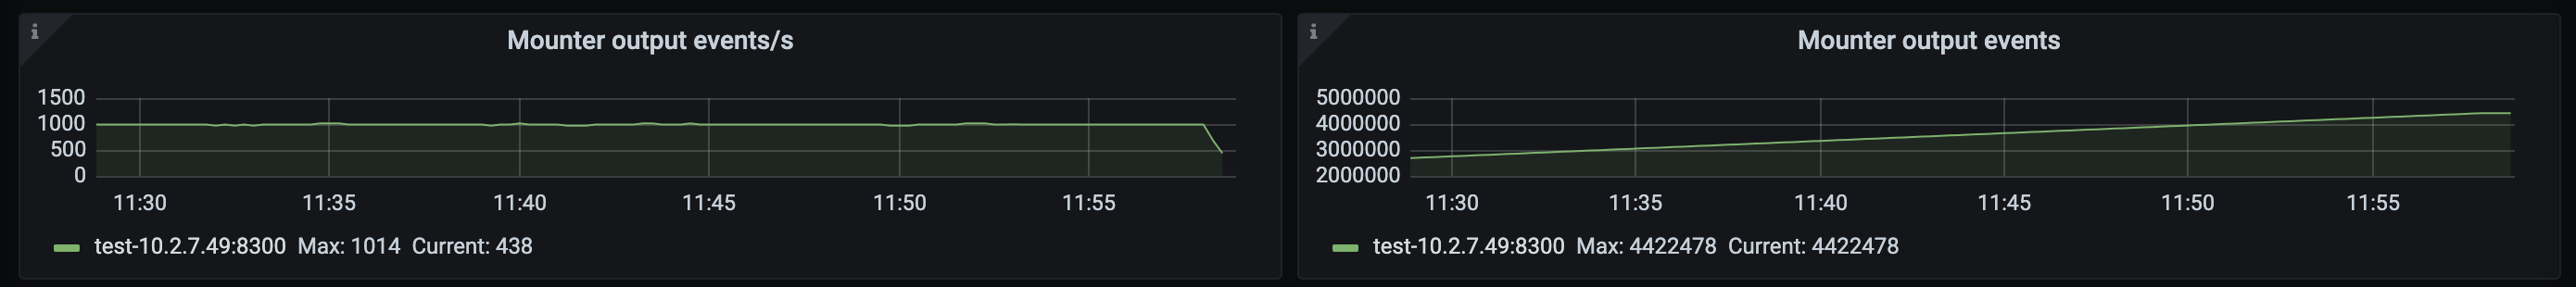
Mounter output events/s: the number of data changes decoded by the Mounter module per second in the TiCDC node. When the upstream data changes involve a large number of fields, the decoding speed of the Mounter module might be affected.
Mounter output event: the total number of data changes decoded by the Mounter module in the TiCDC node.
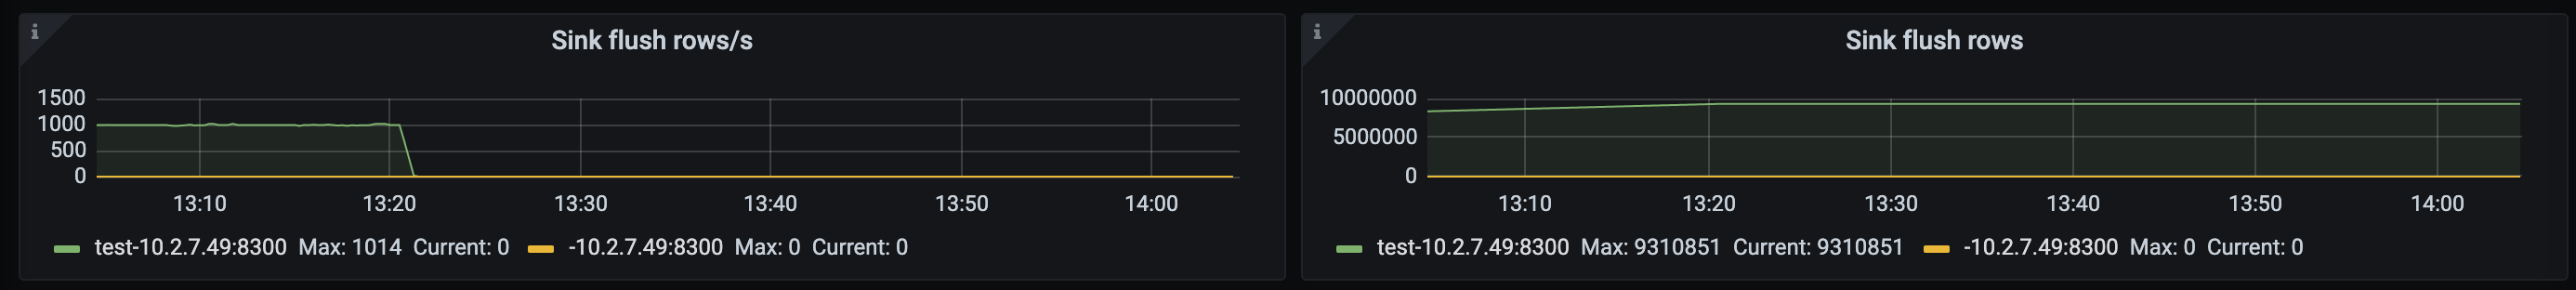
Sink flush rows/s: the number of data changes output by the Sink module to the downstream per second in the TiCDC node. This metric reflects the speed at which the data changes are replicated to the downstream. When Sink flush rows/s is lower than Puller output events/s, the replication latency might increase.
Sink flush rows: the total number of data changes output by the Sink module to the downstream in the TiCDC node.
Transaction Sink panel
The Transaction Sink panel displays data only when the downstream is MySQL or TiDB.
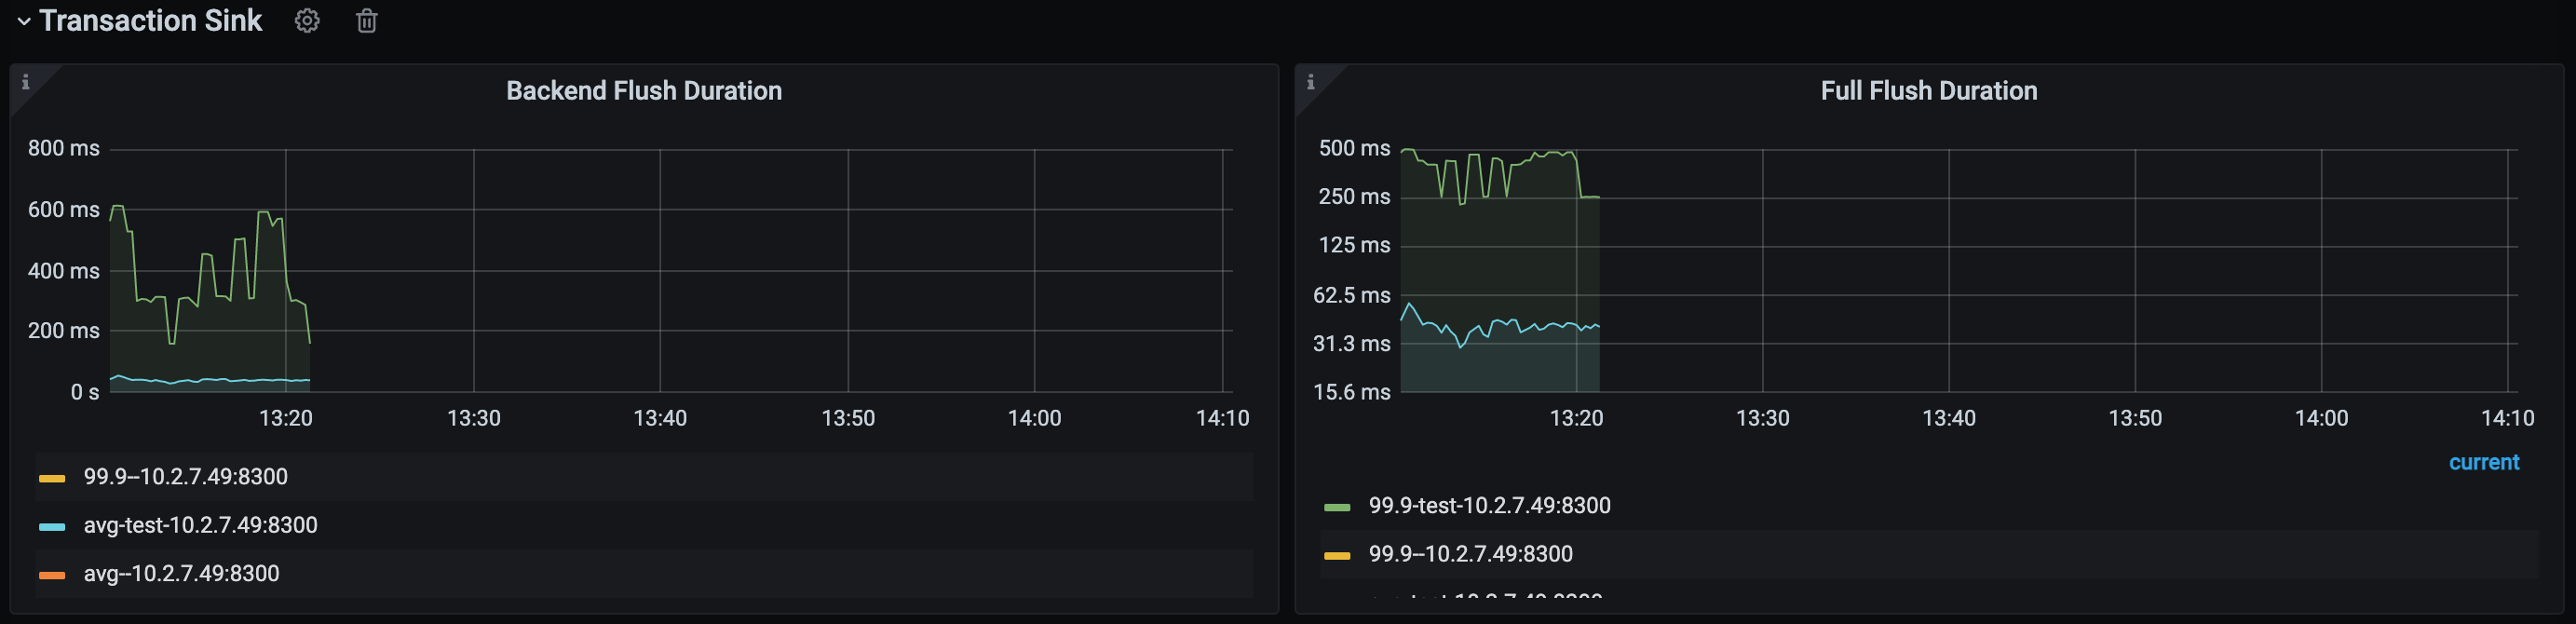
Backend Flush Duration: the duration that the TiCDC Transaction Sink module takes to execute a SQL statement on the downstream. By observing this metric, you can determine whether the performance of the downstream is the bottleneck of the replication speed. Generally, the p999 value should be below 500 ms. When the value exceeds this limit, the replication speed might be affected, resulting in an increase in the Changefeed checkpoint lag.
Full Flush Duration: the total duration consumed by each transaction in TiCDC from sorting by Sorter to sending downstream. By subtracting the Backend Flush Duration value from this value, you can get the total queueing time of a transaction before it is executed on the downstream. If the queueing time is too long, you can consider allocating more memory quota to the replication task.
MQ Sink panel
The MQ Sink panel displays data only when the downstream is Kafka.
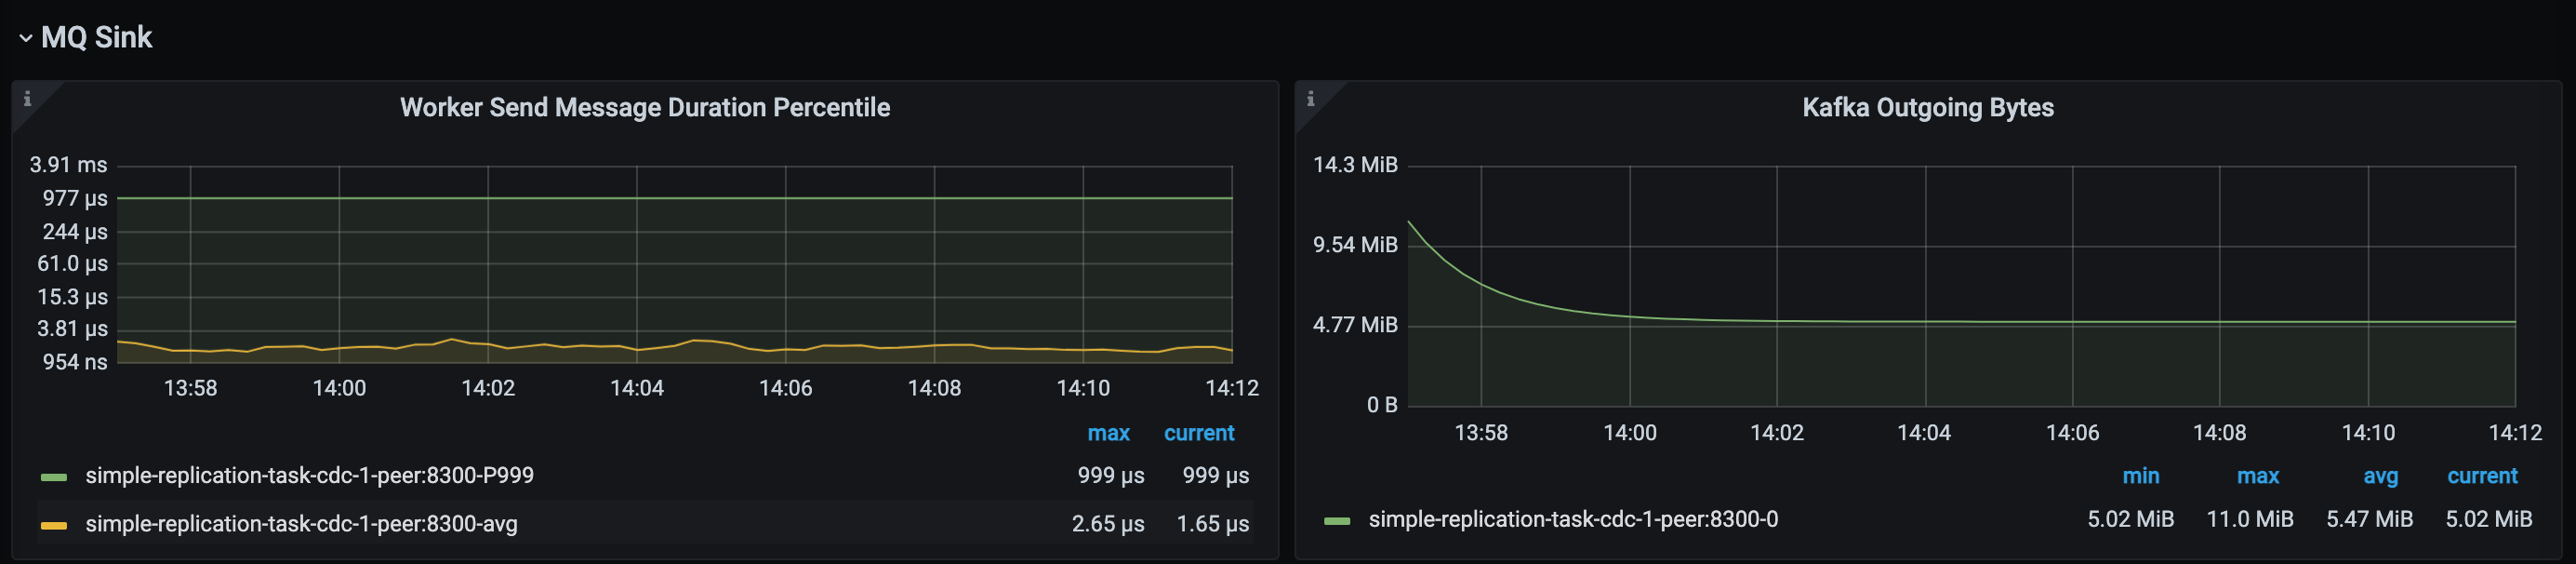
- Worker Send Message Duration Percentile: The latency of TiCDC MQ Sink worker sending data to the downstream.
- Kafka Ongoing Bytes: The speed at which TiCDC MQ Sink sends data to the downstream.
Cloud Storage Sink panel
The Cloud Storage Sink panel displays data only when the downstream is Cloud Storage.
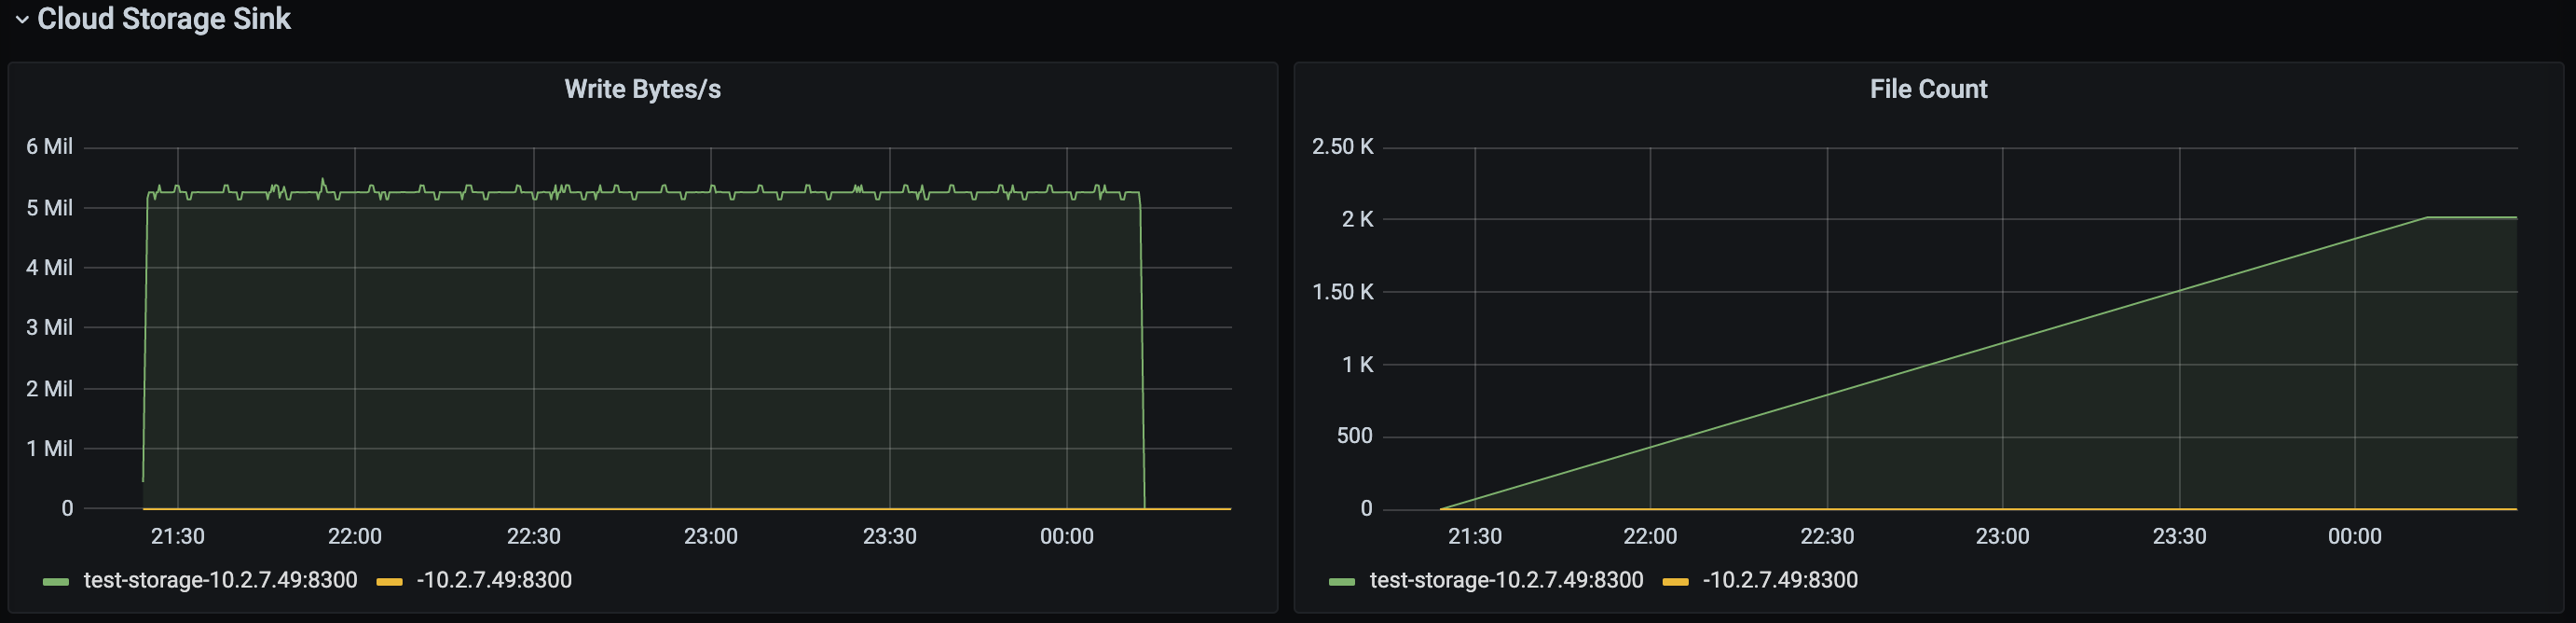
- Write Bytes/s: The speed at which the Cloud Storage Sink module writes data to the downstream.
- File Count: the total number of files written by the Cloud Storage Sink module.
Redo panel
The Redo panel displays data only when the Redo Log feature is enabled.
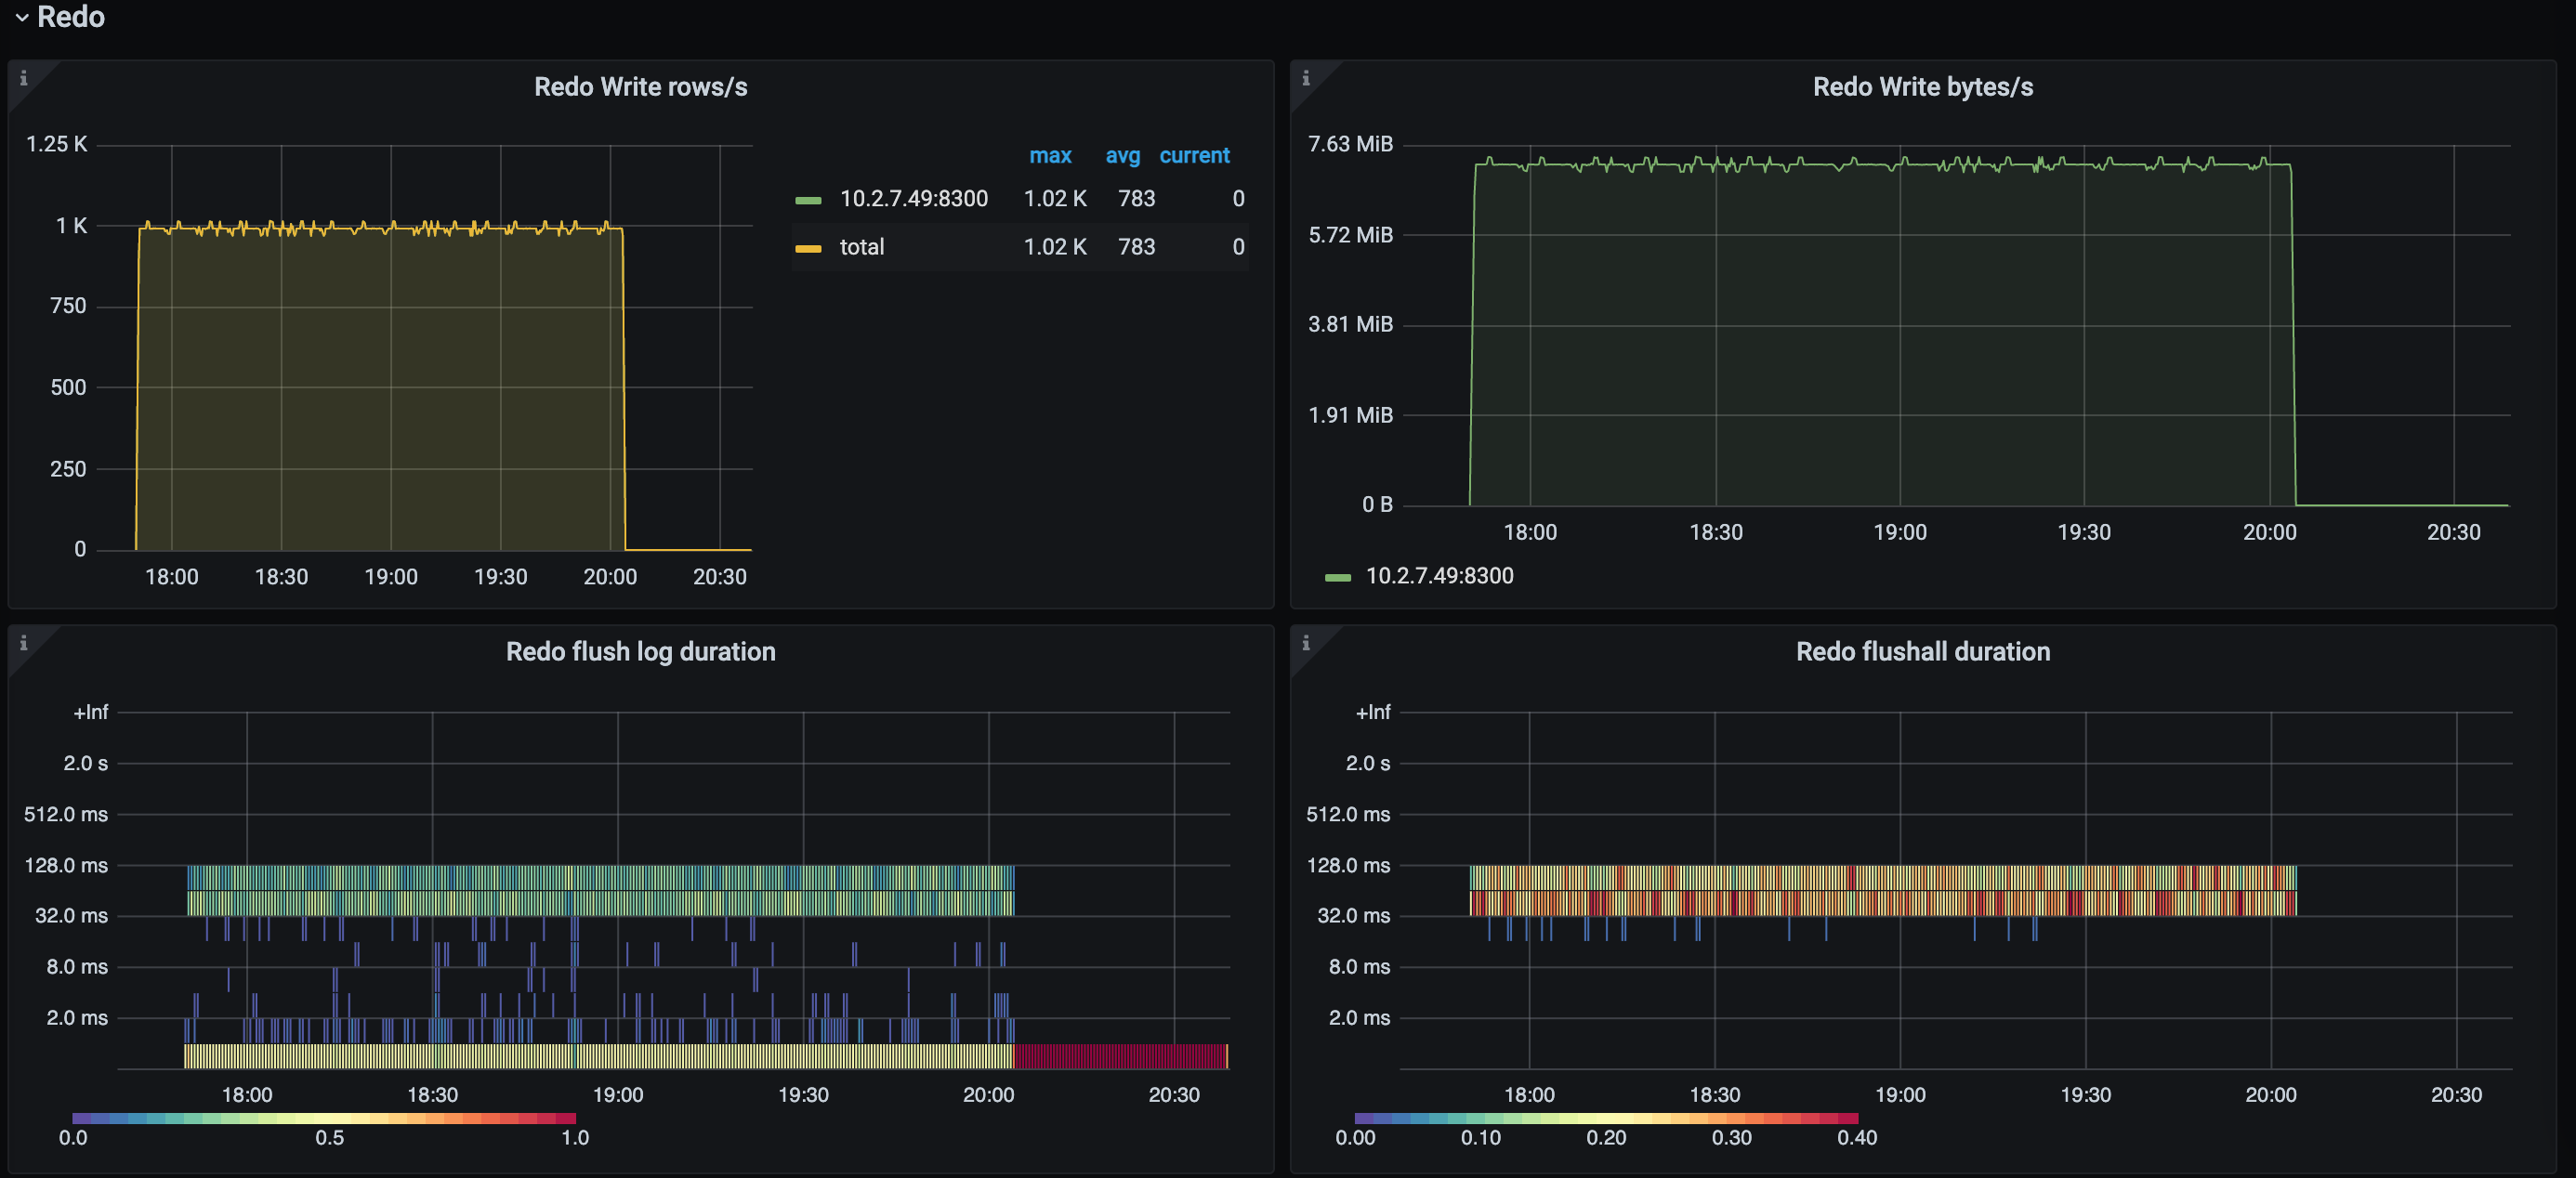
- Redo Write rows/s: the number of rows written per second by the Redo module. When the Redo feature is enabled, if the latency of a replication task increases, you can observe whether there is a significant difference between this metric and the value of Puller Output event/s. If so, the increase in latency might be due to the insufficient writing capacity of the Redo module.
- Redo Write byte/s: the speed at which data is written per second by the Redo module.
- Redo flush log duration: the time taken for the Redo module to flush data to the downstream. If this metric value is high, this operation might affect the replication speed.
- Redo flushall duration: the total time that data changes stay in the Redo module.