TiCDC Monitoring Metrics Details
You can get an overview of TiCDC's current status from the TiCDC dashboard, where the key metrics are displayed. This document provides a detailed description of these key metrics.
The metric description in this document is based on the following replication task example, which replicates data to MySQL using the default configuration.
cdc cli changefeed create --server=http://10.0.10.25:8300 --sink-uri="mysql://root:123456@127.0.0.1:3306/" --changefeed-id="simple-replication-task"
Metrics for TiCDC in the new architecture
The monitoring dashboard for TiCDC in the new architecture is TiCDC-New-Arch. For TiDB clusters of v8.5.4 and later versions, this monitoring dashboard is integrated into Grafana during cluster deployment or upgrade, so no manual operation is required.
If your cluster version is earlier than v8.5.4, you need to manually import the TiCDC monitoring metrics file:
Download the monitoring metrics file for TiCDC in the new architecture:
wget https://raw.githubusercontent.com/pingcap/ticdc/refs/heads/release-8.5/metrics/grafana/ticdc_new_arch.jsonImport the downloaded metrics file on Grafana:
The monitoring dashboard for TiCDC new architecture mainly includes the following sections:
- Summary: The summary information of the TiCDC cluster
- Server: The summary information of TiKV nodes and TiCDC nodes in the TiDB cluster
- Log Puller: The detailed information of the TiCDC Log Puller module
- Event Store: The detailed information of the TiCDC Event Store module
- Sink: The detailed information of the TiCDC Sink module
Summary
The following is an example of the Summary panel:
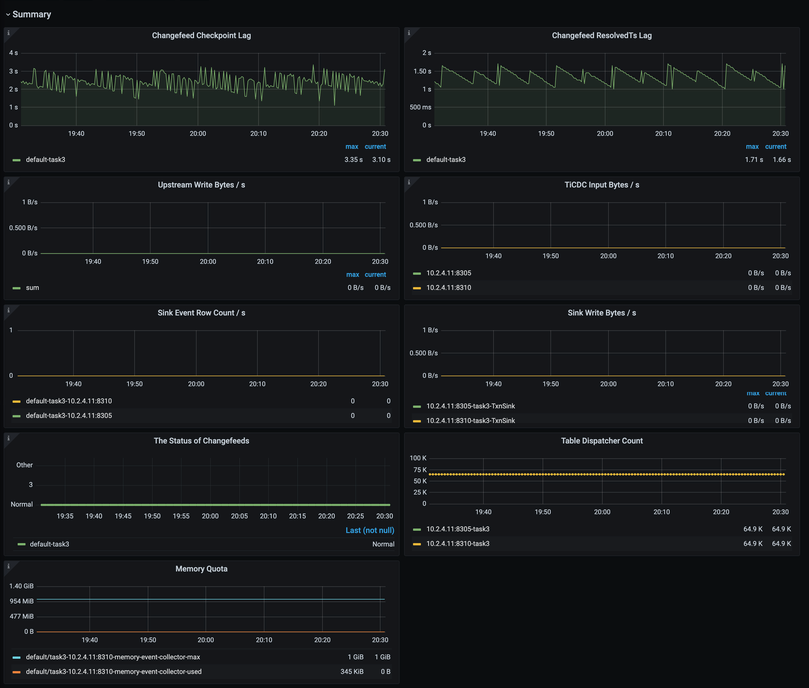
The description of each metric in the Summary panel is as follows:
- Changefeed Checkpoint Lag: The lag of a replication task between downstream and upstream
- Changefeed ResolvedTs Lag: The lag between the internal processing progress of TiCDC nodes and the upstream database
- Upstream Write Bytes/s: The write throughput of the upstream database
- TiCDC Input Bytes/s: The amount of data that TiCDC receives from the upstream per second
- Sink Event Row Count/s: The number of rows that TiCDC writes to the downstream per second
- Sink Write Bytes/s: The amount of data that TiCDC writes to the downstream per second
- The Status of Changefeeds: The status of each changefeed
- Table Dispatcher Count: The number of dispatchers corresponding to each changefeed
- Memory Quota: The memory quota and usage of the Event Collector; excessive usage might cause throttling
Server
The following is an example of the Server panel:
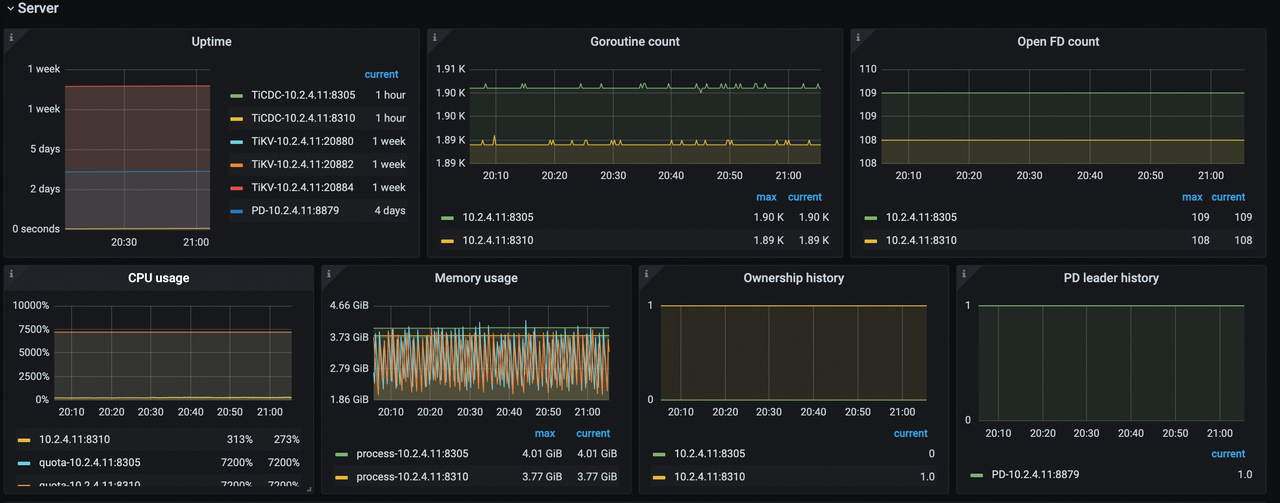
The description of each metric in the Server panel is as follows:
- Uptime: The time for which TiKV nodes and TiCDC nodes have been running
- Goroutine Count: The number of Goroutines on TiCDC nodes
- Open FD Count: The number of file handles opened by TiCDC nodes
- CPU Usage: The CPU usage of TiCDC nodes
- Memory Usage: The memory usage of TiCDC nodes
- Ownership History: The historical records of Owner nodes in the TiCDC cluster
- PD Leader History: The historical records of PD Leader nodes in the upstream TiDB cluster
Log Puller
The following is an example of the Log Puller panel:
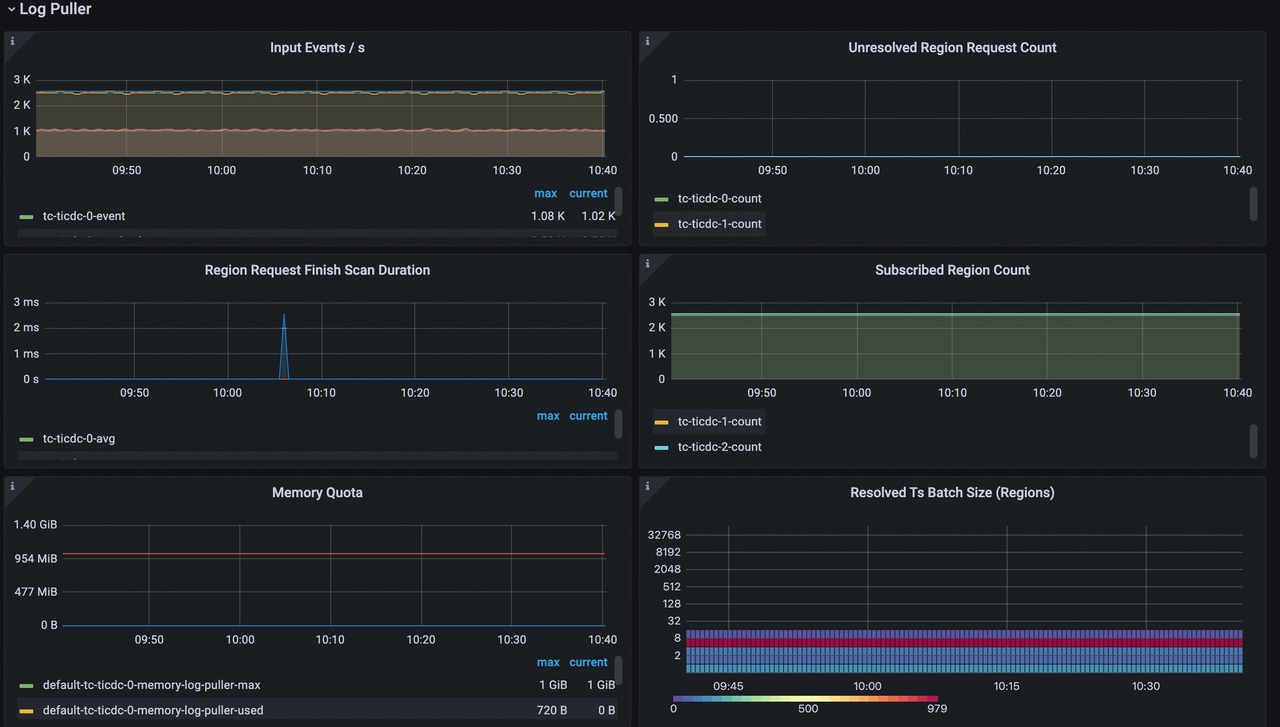
The description of each metric in the Log Puller panel is as follows:
- Input Events/s: The number of events that TiCDC receives per second
- Unresolved Region Request Count: The number of Region incremental scan requests that TiCDC has sent but not yet completed
- Region Request Finish Scan Duration: The time consumed by Region incremental scans
- Subscribed Region Count: The total number of subscribed Regions
- Memory Quota: The memory quota and usage of Log Puller; excessive usage might cause throttling
- Resolved Ts Batch Size (Regions): The number of Regions included in a single Resolved Ts event
Event Store
The following is an example of the Event Store panel:
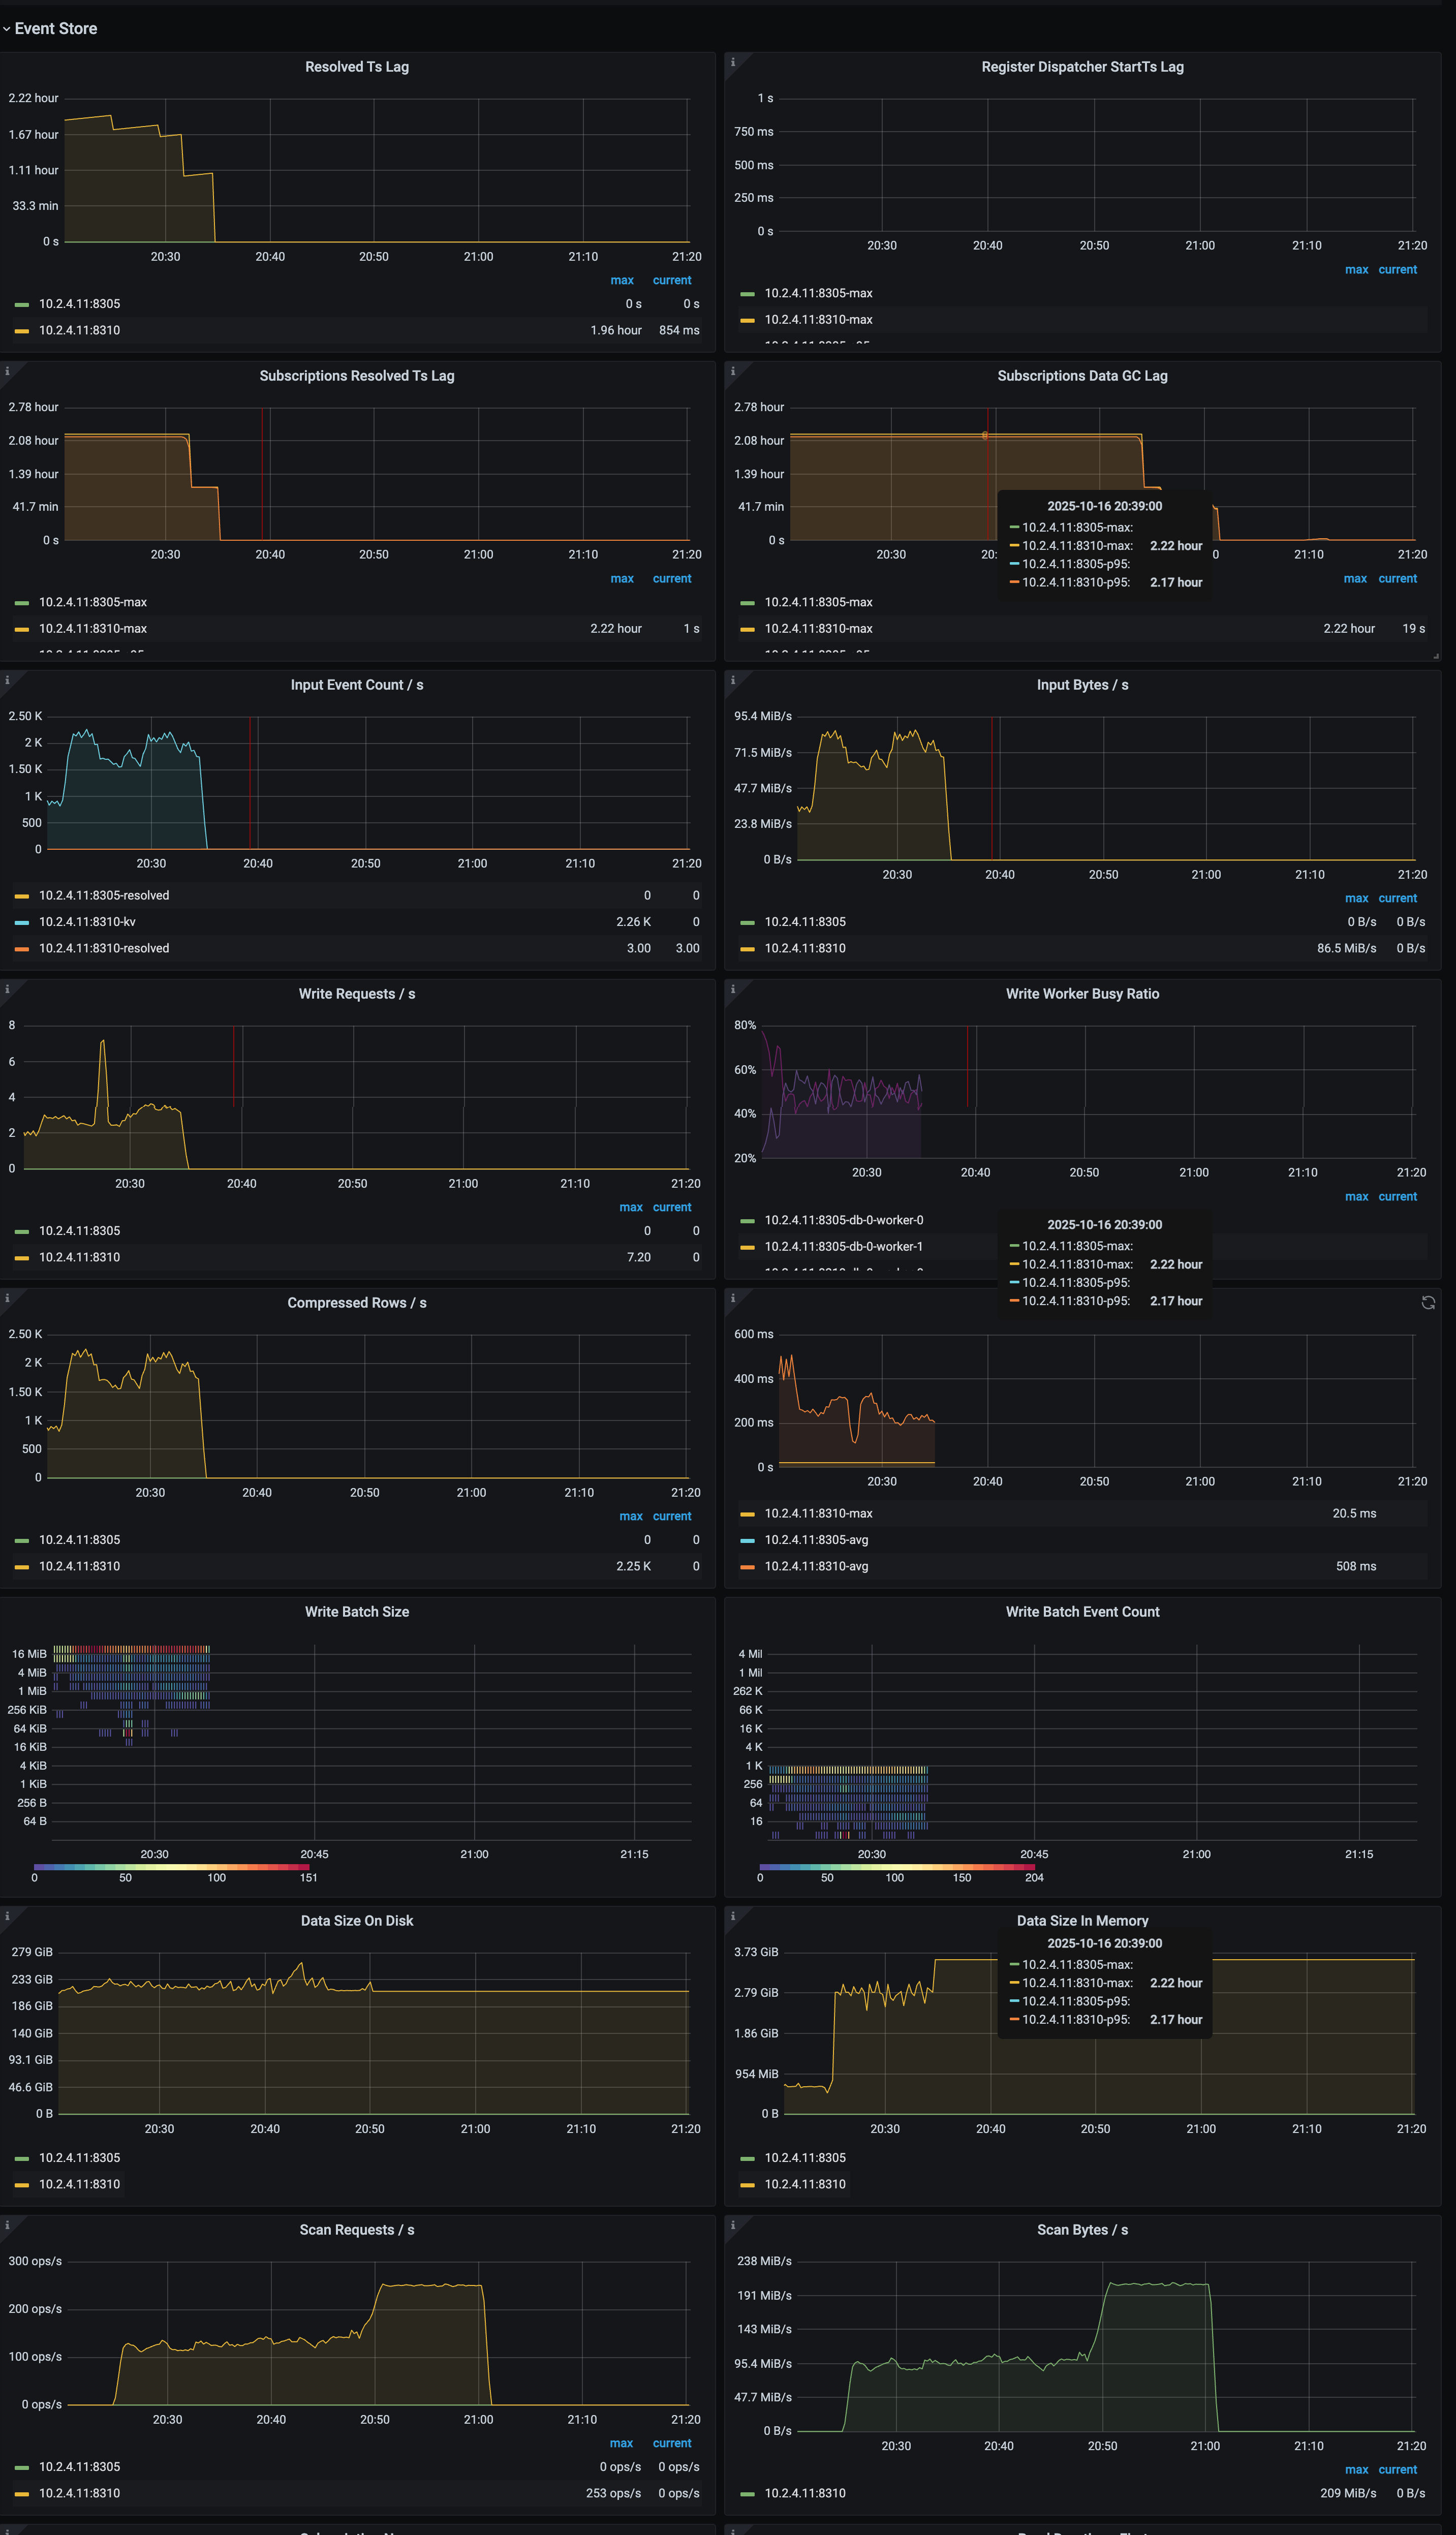
The description of each metric in the Event Store panel is as follows:
- Resolved Ts Lag: The lag between Event Store processing progress and the upstream database
- Register Dispatcher StartTs Lag: The lag between dispatcher registration StartTs and the current time
- Subscriptions Resolved Ts Lag: The lag between subscription processing progress and the upstream database
- Subscriptions Data GC Lag: The lag between subscription data GC progress and the current time
- Input Event Count/s: The number of events that Event Store processes per second
- Input Bytes/s: The amount of data that Event Store processes per second
- Write Requests/s: The number of write requests that Event Store executes per second
- Write Worker Busy Ratio: The ratio of I/O time to total runtime for Event Store write threads
- Compressed Rows/s: The number of rows compressed per second in Event Store (triggered only when row size exceeds the threshold)
- Write Duration: The time consumed by Event Store write operations
- Write Batch Size: The batch size of a single write operation
- Write Batch Event Count: The number of row change events included in a single write batch
- Data Size On Disk: The total data size that Event Store occupies on disk
- Data Size In Memory: The total data size that Event Store occupies in memory
- Scan Requests/s: The number of scan requests that Event Store executes per second
- Scan Bytes/s: The amount of data that Event Store scans per second
Sink
The following is an example of the Sink panel:
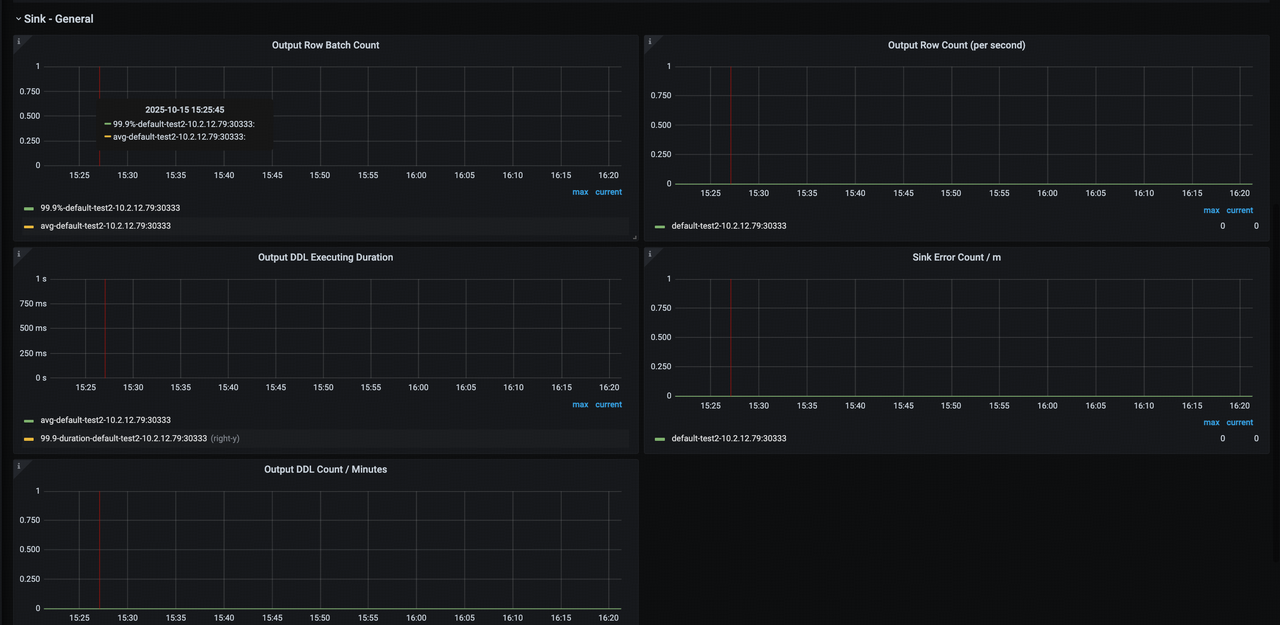
The description of each metric in the Sink panel is as follows:
- Output Row Batch Count: The average number of rows per DML batch written by the Sink module
- Output Row Count (per second): The number of DML rows written to downstream per second
- Output DDL Executing Duration: The time consumed by executing DDL events for the changefeed on the current node
- Sink Error Count / m: The number of errors reported per minute by the Sink module
- Output DDL Count / Minutes: The number of DDLs executed per minute for the changefeed on the current node
Metrics for TiCDC in the classic architecture
If you use TiUP to deploy the TiDB cluster, you can see a sub-dashboard for TiCDC in the classic architecture on Grafana, which is deployed at the same time as TiDB.
The description of each panel is as follows:
- Server: The summary information of TiKV nodes and TiCDC nodes in the TiDB cluster
- Changefeed: The detailed information of TiCDC replication tasks
- Events: The detail information about the data flow within the TiCDC cluster
- TiKV: TiKV information related to TiCDC
Server
The following is an example of the Server panel:
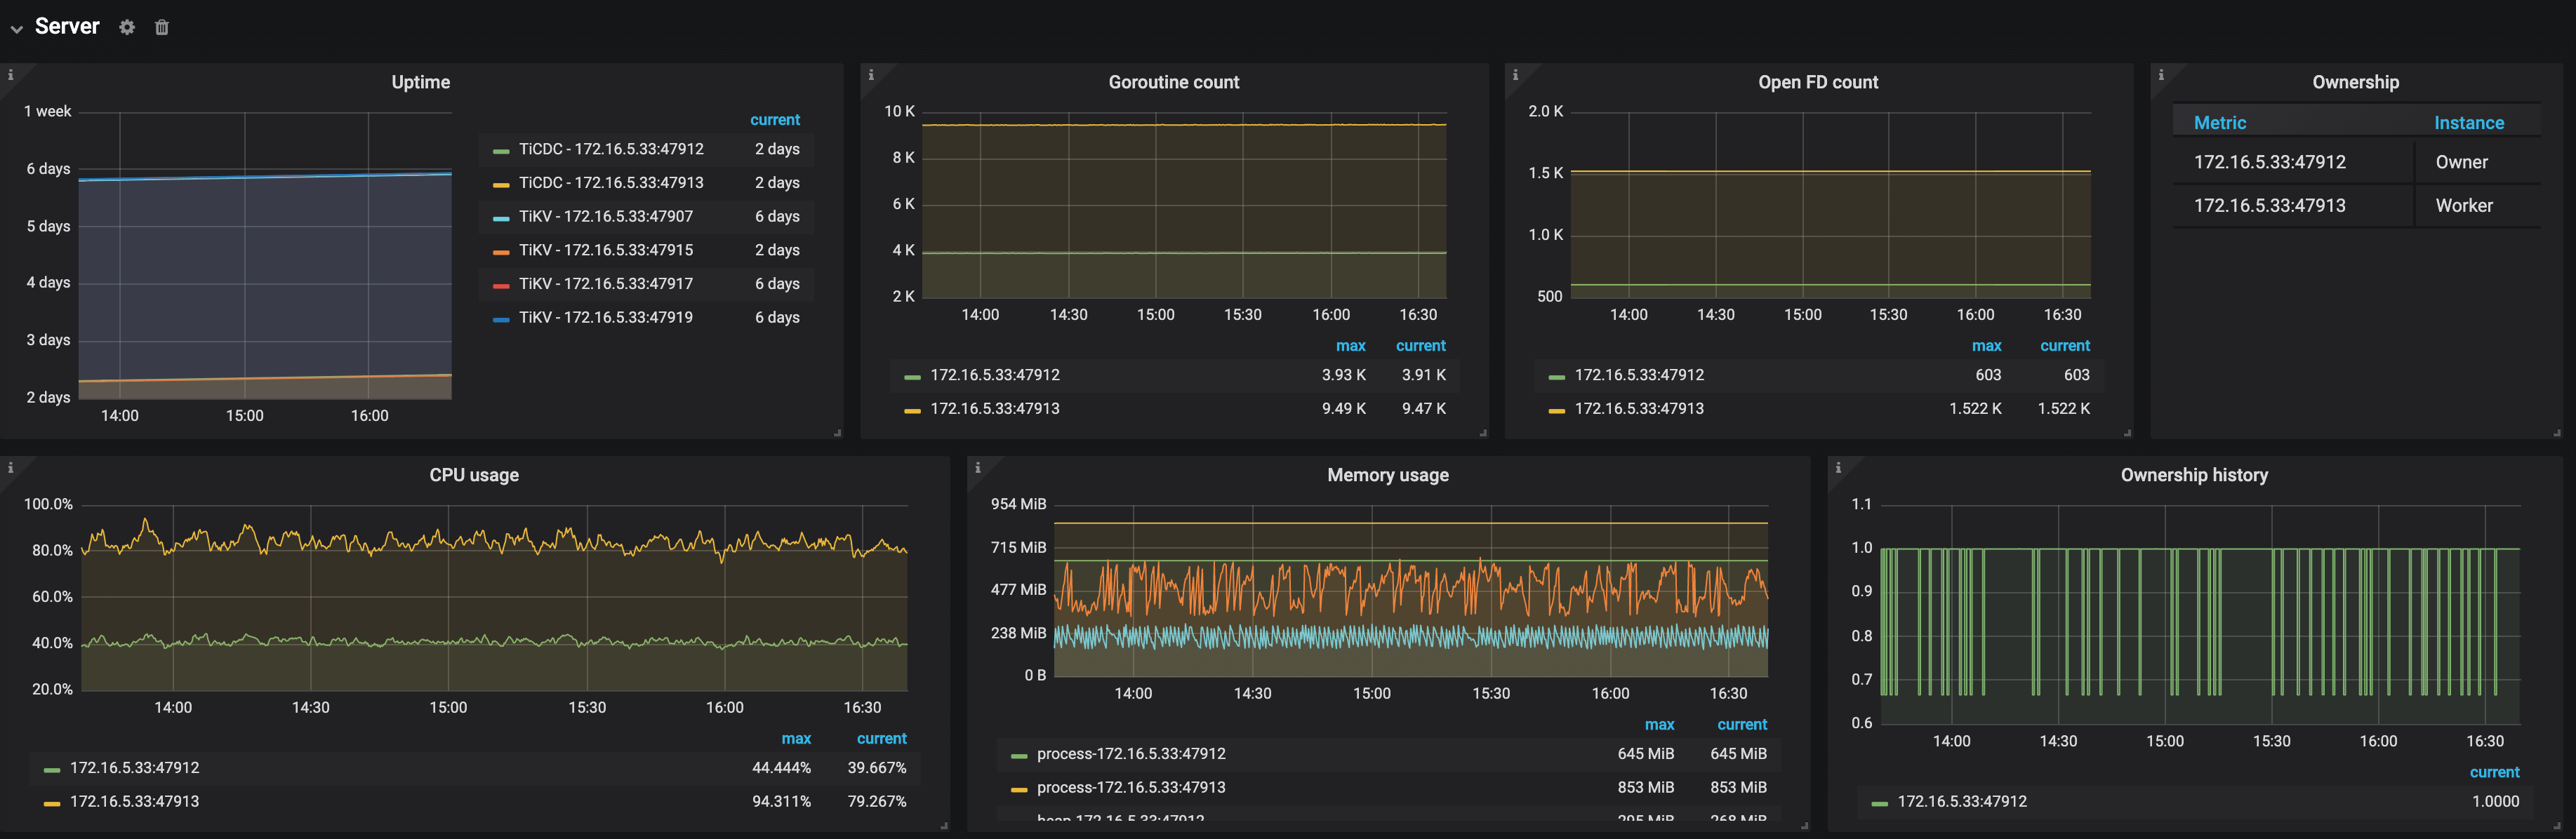
The description of each metric in the Server panel is as follows:
- Uptime: The time for which TiKV nodes and TiCDC nodes have been running
- Goroutine count: The number of goroutines of a TiCDC node
- Open FD count: The number of file handles opened by TiCDC nodes
- Ownership: The current status of nodes in the TiCDC cluster
- Ownership history: The ownership history of the TiCDC cluster
- CPU usage: The CPU usage of TiCDC nodes
- Memory usage: The memory usage of TiCDC nodes
Changefeed
The following is an example of the Changefeed panel:
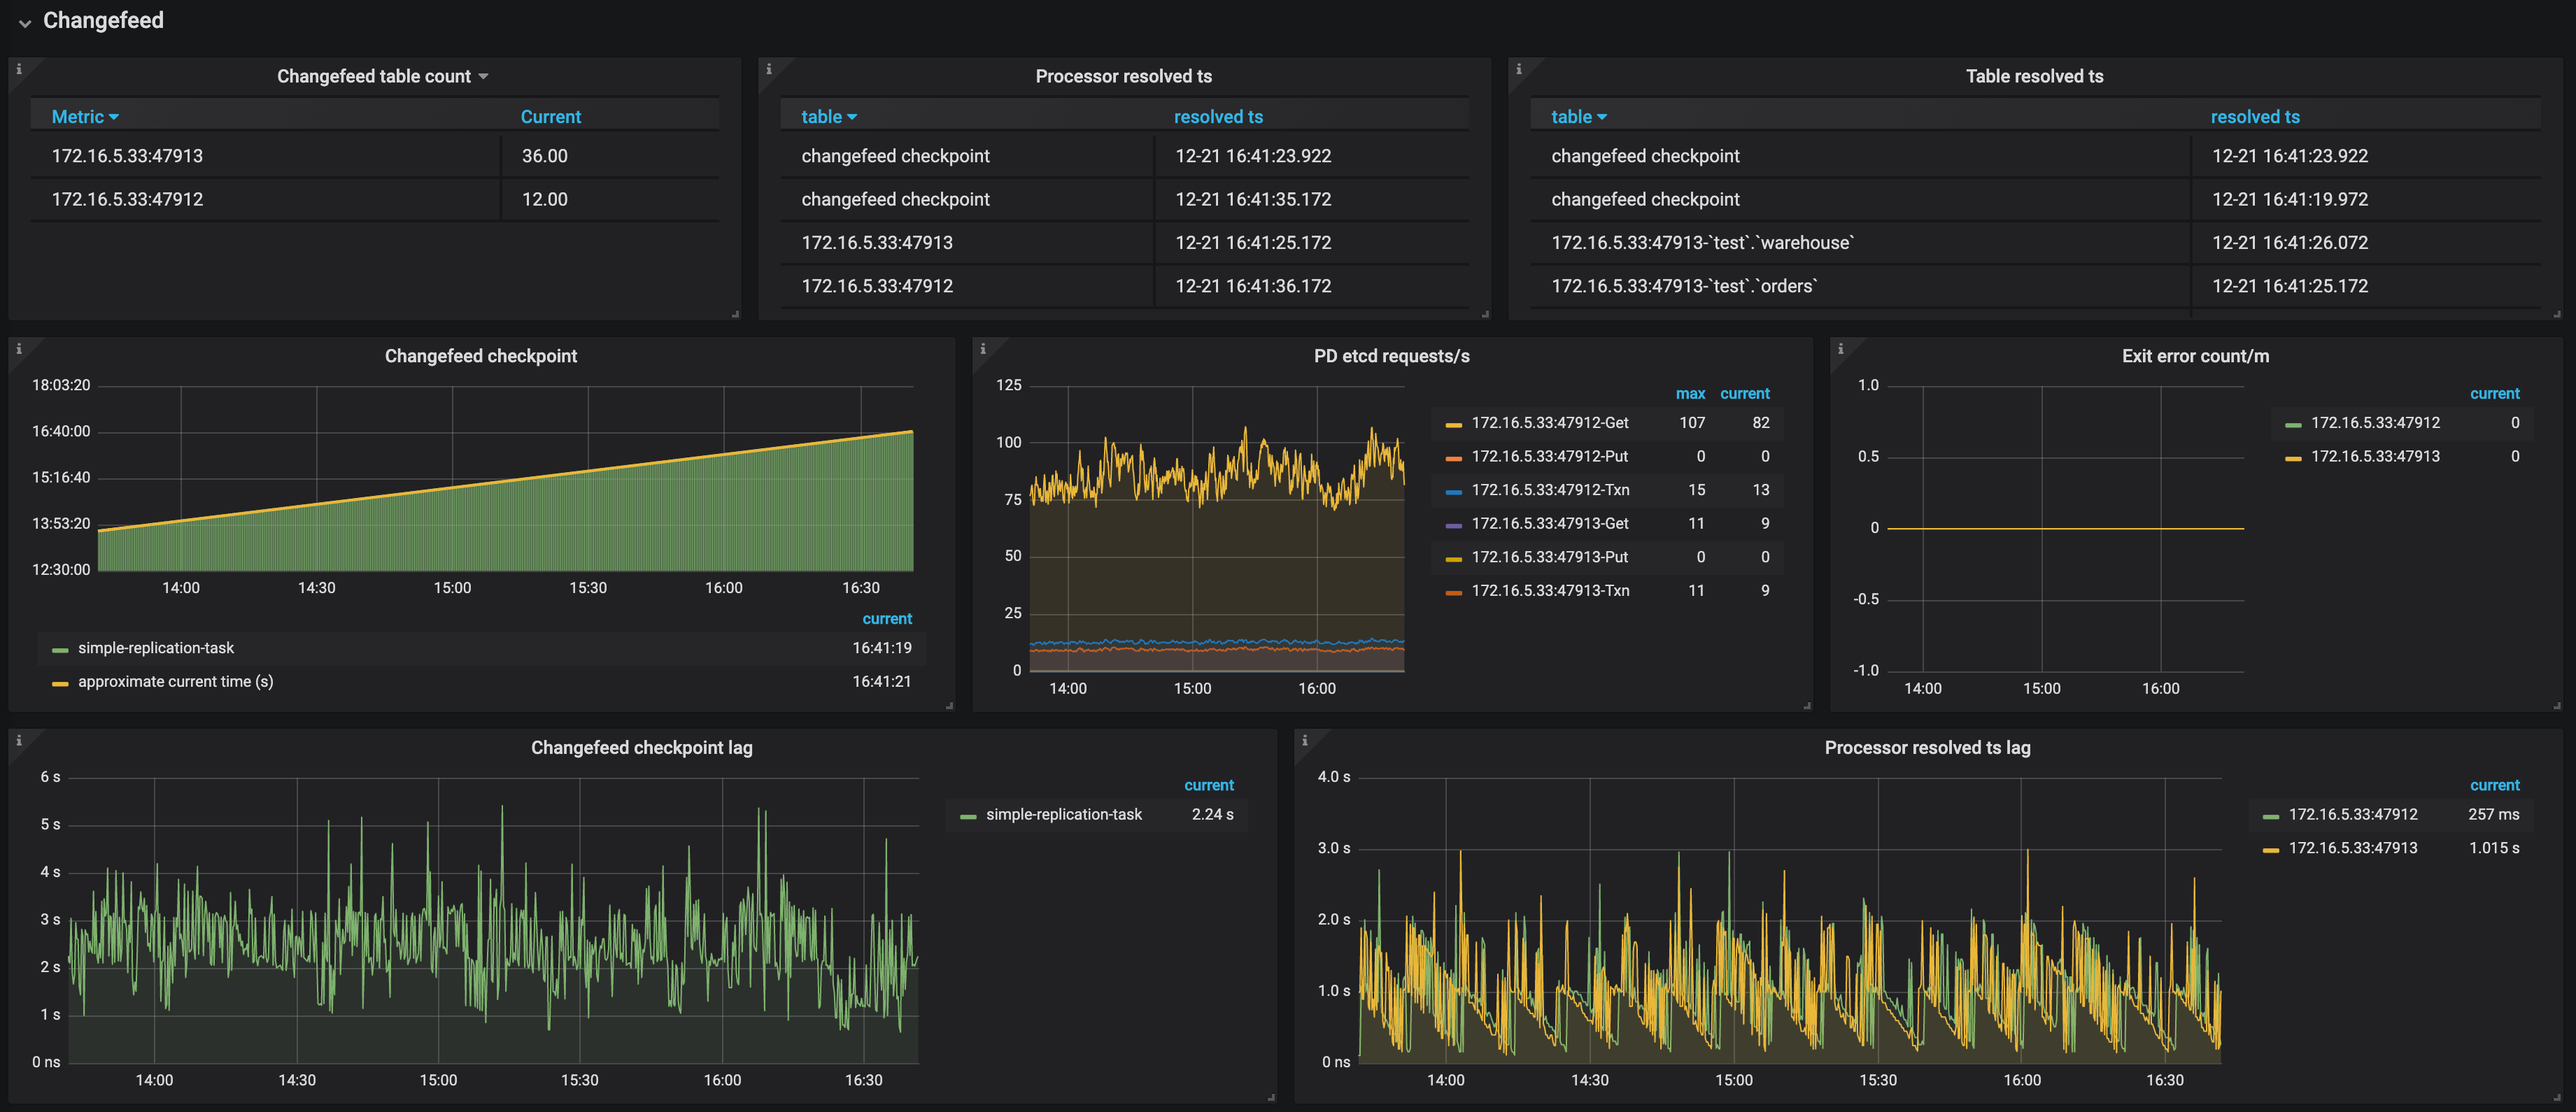
- Changefeed table count: The number of tables that each TiCDC node needs to replicate in the replication task
- Processor resolved ts: The timestamps that have been resolved in the TiCDC cluster
- Table resolved ts: The replication progress of each table in the replication task
- Changefeed checkpoint: The progress of replicating data to the downstream. Normally, the green bars are connected to the yellow line
- PD etcd requests/s: The number of requests that a TiCDC node sends to PD per second
- Exit error count/m: The number of errors that interrupt the replication task per minute
- Changefeed checkpoint lag: The progress lag of data replication (the unit is second) between the upstream and the downstream
- Processor resolved ts lag: The progress lag of data replication (the unit is second) between the upstream and TiCDC nodes
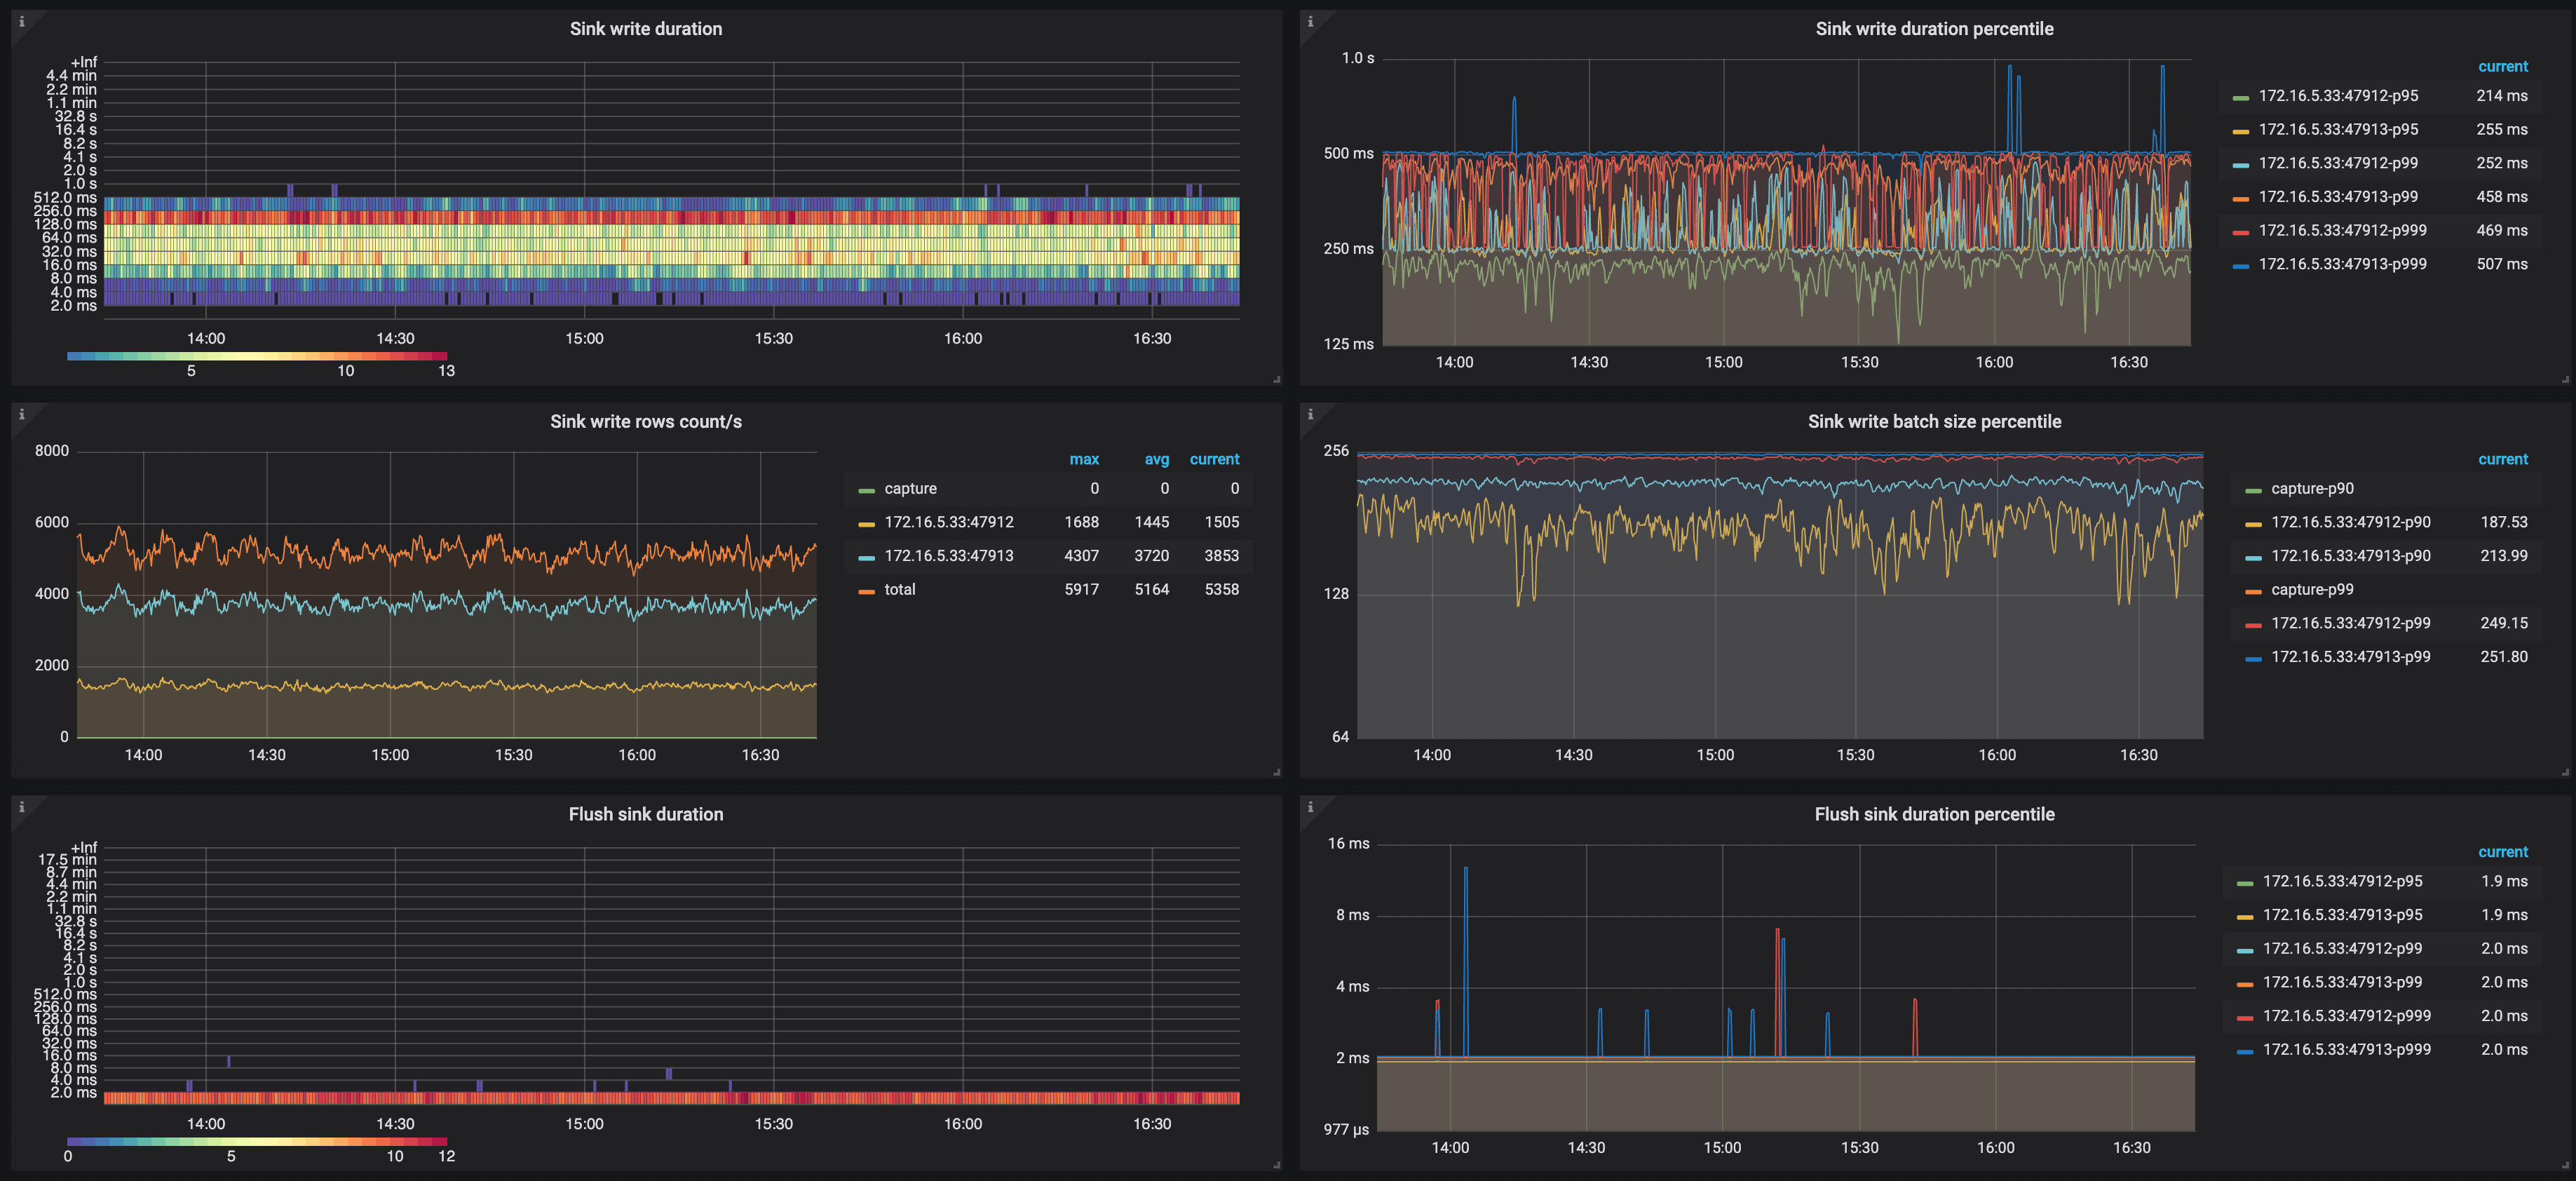
- Sink write duration: The histogram of the time spent by TiCDC writing a transaction change to the downstream
- Sink write duration percentile: The time (P95, P99, and P999) spent by TiCDC writing a transaction change to the downstream within one second
- Flush sink duration: The histogram of the time spent by TiCDC asynchronously flushing data to the downstream
- Flush sink duration percentile: The time (P95, P99, and P999) spent by TiCDC asynchronously flushing data to the downstream within one second
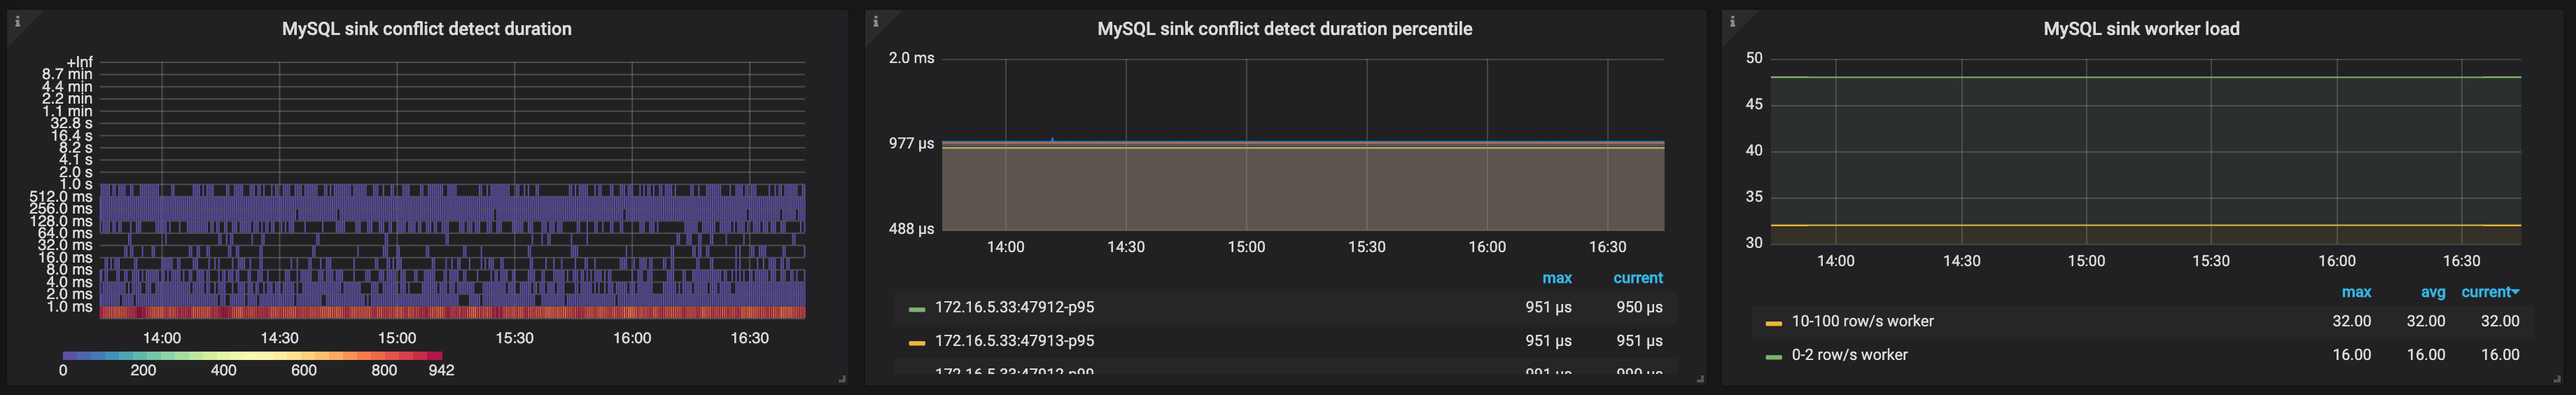
- MySQL sink conflict detect duration: The histogram of the time spent on detecting MySQL sink conflicts
- MySQL sink conflict detect duration percentile: The time (P95, P99, and P999) spent on detecting MySQL sink conflicts within one second
- MySQL sink worker load: The workload of MySQL sink workers of TiCDC nodes
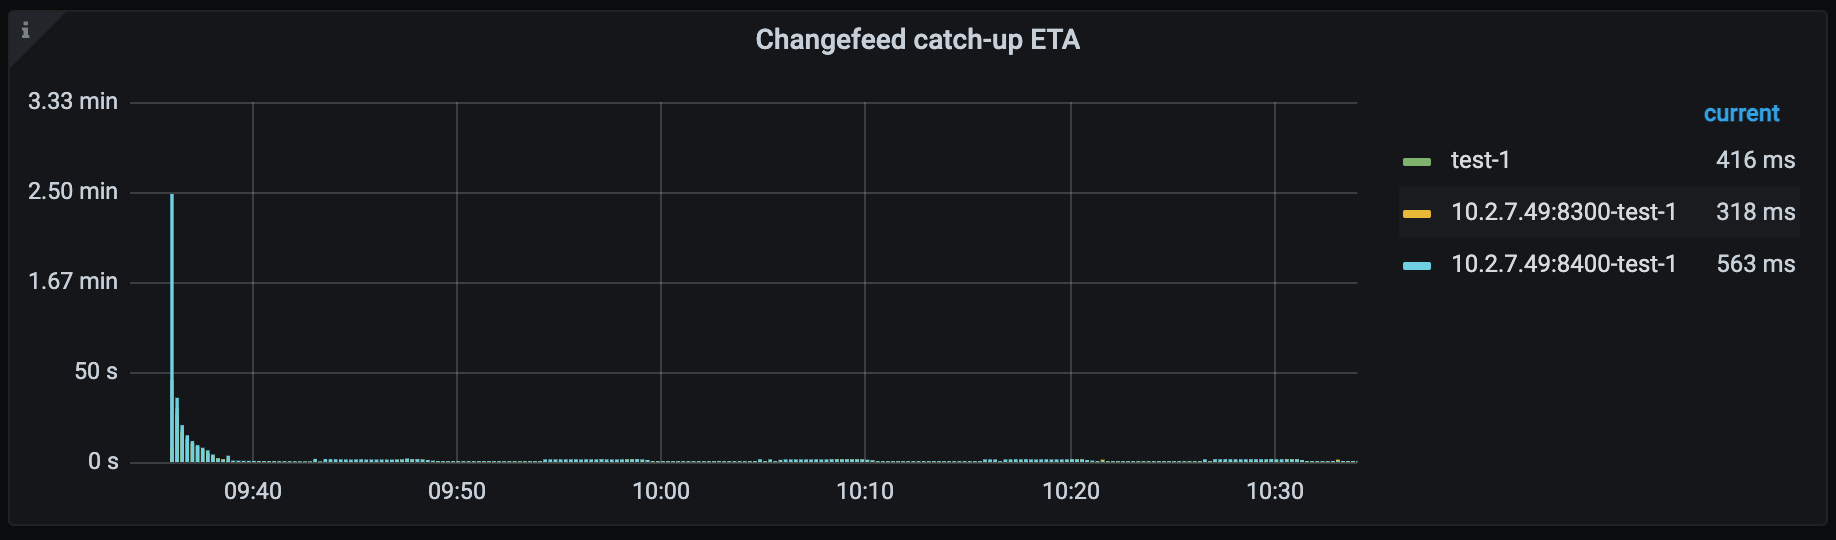
- Changefeed catch-up ETA: The estimated time needed for the replication task to catch up with the upstream cluster data. When the upstream write speed is faster than the TiCDC replication speed, the metric might be extremely large. Because TiCDC replication speed is subject to many factors, this metric is for reference only and might not be the actual replication time.
Events
The following is an example of the Events panel:
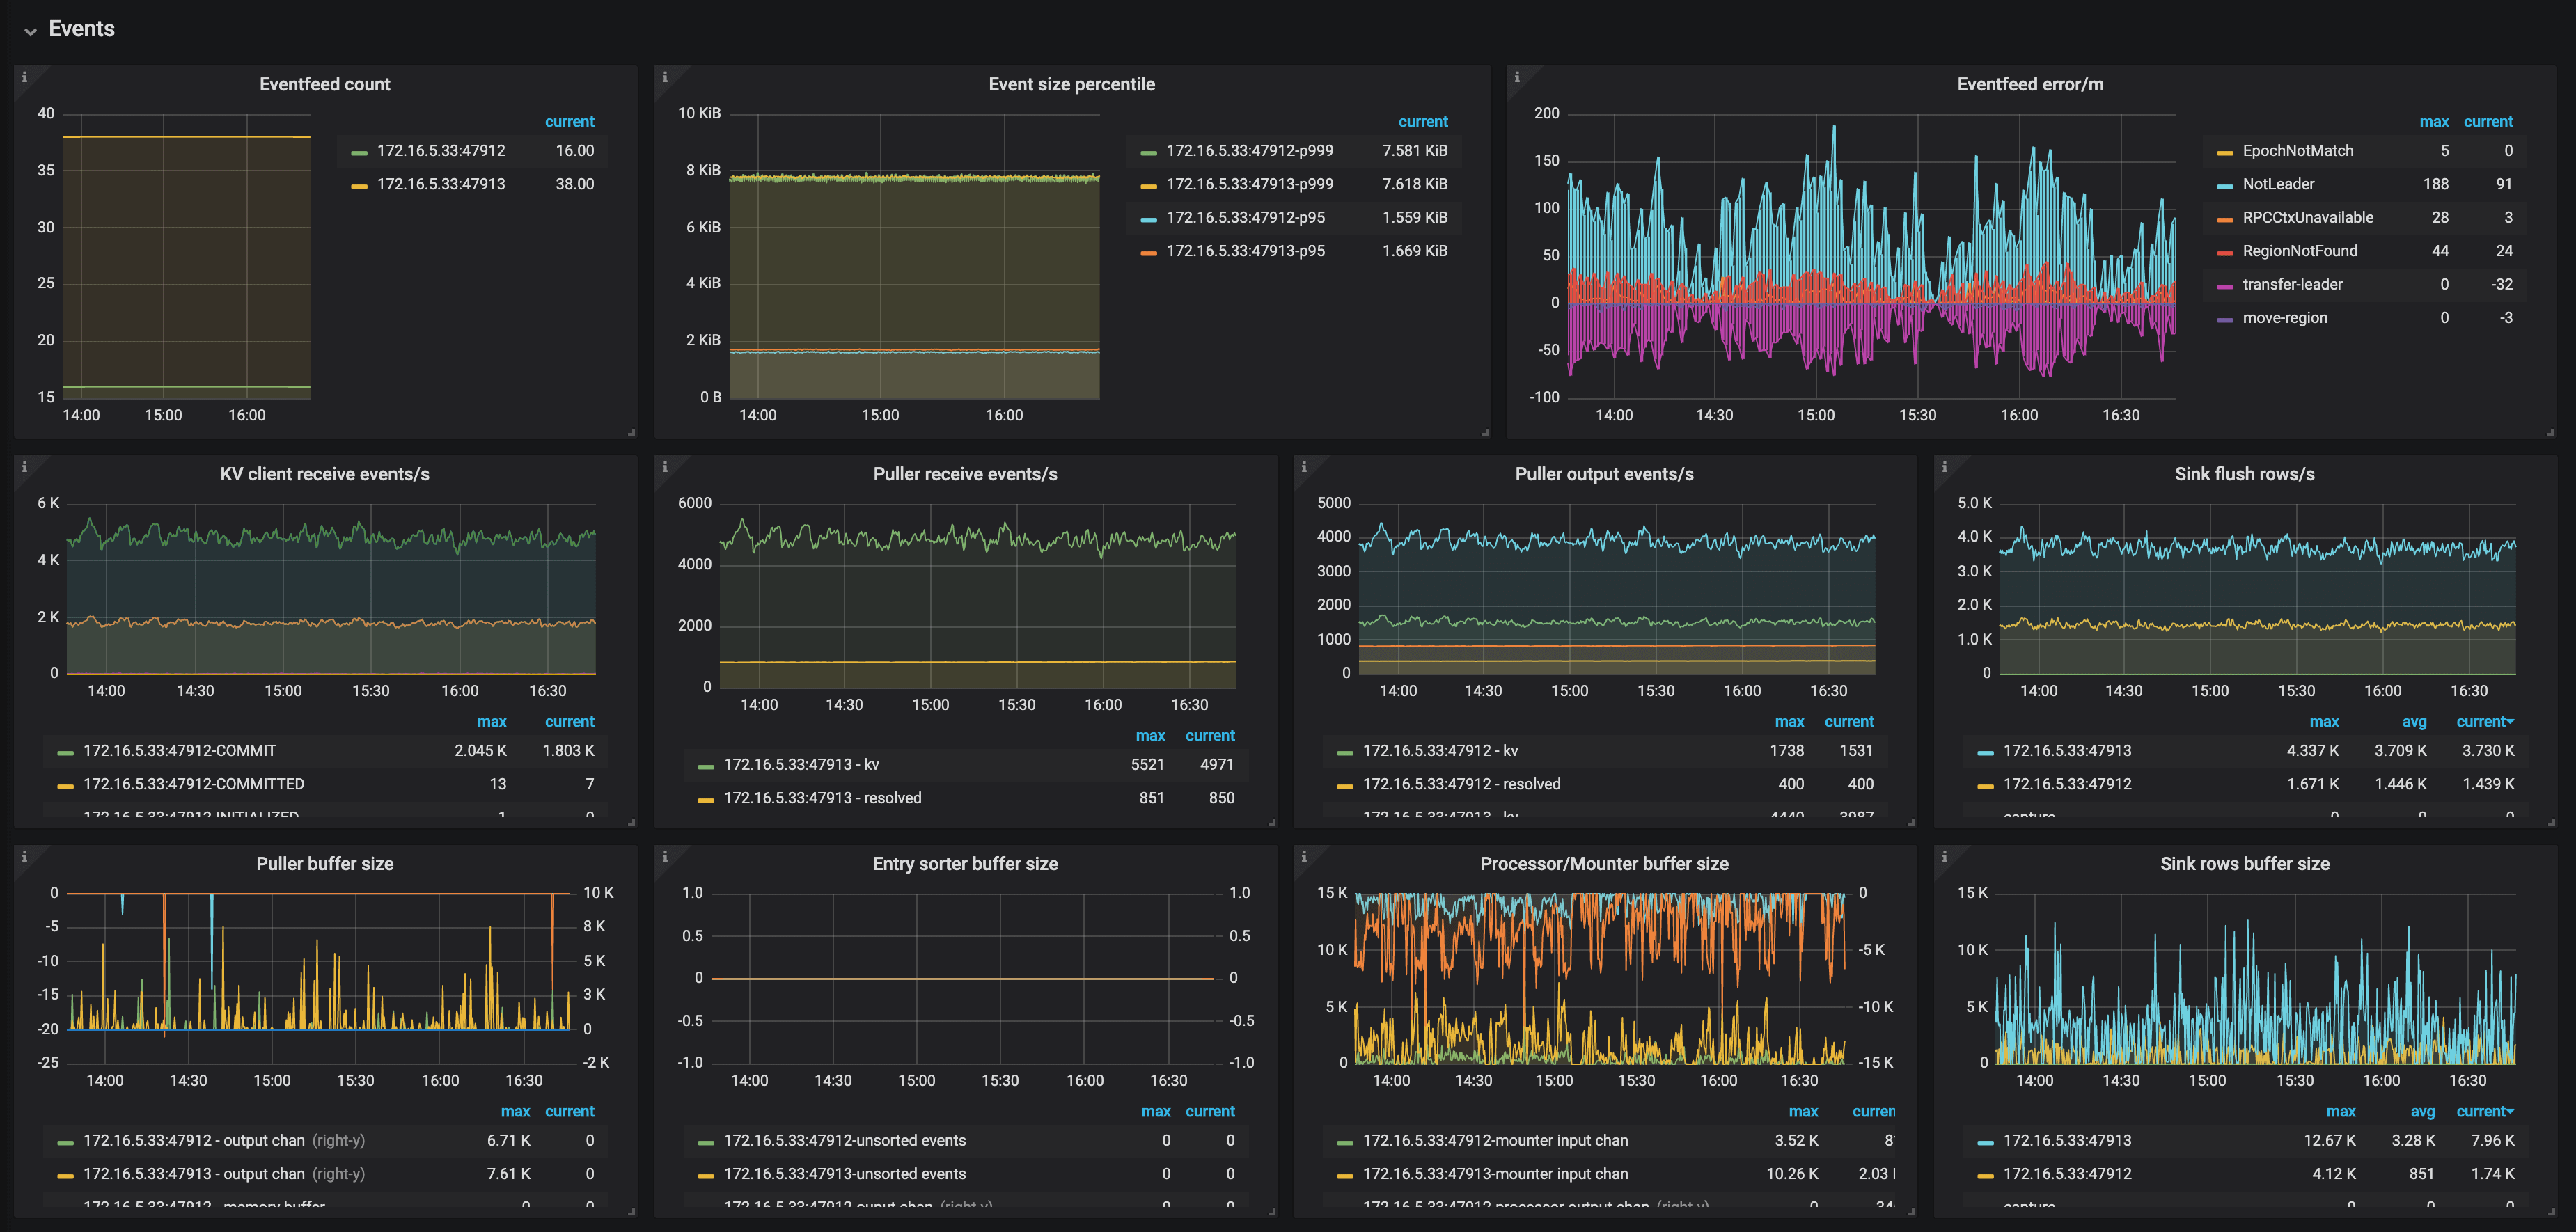
The description of each metric in the Events panel is as follows:
- Eventfeed count: The number of Eventfeed RPC requests of TiCDC nodes
- Event size percentile: The event size (P95, P99, and P999) which TiCDC receives from TiKV within one second
- Eventfeed error/m: The number of errors reported by Eventfeed RPC requests of TiCDC nodes per minute
- KV client receive events/s: The number of events that the KV client module of TiCDC nodes receives from TiKV per second
- Puller receive events/s: The number of events that the Puller module of TiCDC nodes receives from the KV client per second
- Puller output events/s: The number of events that the Puller module of TiCDC nodes sends to the Sorter module per second
- Sink flush rows/s: The number of events that TiCDC nodes write to the downstream per second
- Puller buffer size: The number of events that TiCDC nodes cache in the Puller module
- Entry sorter buffer size: The number of events that TiCDC nodes cache in the Sorter module
- Processor/Mounter buffer size: The number of events that TiCDC nodes cache in the Processor module and the Mounter module
- Sink row buffer size: The number of events that TiCDC nodes cache in the Sink module
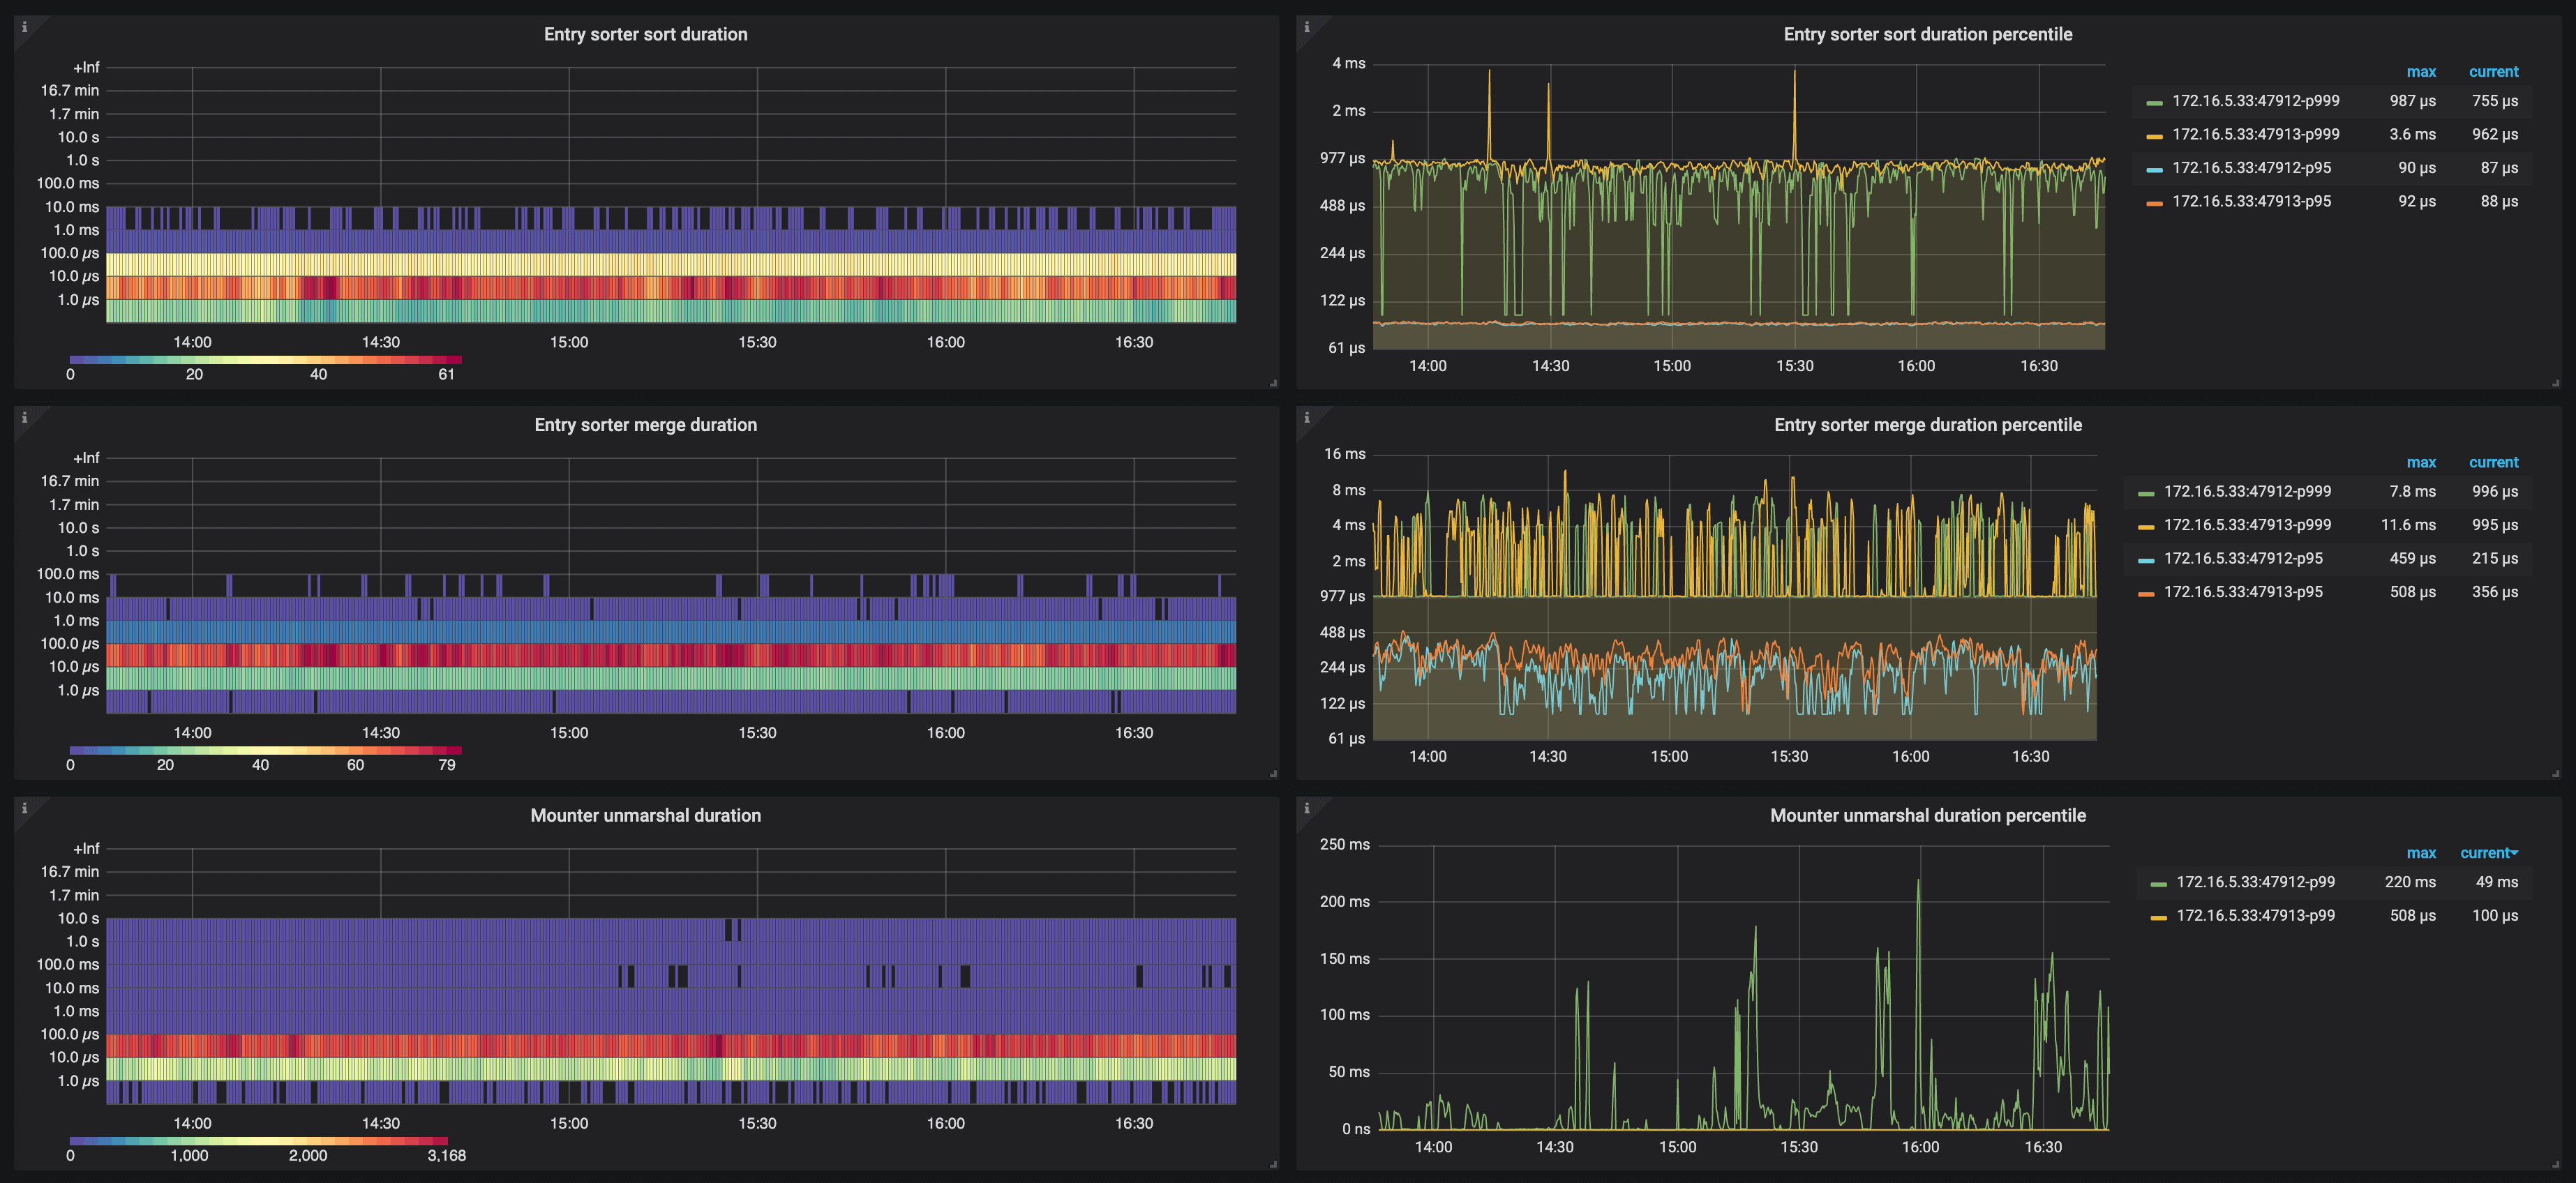
- Entry sorter sort duration: The histogram of the time spent by TiCDC nodes sorting events
- Entry sorter sort duration percentile: The time (P95, P99, and P999) spent by TiCDC sorting events within one second
- Entry sorter merge duration: The histogram of the time spent by TiCDC nodes merging sorted events
- Entry sorter merge duration percentile: The time (P95, P99, and P999) spent by TiCDC merging sorted events within one second
- Mounter unmarshal duration: The histogram of the time spent by TiCDC nodes unmarshalling events
- Mounter unmarshal duration percentile: The time (P95, P99, and P999) spent by TiCDC unmarshalling events within one second
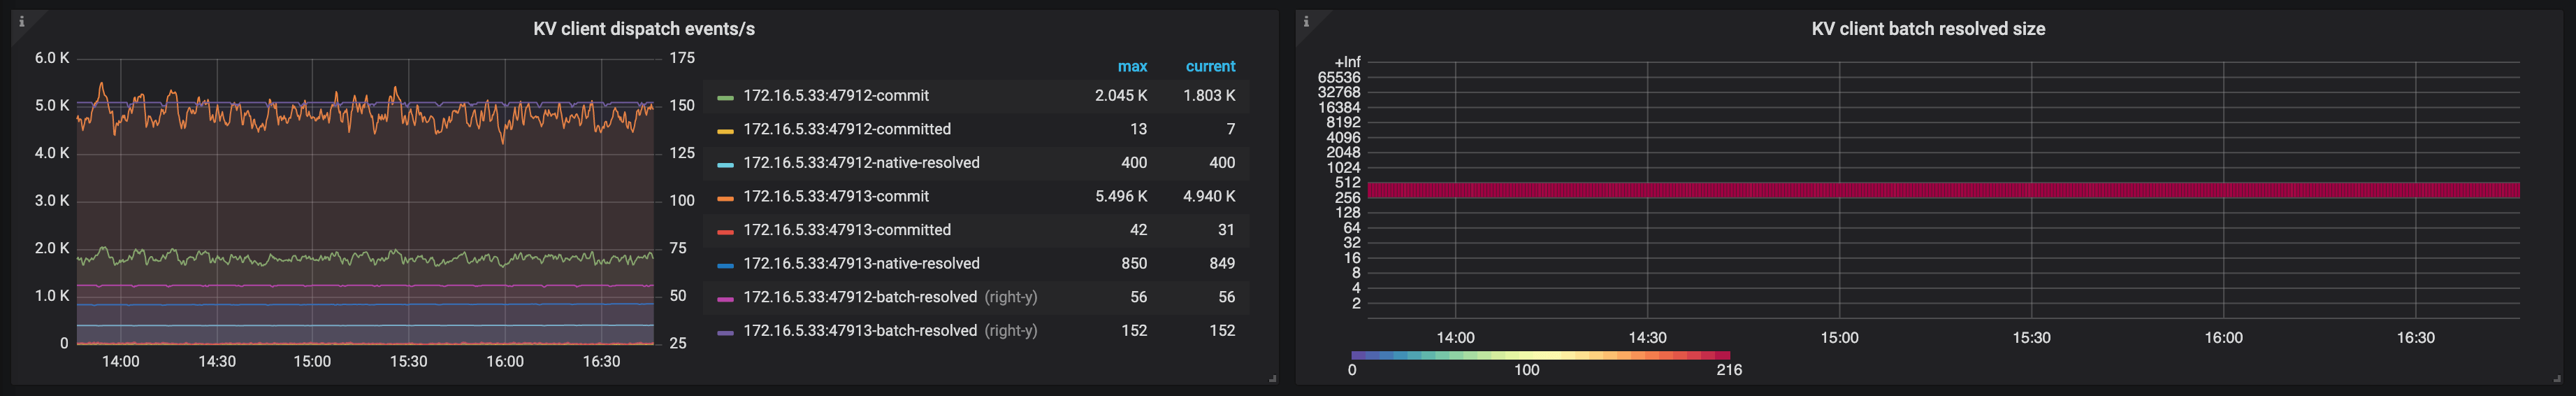
- KV client dispatch events/s: The number of events that the KV client module dispatches among the TiCDC nodes
- KV client batch resolved size: The batch size of resolved timestamp messages that TiKV sends to TiCDC
TiKV
The following is an example of the TiKV panel:
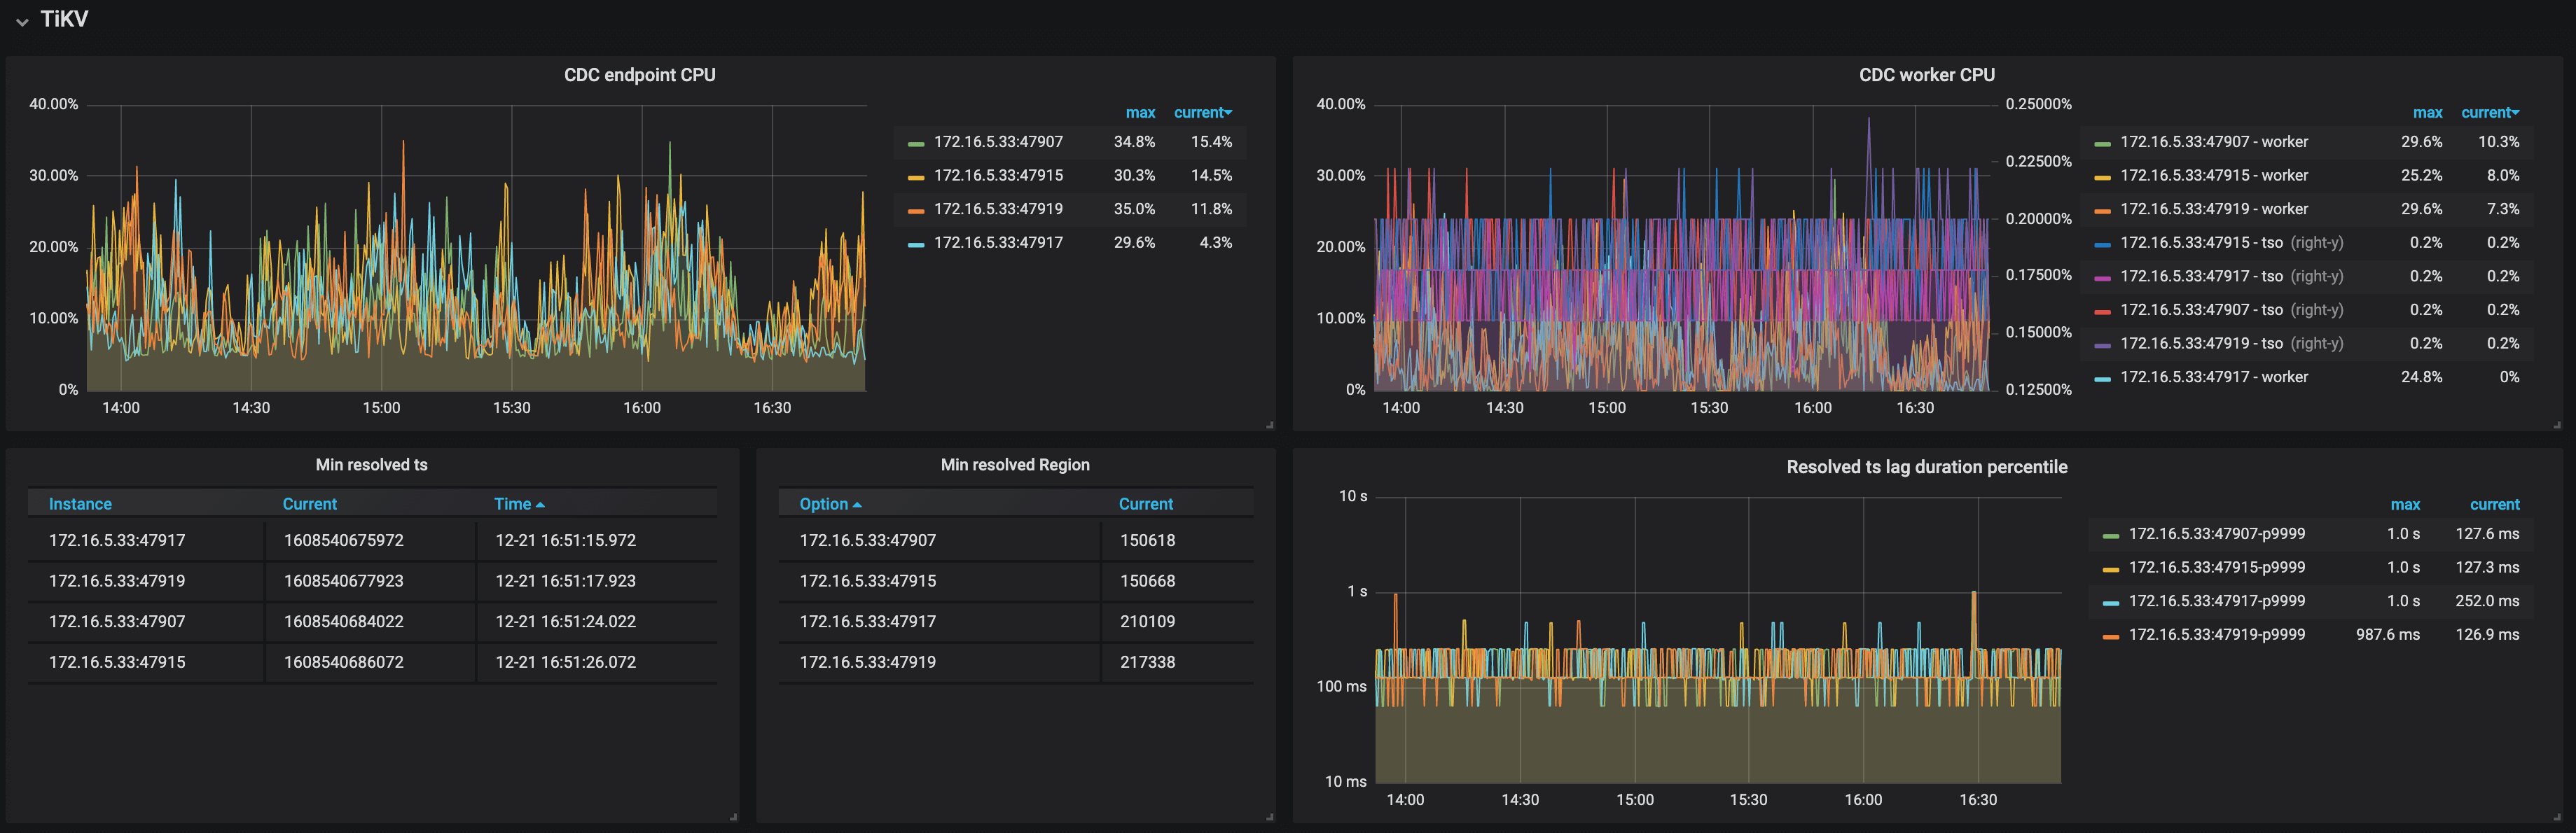
The description of each metric in the TiKV panel is as follows:
- CDC endpoint CPU: The CPU usage of the CDC endpoint threads on TiKV nodes
- CDC worker CPU: The CPU usage of the CDC worker threads on TiKV nodes
- Min resolved ts: The minimum resolved timestamp on TiKV nodes
- Min resolved region: The Region ID of the minimum resolved timestamp on TiKV nodes
- Resolved ts lag duration percentile: The lag between the minimum resolved timestamp on TiKV nodes and the current time
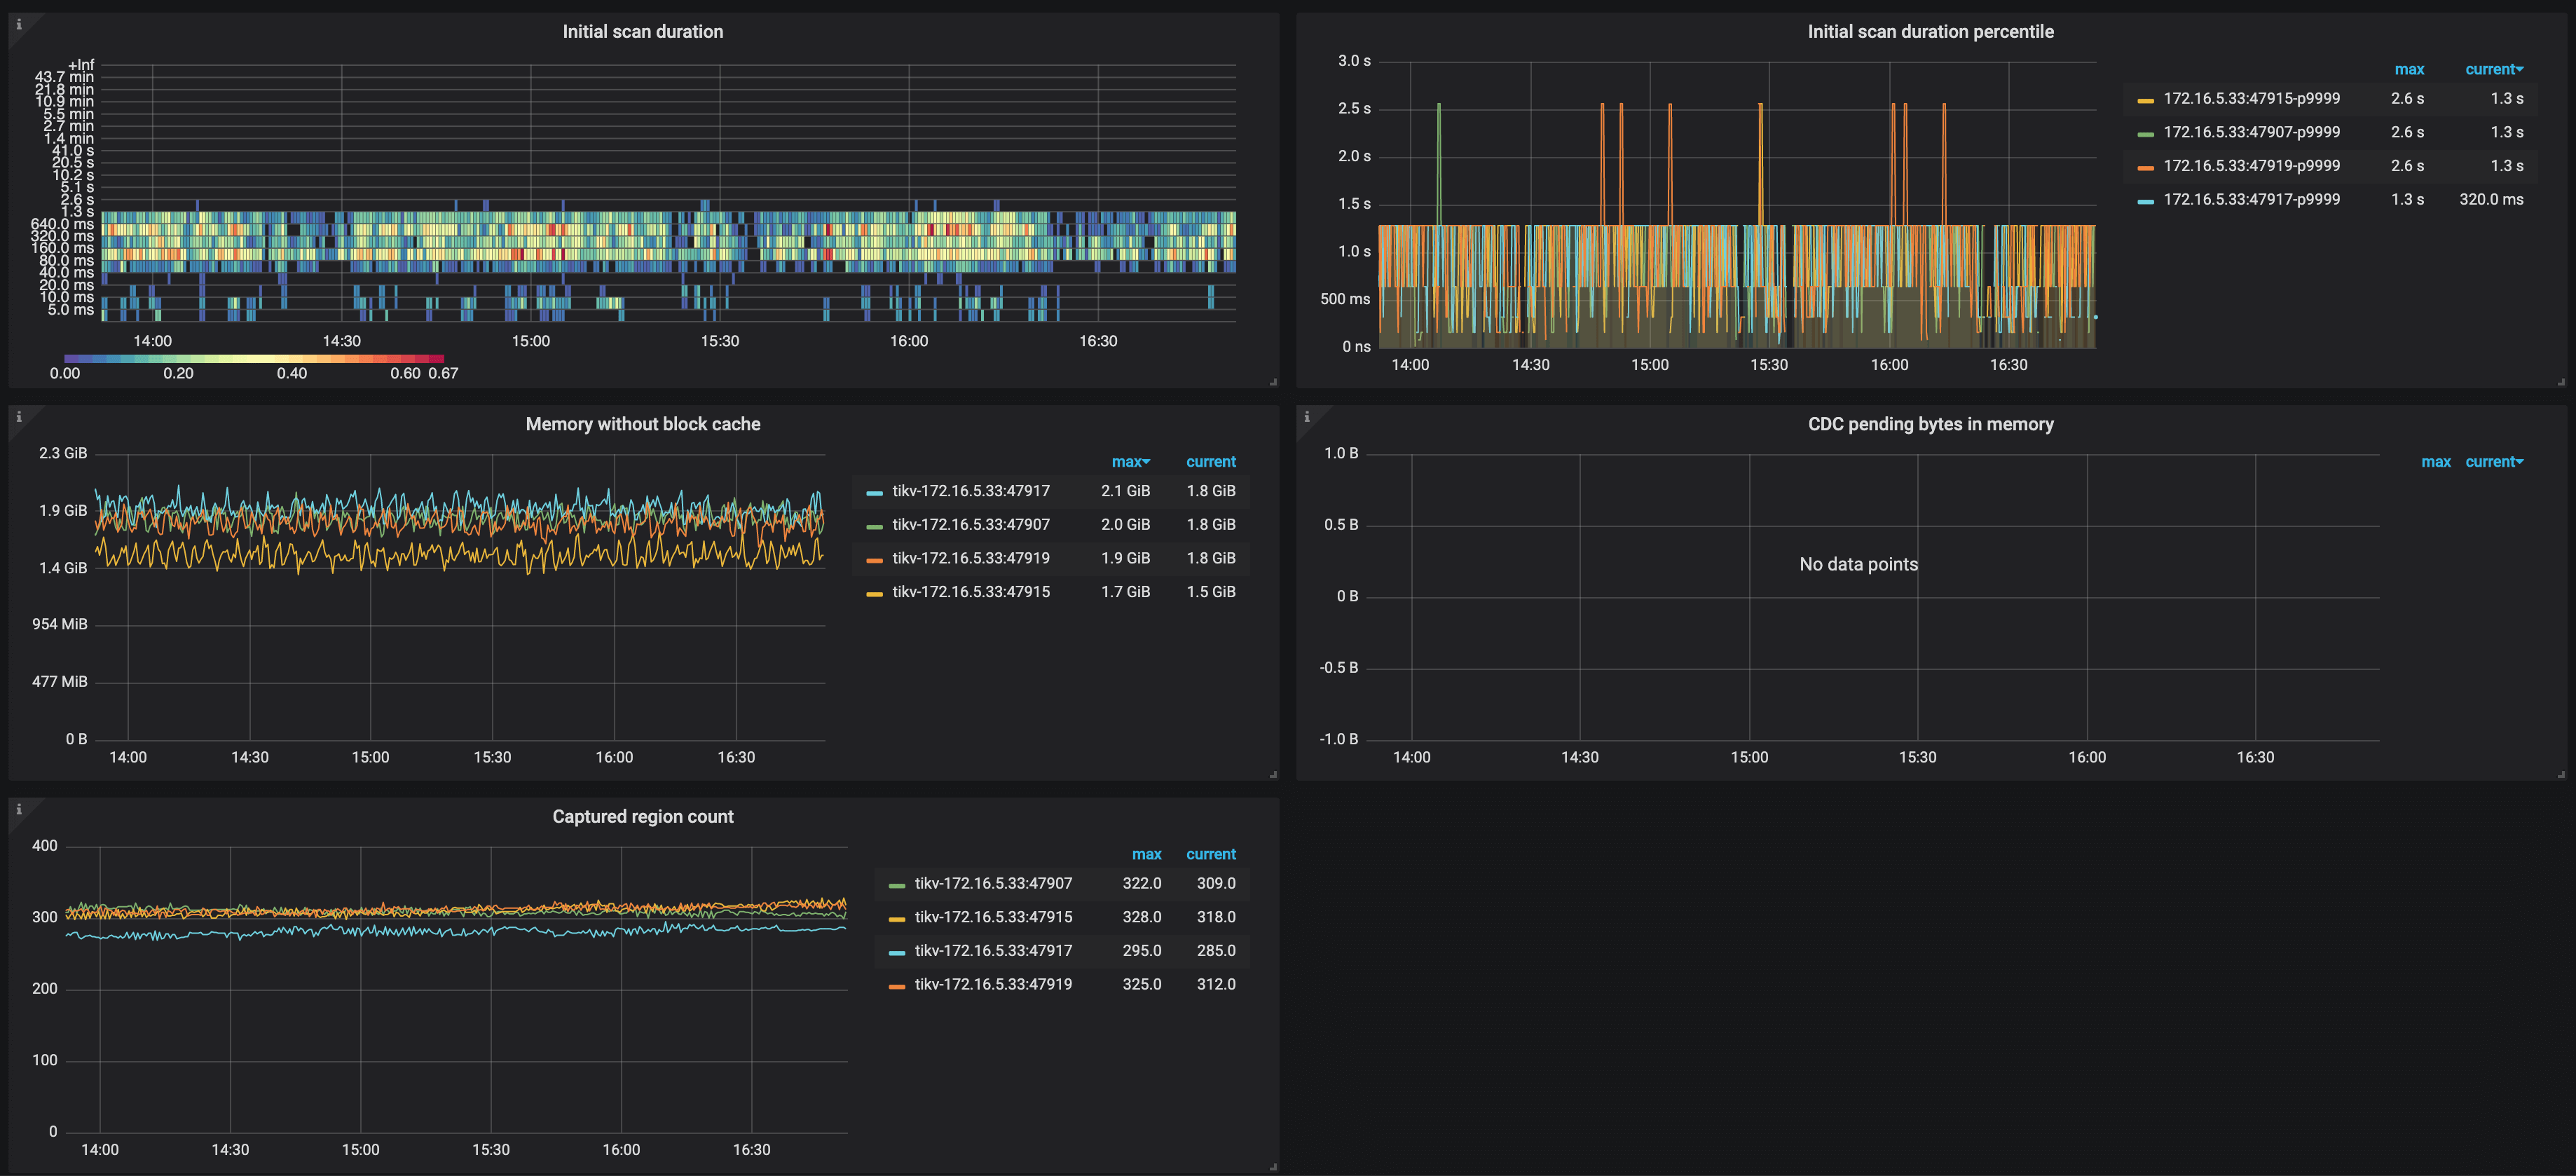
- Initial scan duration: The histogram of the time spent on incremental scan when TiKV nodes connect to TiCDC nodes
- Initial scan duration percentile: The time (P95, P99, and P999) spent on the incremental scan of TiKV nodes within one second
- Memory without block cache: The memory usage of TiKV nodes excluding the RocksDB block cache
- CDC pending bytes in memory: The memory usage of CDC module on TiKV nodes
- Captured region count: The number of event-capturing Regions on TiKV nodes