TiDB Dashboard Resource Manager Page
To implement resource isolation using the Resource Control feature, cluster administrators can create resource groups and set quotas for each group. Before resource planning, you need to know the overall capacity of the cluster. This document helps you view the information about resource control, so you can estimate the cluster capacity before resource planning and allocate resources more effectively.
Access the page
You can use one of the following two methods to access the Resource Manager page:
After logging in to TiDB Dashboard, click Resource Manager in the left navigation menu.
Visit http://127.0.0.1:2379/dashboard/#/resource_manager in your browser. Replace
127.0.0.1:2379with the actual PD instance address and port.
Resource Manager page
The following figure shows the Resource Manager details page:
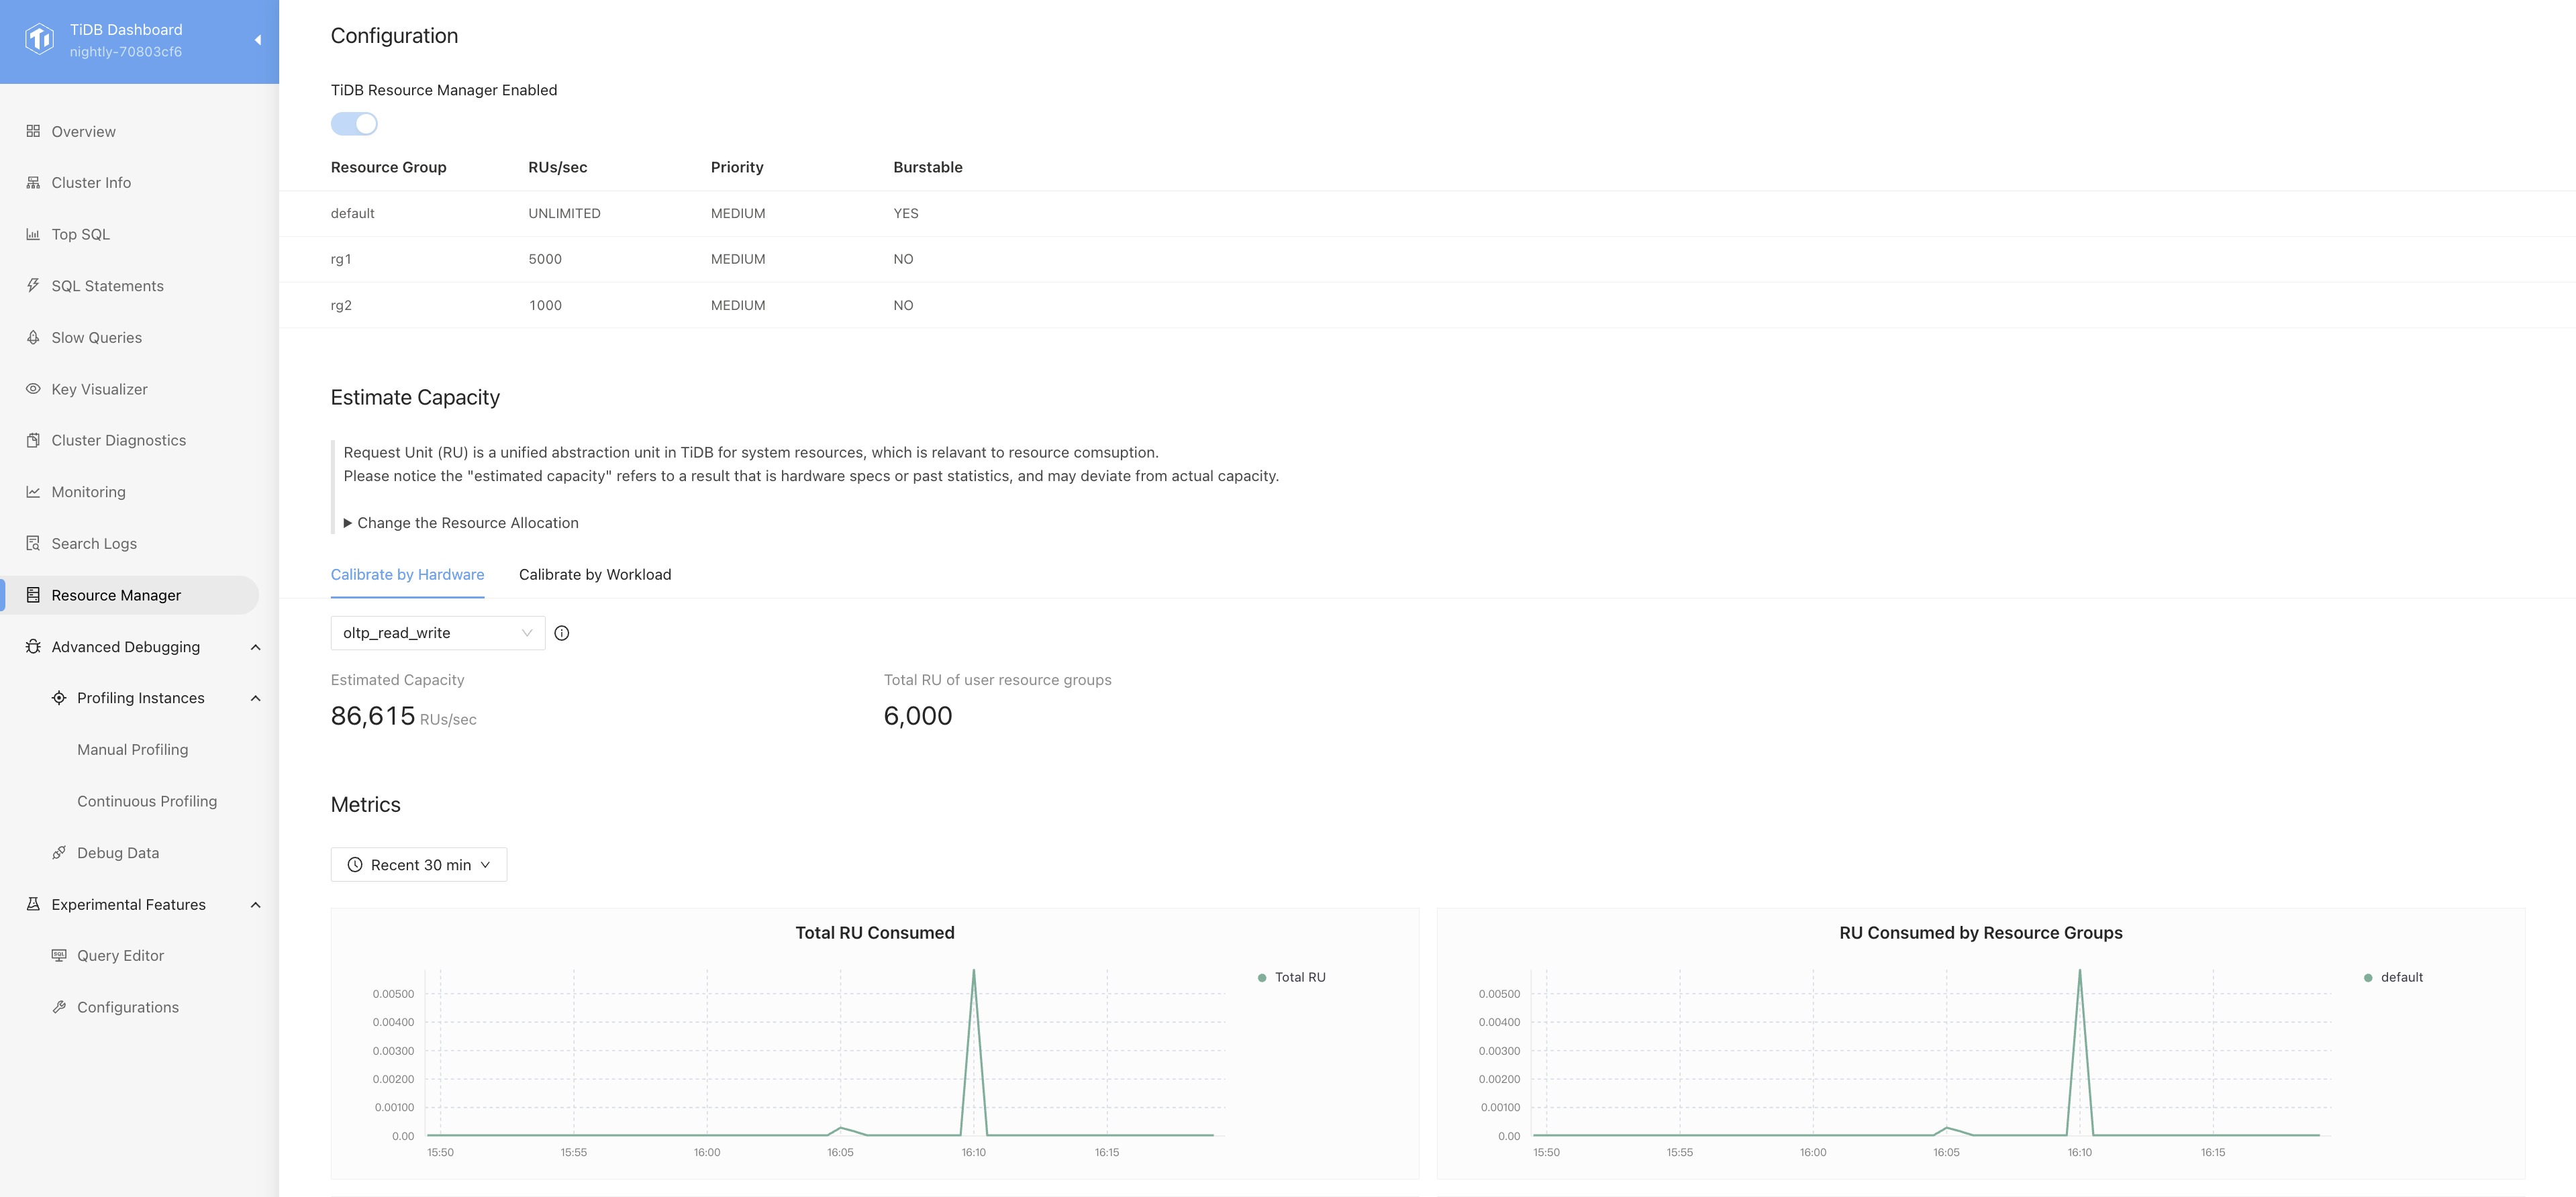
The Resource Manager page contains the following three sections:
Configuration: This section displays the data obtained from the
RESOURCE_GROUPStable of TiDB. It contains the information about all resource groups. For more information, seeRESOURCE_GROUPS.Estimate Capacity: Before resource planning, you need to know the overall capacity of the cluster. You can use one of the following methods:
Metrics: By observing the metrics on the panels, you can understand the current overall resource consumption status of the cluster.
Estimate Capacity
Before resource planning, you need to know the overall capacity of the cluster. TiDB provides two methods to estimate the capacity of Request Unit (RU) in the current cluster:
Estimate capacity based on hardware deployment
TiDB accepts the following workload types:
tpcc: applies to workloads with heavy data write. It is estimated based on a workload model similar toTPC-C.oltp_write_only: applies to workloads with heavy data write. It is estimated based on a workload model similar tosysbench oltp_write_only.oltp_read_write: applies to workloads with even data read and write. It is estimated based on a workload model similar tosysbench oltp_read_write.oltp_read_only: applies to workloads with heavy data read. It is estimated based on a workload model similar tosysbench oltp_read_only.
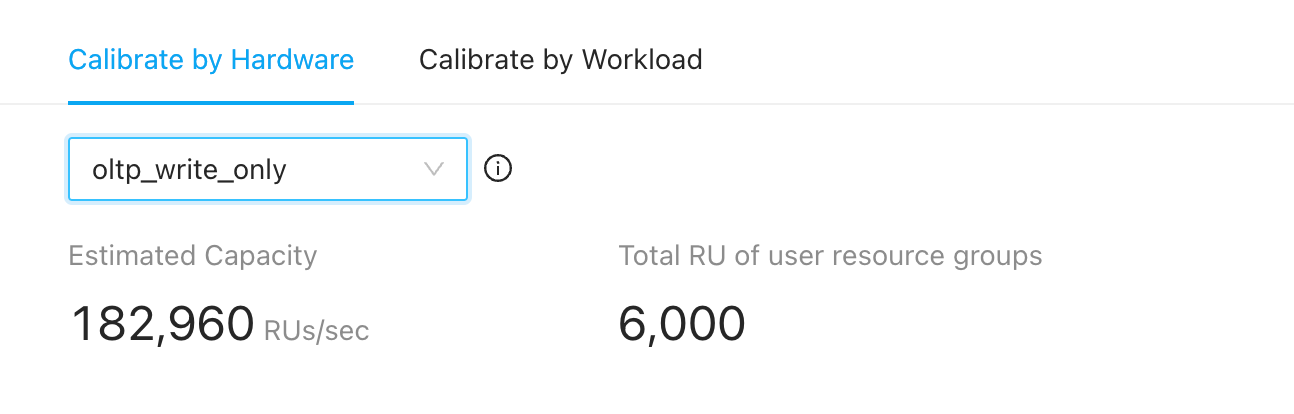
The Total RU of user resource groups represents the total amount of RU for all user resource groups, excluding the
defaultresource group. If this value is more than the estimated capacity, the system triggers an alert. By default, the system allocates unlimited usage to the predefineddefaultresource group. When all users belong to thedefaultresource group, resources are allocated in the same way as when resource control is disabled.Estimate capacity based on actual workload
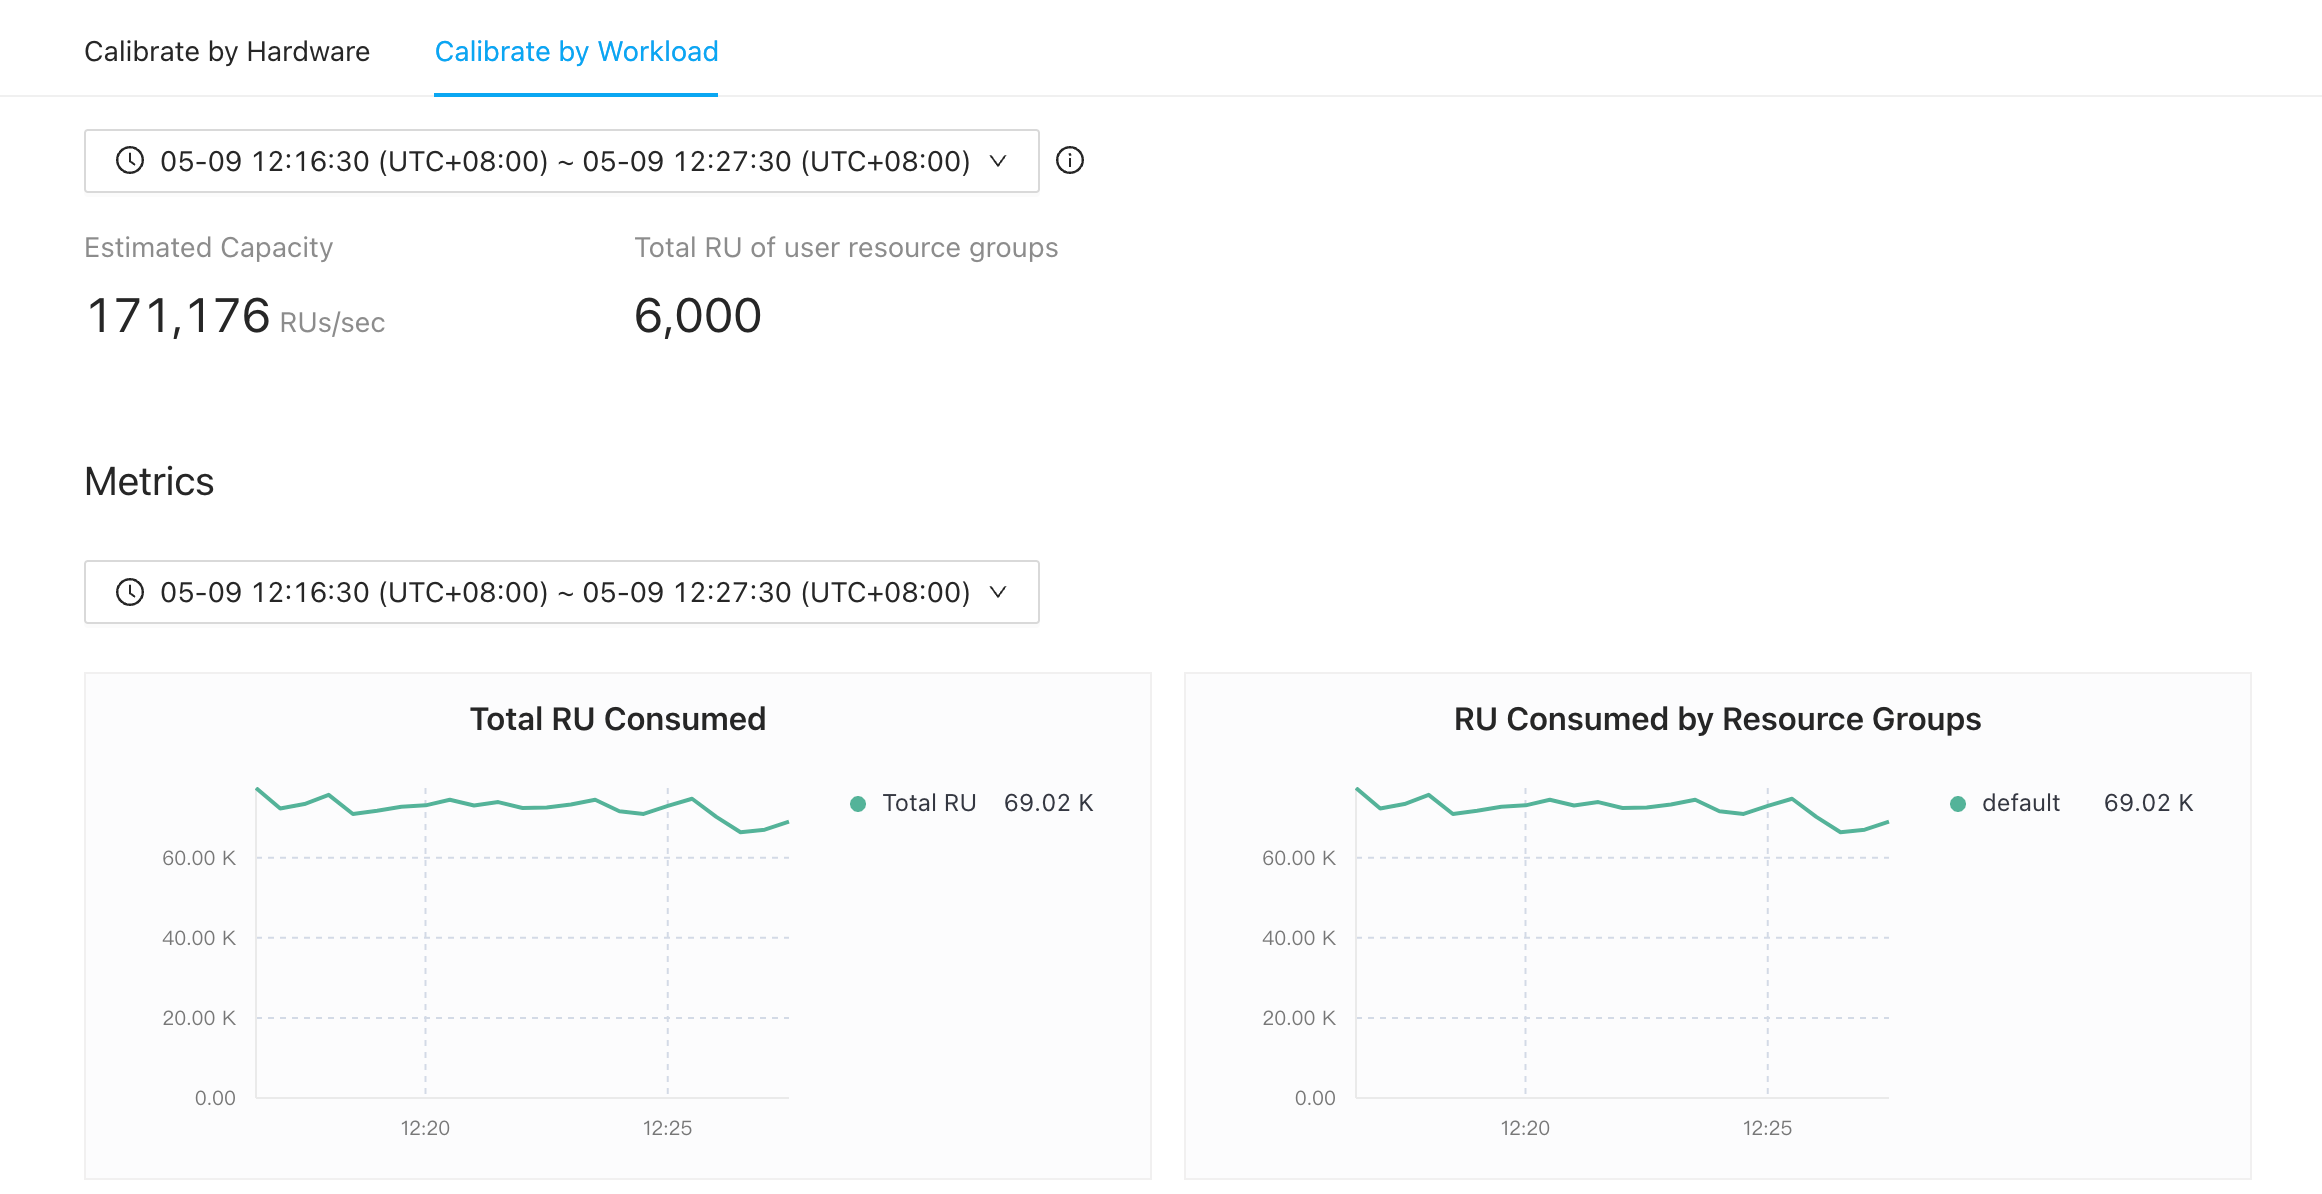
You can select a time range for estimation within the range of 10 minutes to 24 hours. The time zone used is the same as that of the front-end user.
When the time window range does not fall between 10 minutes and 24 hours, the following error is displayed
ERROR 1105 (HY000): the duration of calibration is too short, which could lead to inaccurate output. Please make the duration between 10m0s and 24h0m0s.The monitoring metrics for the capacity estimation based on the actual workload feature include
tikv_cpu_quota,tidb_server_maxprocs,resource_manager_resource_unit, andprocess_cpu_usage. If the CPU quota monitoring data is empty, there will be an error with the corresponding monitoring metric name, for example,Error 1105 (HY000): There is no CPU quota metrics, metrics 'tikv_cpu_quota' is empty.If the workload in the time window is too low, or the
resource_manager_resource_unitandprocess_cpu_usagemonitoring data is missing, an error will be reportedError 1105 (HY000): The workload in selected time window is too low, with which TiDB is unable to reach a capacity estimation; please select another time window with higher workload, or calibrate resource by hardware instead. In addition, because TiKV does not monitor CPU utilization on macOS, it does not support capacity estimation based on the actual workload, and will also report this error.
You can select an appropriate time range using CPU Usage in the Metrics section.
Metrics
By observing the metrics on the panels, you can understand the current overall resource consumption status of the cluster. The monitoring metrics and their meanings are as follows:
- Total RU Consumed: The total consumption of Request Units counted in real time.
- RU Consumed by Resource Groups: The number of Request Units consumed by resource groups in real time.
- TiDB
- CPU Quota: The maximum CPU usage of TiDB.
- CPU Usage: The total CPU usage of all TiDB instances.
- TiKV
- CPU Quota: The maximum CPU usage of TiKV.
- CPU Usage: The total CPU usage of all TiKV instances.
- IO MBps: The total I/O throughput of all TiKV instances.