TiDB Memory Control
Currently, TiDB can track the memory quota of a single SQL query and take actions to prevent OOM (out of memory) or troubleshoot OOM when the memory usage exceeds a specific threshold value. The system variable tidb_mem_oom_action specifies the action to take when a query reaches the memory limit:
- A value of
LOGmeans that queries will continue to execute when thetidb_mem_quota_querylimit is reached, but TiDB will print an entry to the log. - A value of
CANCELmeans TiDB stops executing the SQL query immediately after thetidb_mem_quota_querylimit is reached, and returns an error to the client. The error information clearly shows the memory usage of each physical execution operator that consumes memory in the SQL execution process.
Configure the memory quota of a query
The system variable tidb_mem_quota_query sets the limit for a query in bytes. Some usage examples:
-- Set the threshold value of memory quota for a single SQL query to 8GB:
SET tidb_mem_quota_query = 8 << 30;
-- Set the threshold value of memory quota for a single SQL query to 8MB:
SET tidb_mem_quota_query = 8 << 20;
-- Set the threshold value of memory quota for a single SQL query to 8KB:
SET tidb_mem_quota_query = 8 << 10;
Configure the memory usage threshold of a tidb-server instance
Since v6.5.0, you can use the system variable tidb_server_memory_limit to set the threshold for the memory usage of a tidb-server instance.
For example, set the total memory usage of a tidb-server instance to 32 GB:
SET GLOBAL tidb_server_memory_limit = "32GB";
After you set this variable, when the memory usage of a tidb-server instance reaches 32 GB, TiDB will terminate the SQL operation with the largest memory usage among all running SQL operations in order, until the memory usage of the instance drops below 32 GB. The forcibly terminated SQL operation will return the Out Of Memory Quota! error to the client.
Currently, the memory limit set by tidb_server_memory_limit DOES NOT terminate the following SQL operations:
- DDL operations
- SQL operations that contain window functions and common table expressions
When the memory usage of a tidb-server instance reaches a certain proportion of the total memory (the proportion is controlled by the system variable tidb_server_memory_limit_gc_trigger), tidb-server will try to trigger a Golang GC to relieve memory stress. To avoid frequent GCs that cause performance issues due to the instance memory fluctuating around the threshold, this GC method will trigger GC at most once every minute.
View the memory usage of the current tidb-server instance using the INFORMATION_SCHEMA system table
To view the memory usage of the current instance or cluster, you can query the system table INFORMATION_SCHEMA.(CLUSTER_)MEMORY_USAGE.
To view the memory-related operations and execution basis of the current instance or cluster, you can query the system table INFORMATION_SCHEMA.(CLUSTER_)MEMORY_USAGE_OPS_HISTORY. For each instance, this table retains the latest 50 records.
Trigger the alarm of excessive memory usage
When the memory usage of a tidb-server instance exceeds its memory threshold (70% of its total memory by default) and any of the following conditions is met, TiDB records the related status files and prints an alarm log.
- It is the first time the memory usage exceeds the memory threshold.
- The memory usage exceeds the memory threshold and it has been more than 60 seconds since the last alarm.
- The memory usage exceeds the memory threshold and
(Current memory usage - Memory usage at the last alarm) / Total memory > 10%.
You can control the memory threshold that triggers the alarm by modifying the memory usage ratio via the system variable tidb_memory_usage_alarm_ratio.
When the alarm of excessive memory usage is triggered, TiDB takes the following actions:
TiDB records the following information in the directory where the TiDB log file
filenameis located.- The information about the top 10 SQL statements with the highest memory usage and the top 10 SQL statements with the longest running time among all SQL statements currently being executed
- The goroutine stack information
- The usage status of heap memory
TiDB prints an alarm log containing the keyword
tidb-server has the risk of OOMand the values of the following memory-related system variables.
To avoid accumulating too many status files for alarms, TiDB only retains the status files generated during the recent five alarms by default. You can adjust this number by configuring the system variable tidb_memory_usage_alarm_keep_record_num.
The following example constructs a memory-intensive SQL statement that triggers the alarm:
Set
tidb_memory_usage_alarm_ratioto0.85:SET GLOBAL tidb_memory_usage_alarm_ratio = 0.85;Execute
CREATE TABLE t(a int);and insert 1000 rows of data.Execute
select * from t t1 join t t2 join t t3 order by t1.a. This SQL statement outputs one billion records, which consumes a large amount of memory and therefore triggers the alarm.Check the
tidb.logfile which records the total system memory, current system memory usage, memory usage of the tidb-server instance, and the directory of status files.[2022/10/11 16:39:02.281 +08:00] [WARN] [memoryusagealarm.go:212] ["tidb-server has the risk of OOM because of memory usage exceeds alarm ratio. Running SQLs and heap profile will be recorded in record path"] ["is tidb_server_memory_limit set"=false] ["system memory total"=33682427904] ["system memory usage"=22120655360] ["tidb-server memory usage"=21468556992] [memory-usage-alarm-ratio=0.85] ["record path"=/tiup/deploy/tidb-4000/log/oom_record]The fields of the example log file above are described as follows:
is tidb_server_memory_limit setindicates whethertidb_server_memory_limitis set.system memory totalindicates the total memory of the current system.system memory usageindicates the current system memory usage.tidb-server memory usageindicates the memory usage of the tidb-server instance.memory-usage-alarm-ratioindicates the value of the system variabletidb_memory_usage_alarm_ratio.record pathindicates the directory of status files.
By checking the directory of status files (In the preceding example, the directory is
/tiup/deploy/tidb-4000/log/oom_record), you can see a record directory with the corresponding timestamp (for example,record2022-10-09T17:18:38+08:00). The record directory includes three files:goroutinue,heap, andrunning_sql. These three files are suffixed with the time when status files are logged. They respectively record goroutine stack information, the usage status of heap memory, and the running SQL information when the alarm is triggered. For the content inrunning_sql, refer toexpensive-queries.
Reduce the memory usage for write transactions in tidb-server
The transaction model used by TiDB requires that all write operations of transactions are first cached in memory before being committed. When TiDB writes large transactions, memory usage might increase and become a bottleneck. To reduce or avoid high memory usage by large transactions under various constraints, you can adjust the tidb_dml_type system variable to "bulk" or use Non-transactional DML statements.
Other memory control behaviors of tidb-server
Flow control
TiDB supports dynamic memory control for the operator that reads data. By default, this operator uses the maximum number of threads that
tidb_distsql_scan_concurrencyallows to read data. When the memory usage of a single SQL execution exceedstidb_mem_quota_queryeach time, the operator that reads data stops one thread.This flow control behavior is controlled by the system variable
tidb_enable_rate_limit_action.When the flow control behavior is triggered, TiDB outputs a log containing the keywords
memory exceeds quota, destroy one token now.
Disk spill
TiDB supports disk spill for execution operators. When the memory usage of a SQL execution exceeds the memory quota, tidb-server can spill the intermediate data of execution operators to the disk to relieve memory pressure. Operators supporting disk spill include Sort, MergeJoin, HashJoin, and HashAgg.
- The disk spill behavior is jointly controlled by the following parameters:
tidb_mem_quota_query,tidb_enable_tmp_storage_on_oom,tmp-storage-path, andtmp-storage-quota. - When the disk spill is triggered, TiDB outputs a log containing the keywords
memory exceeds quota, spill to disk nowormemory exceeds quota, set aggregate mode to spill-mode. - Disk spill for the Sort, MergeJoin, and HashJoin operators is introduced in v4.0.0. Disk spill for the non-parallel algorithm of the HashAgg operator is introduced in v5.2.0. Disk spill for the parallel algorithm of the HashAgg operator is introduced in v8.0.0 as an experimental feature and becomes generally available (GA) in v8.2.0. Disk spill for the TopN operator is introduced in v8.3.0.
- You can control whether to enable the parallel HashAgg algorithm that supports disk spill using the
tidb_enable_parallel_hashagg_spillsystem variable. This variable will be deprecated in a future release. - When the SQL executions containing Sort, MergeJoin, HashJoin, HashAgg, or TopN cause OOM, TiDB triggers disk spill by default.
The following example uses a memory-consuming SQL statement to demonstrate the disk spill feature for HashAgg:
Configure the memory quota of a SQL statement to 1GB (1 GB by default):
SET tidb_mem_quota_query = 1 << 30;Create a single table
CREATE TABLE t(a int);and insert 256 rows of different data.Execute the following SQL statement:
[tidb]> explain analyze select /*+ HASH_AGG() */ count(*) from t t1 join t t2 join t t3 group by t1.a, t2.a, t3.a;Because executing this SQL statement occupies too much memory, the following "Out of Memory Quota" error message is returned:
ERROR 1105 (HY000): Out Of Memory Quota![conn_id=3]Execute the same SQL statement. You can find that this time, the statement is successfully executed and no error message is returned. From the following detailed execution plan, you can see that HashAgg has used 600 MB of hard disk space.
[tidb]> explain analyze select /*+ HASH_AGG() */ count(*) from t t1 join t t2 join t t3 group by t1.a, t2.a, t3.a;+---------------------------------+-------------+----------+-----------+---------------+---------------------------------------------------------------------------------------------------------------------------------------------------------------------+-----------------------------------------------------------------+-----------+----------+ | id | estRows | actRows | task | access object | execution info | operator info | memory | disk | +---------------------------------+-------------+----------+-----------+---------------+---------------------------------------------------------------------------------------------------------------------------------------------------------------------+-----------------------------------------------------------------+-----------+----------+ | HashAgg_11 | 204.80 | 16777216 | root | | time:1m37.4s, loops:16385 | group by:test.t.a, test.t.a, test.t.a, funcs:count(1)->Column#7 | 1.13 GB | 600.0 MB | | └─HashJoin_12 | 16777216.00 | 16777216 | root | | time:21.5s, loops:16385, build_hash_table:{total:267.2µs, fetch:228.9µs, build:38.2µs}, probe:{concurrency:1, total:35s, max:35s, probe:35s, fetch:962.2µs} | CARTESIAN inner join | 8.23 KB | 4 KB | | ├─TableReader_21(Build) | 256.00 | 256 | root | | time:87.2µs, loops:2, cop_task: {num: 1, max: 150µs, proc_keys: 0, rpc_num: 1, rpc_time: 145.1µs, copr_cache_hit_ratio: 0.00} | data:TableFullScan_20 | 885 Bytes | N/A | | │ └─TableFullScan_20 | 256.00 | 256 | cop[tikv] | table:t3 | tikv_task:{time:23.2µs, loops:256} | keep order:false, stats:pseudo | N/A | N/A | | └─HashJoin_14(Probe) | 65536.00 | 65536 | root | | time:728.1µs, loops:65, build_hash_table:{total:307.5µs, fetch:277.6µs, build:29.9µs}, probe:{concurrency:1, total:34.3s, max:34.3s, probe:34.3s, fetch:278µs} | CARTESIAN inner join | 8.23 KB | 4 KB | | ├─TableReader_19(Build) | 256.00 | 256 | root | | time:126.2µs, loops:2, cop_task: {num: 1, max: 308.4µs, proc_keys: 0, rpc_num: 1, rpc_time: 295.3µs, copr_cache_hit_ratio: 0.00} | data:TableFullScan_18 | 885 Bytes | N/A | | │ └─TableFullScan_18 | 256.00 | 256 | cop[tikv] | table:t2 | tikv_task:{time:79.2µs, loops:256} | keep order:false, stats:pseudo | N/A | N/A | | └─TableReader_17(Probe) | 256.00 | 256 | root | | time:211.1µs, loops:2, cop_task: {num: 1, max: 295.5µs, proc_keys: 0, rpc_num: 1, rpc_time: 279.7µs, copr_cache_hit_ratio: 0.00} | data:TableFullScan_16 | 885 Bytes | N/A | | └─TableFullScan_16 | 256.00 | 256 | cop[tikv] | table:t1 | tikv_task:{time:71.4µs, loops:256} | keep order:false, stats:pseudo | N/A | N/A | +---------------------------------+-------------+----------+-----------+---------------+---------------------------------------------------------------------------------------------------------------------------------------------------------------------+-----------------------------------------------------------------+-----------+----------+ 9 rows in set (1 min 37.428 sec)
Mitigate OOM issues by configuring GOMEMLIMIT
GO 1.19 introduces an environment variable GOMEMLIMIT to set the memory limit that triggers GC.
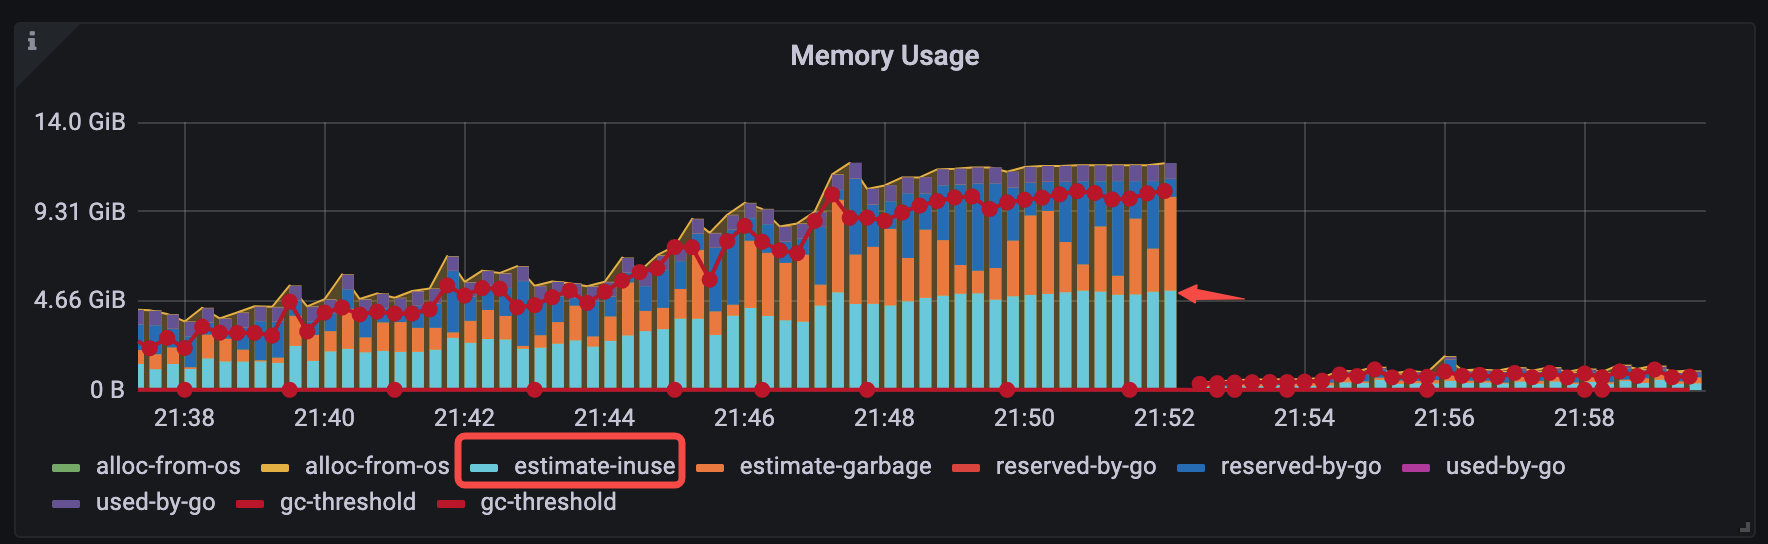
For v6.1.3 <= TiDB < v6.5.0, you can mitigate a typical category of OOM issues by manually setting GOMEMLIMIT. The typical category of OOM issues is: before OOM occurs, the estimated memory in use on Grafana occupies only half of the entire memory (TiDB-Runtime > Memory Usage > estimate-inuse), as shown in the following figure:
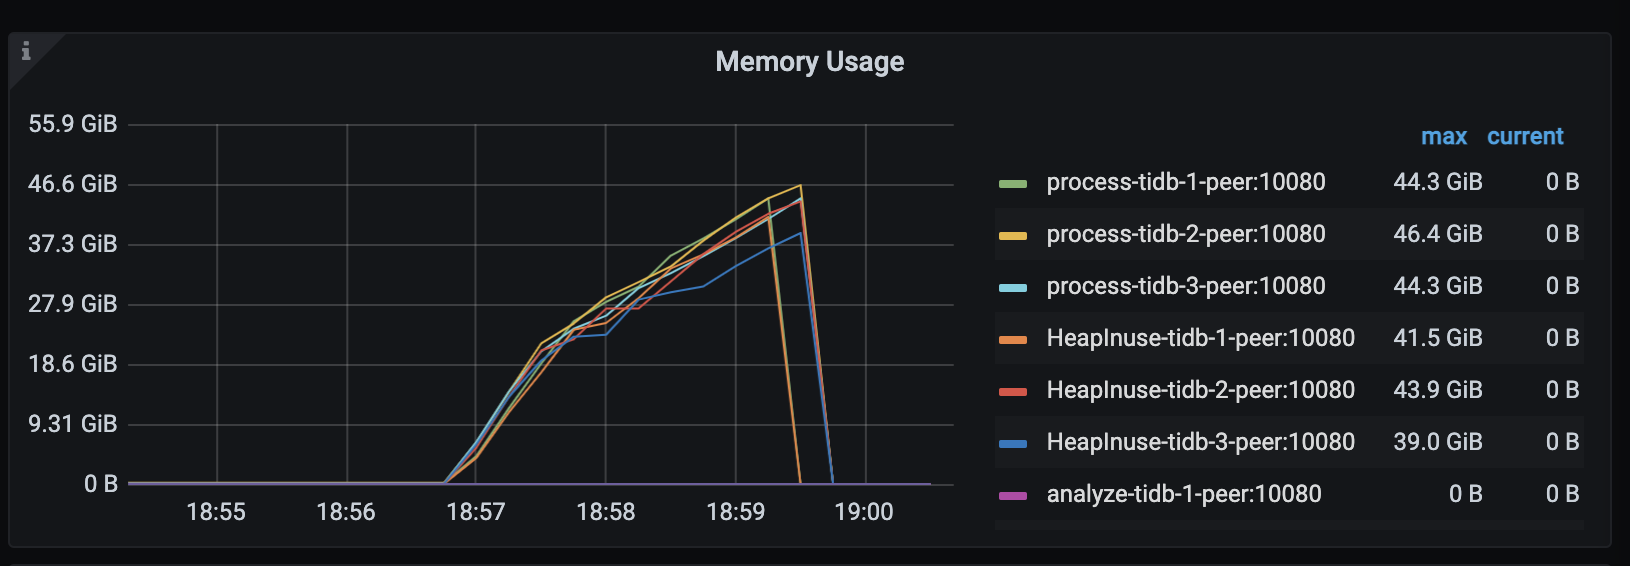
To verify the performance of GOMEMLIMIT, a test is performed to compare the specific memory usage with and without GOMEMLIMIT configuration.
In TiDB v6.1.2, the TiDB server encounters OOM (system memory: about 48 GiB) after the simulated workload runs for several minutes:
In TiDB v6.1.3,
GOMEMLIMITis set to 40000 MiB. It is found that the simulated workload runs stably for a long time, OOM does not occur in the TiDB server, and the maximum memory usage of the process is stable at around 40.8 GiB: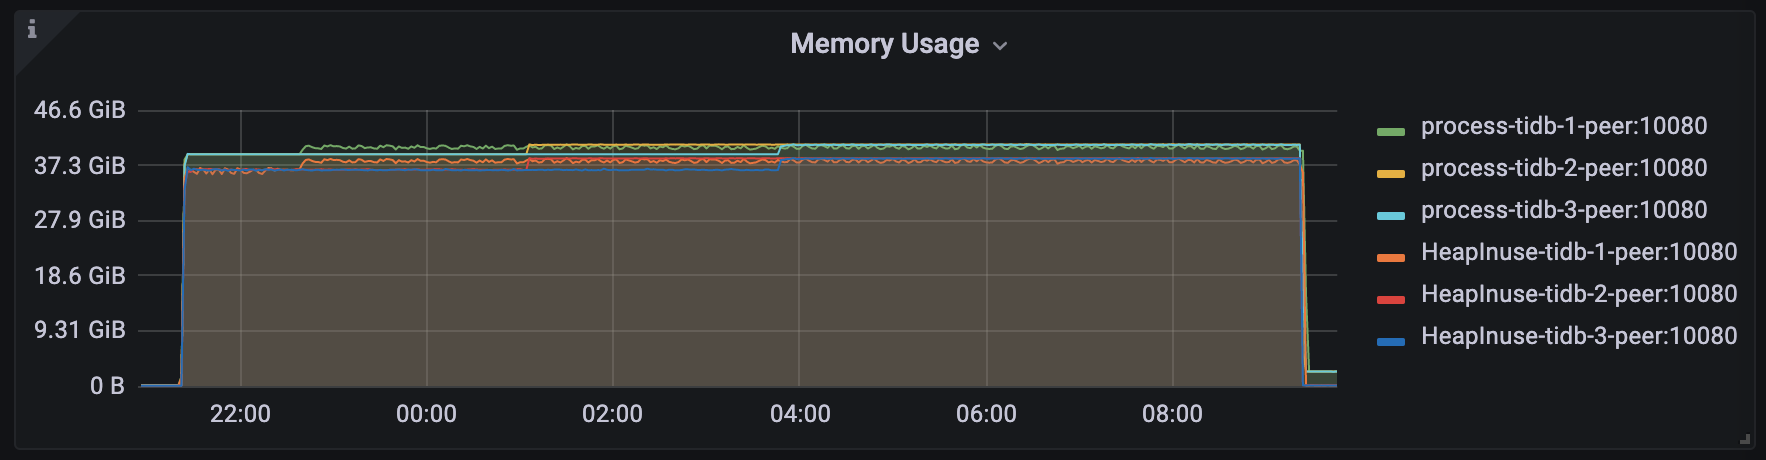
Memory arbitrator mode
Before TiDB v9.0.0, the memory control mechanism has the following issues:
- When the memory usage of a TiDB instance exceeds the limit, TiDB might randomly terminate running SQL statements.
- Memory resources follow a "use first and report later" mechanism, and memory usage is isolated across different SQL statements. As a result, TiDB cannot centrally schedule or control memory resources at the instance level.
- Under high memory pressure, the overhead of Go garbage collection (GC) increases significantly, and in severe cases might cause out of memory (OOM) issues.
Starting from v9.0.0, TiDB introduces memory arbitrator mode. This mode introduces a global memory arbitrator in each TiDB instance to centrally manage and schedule the memory resources of the instance from top to bottom, mitigating the preceding issues.
You can enable memory arbitrator mode using the tidb_mem_arbitrator_mode system variable or the instance.tidb_mem_arbitrator_mode parameter in the TiDB configuration file.
disable: disables memory arbitrator modestandardorpriority: enables memory arbitrator mode. After it is enabled:- Memory resources are used with a subscribe-before-allocation mechanism and are uniformly scheduled by the memory arbitrator in each TiDB instance.
- The overall memory usage of the TiDB instance is expected not to exceed the limit of
tidb_server_memory_limit, and the alarm for high memory usage no longer takes effect. - The behavior of the following system variables remains effective:
When memory resources are insufficient or there is an OOM risk, the arbitrator can reclaim memory resources by terminating SQL statements, but it does not terminate DDL, DCL, or TCL SQL statements. Terminated SQL returns error code 8180 to the client. The error format is: Query execution was stopped by the global memory arbitrator [reason=?, path=?] [conn=?]. The related fields are explained as follows:
conn: the connection (session) IDreason: the specific reason why the SQL is terminatedpath: the stage at which the SQL is terminated (if the error does not contain thepathfield, the SQL is terminated during the execution stage)ParseSQL: parsingCompilePlan: compiling the execution plan
Memory arbitrator mode pools the arbitrable memory resources in each TiDB instance. The memory resources corresponding to tidb_server_memory_limit are divided into the following four categories, which can be viewed through the Mem Quota Stats monitoring metric:
allocated: allocated memory quota, including but not limited to the memory pool to which the SQL belongs and the memory pools of various public modulesavailable: allocatable memory quotabuffer: memory quota of the bufferout-of-control: memory quota not controlled by the arbitrator, including but not limited to:- unsafe or disabled memory
- memory waiting for garbage collection
- memory used by the Go runtime
- other untracked memory usage
out-of-control is a risk metric that requires special attention. It is dynamically calculated by the arbitrator, with a minimum value of tidb_server_memory_limit - tidb_mem_arbitrator_soft_limit. The arbitrator quantifies this type of risky memory quota as accurately as possible and reserves space for it during memory allocation, thereby reducing the risk of OOM in the TiDB instance.
standard mode
In standard mode, during SQL execution, SQL dynamically subscribes to memory resources from the arbitrator and blocks to wait when resources are insufficient. The arbitrator processes subscription requests on a first in, first out (FIFO) basis.
- When parsing SQL or compiling the execution plan, the required memory quota is estimated by TiDB and is proportional to the number of SQL keywords.
- If global memory resources are insufficient, the arbitrator fails the subscription request and terminates the SQL. The
reasonfield in the returned error isCANCEL(out-of-quota & standard-mode).
priority mode
In priority mode, during SQL execution, SQL dynamically subscribes to memory resources from the arbitrator and blocks to wait when resources are insufficient. The arbitrator processes subscription requests according to the resource group priority (LOW | MEDIUM | HIGH) to which the SQL belongs.
- When parsing SQL or compiling the execution plan, the required memory quota is estimated by TiDB and is proportional to the number of SQL keywords. Unlike
standardmode, inprioritymode, unless there is anOOMrisk, a failed subscription does not immediately terminate the SQL. - The arbitrator processes subscription requests in descending order of priority. Requests with the same priority are queued in the order they are initiated.
- When global memory resources are insufficient:
- The arbitrator terminates lower-priority SQL in order (from low to high priority, and from large to small memory quota usage) to reclaim resources for higher-priority SQL. The
reasonfield in the returned error isCANCEL(out-of-quota & priority-mode). - If there is no terminable SQL, the subscription request continues to wait until an existing SQL finishes execution and releases resources.
- The arbitrator terminates lower-priority SQL in order (from low to high priority, and from large to small memory quota usage) to reclaim resources for higher-priority SQL. The
If you want SQL to avoid the latency overhead caused by waiting for memory resources, you can set the tidb_mem_arbitrator_wait_averse system variable to 1.
- The subscription requests of the related SQL are automatically bound to priority
HIGH. - When global memory resources are insufficient, the arbitrator directly terminates the related SQL, and the
reasonfield in the returned error isCANCEL(out-of-quota & wait-averse).
Memory risk control
When the memory usage of a TiDB instance reaches the 95% threshold of tidb_server_memory_limit, the arbitrator starts handling memory risks. If the actual memory usage cannot be reduced to a safe level in the short term or the actual memory release rate is too low, the TiDB instance faces the OOM risk. The arbitrator forcibly terminates SQL in order (from low to high priority, and from large to small memory quota usage), and the reason field in the returned error is KILL(out-of-memory).
If you need to force SQL to run when memory resources are insufficient, you can set the tidb_mem_arbitrator_wait_averse system variable to nolimit. This variable makes the memory usage of the related SQL unrestricted by the arbitrator, but it might cause the TiDB instance to OOM.
Manually ensuring memory safety
You can set the upper limit of the arbitrator's memory quota in a TiDB instance using the tidb_mem_arbitrator_soft_limit system variable or the instance.tidb_mem_arbitrator_soft_limit parameter in the TiDB configuration file. The smaller the upper limit, the safer the global memory, but the lower the memory resource utilization. You can use this variable to manually and quickly converge memory risks.
TiDB internally caches the historical maximum memory usage of some SQL statements and pre-subscribes sufficient memory quota before the next execution of the SQL. If it is known that a SQL statement has a large amount of uncontrolled memory usage, you can use the tidb_mem_arbitrator_query_reserved system variable to specify the quota subscribed by the SQL. The larger the value, the safer the global memory, but the lower the memory resource utilization. Pre-subscribing sufficient or excess quota can effectively ensure the isolation of memory resources for SQL.
Monitoring and observability metrics
The TiDB / Memory Arbitrator panel is added to Grafana monitoring, containing the following metrics:
Work Mode: the memory management mode of the TiDB instanceArbitration Exec: statistics on the arbitrator processing various requestsEvents: statistics on various events in arbitrator mode. Pay special attention tomem-risk(memory risk) andoom-risk(OOMrisk)Mem Quota Stats: usage of various memory quotas. Pay special attention toout-of-control,wait-alloc(total memory quota waiting for allocation), andmem-inuse(actual memory usage)Mem Quota Arbitration: processing time of memory resource subscription requestsMem Pool Stats: the number of various memory poolsRuntime Mem Pressure: memory pressure value, that is, the ratio of actual memory usage to allocated memory quotaWaiting Tasks: the number of various tasks queued and waiting for memory allocation
SLOW_QUERY adds the Mem_arbitration field, which indicates the total time that SQL waits for memory resources. The Mem Arbitration column on the TiDB Dashboard slow query page also displays this information.
PROCESSLIST adds the following fields:
MEM_ARBITRATION: the total time that SQL has waited for memory resources so farMEM_WAIT_ARBITRATE_START: the start time of the current memory resource subscription request. If there is currently no waiting subscription request, the value is NULLMEM_WAIT_ARBITRATE_BYTES: the requested bytes of the current memory resource subscription request. If there is currently no waiting subscription request, the value is NULL
Expensive query adds the mem_arbitration field to record the time that SQL waits for memory resources and the information of the current subscription request, for example:
cost_time 2.1s, wait_start 1970-01-02 10:17:36.789 UTC, wait_bytes 123456789123 Bytes (115.0 GB)
STATEMENTS_SUMMARY: the statements_summary, statements_summary_history, cluster_statements_summary, and cluster_statements_summary_history tables add the following fields. The Mean Mem Arbitration column on the TiDB Dashboard SQL statement analysis execution details page also displays this information:
AVG_MEM_ARBITRATION: the average time that SQL waits for memory resourcesMAX_MEM_ARBITRATION: the maximum time that SQL waits for memory resources
Best practices
The default value 80% of the tidb_server_memory_limit system variable is relatively small. After enabling memory arbitrator mode, it is recommended to set it to 95%.
In single-node TiDB deployment scenarios:
- If
prioritymode is enabled, it is recommended to bind OLTP-related SQL or business-critical SQL to high-priority resource groups, and bind other SQL to medium-priority or low-priority resource groups as needed - If
standardmode is enabled and SQL returns error8180, it is recommended to retry the SQL after waiting for a period of time
In multi-node TiDB deployment scenarios:
If
standardmode is enabled and SQL returns error8180, it is recommended to retry the SQL on another TiDB node.If
prioritymode is enabled:- It is recommended to bind OLTP-related SQL or business-critical SQL to high-priority resource groups, and bind other SQL to medium-priority or low-priority resource groups as needed.
- Use
max_execution_timeto limit the maximum execution time of SQL. - If a timeout or error
8180occurs, it is recommended to retry the SQL on another TiDB node. - If you want SQL to fail quickly when memory resources are insufficient and then be retried on another node, you can set
tidb_mem_arbitrator_wait_averse.
TiDB instance grouping
- In each group, use the
instance.tidb_mem_arbitrator_modeparameter in the configuration file to set the memory management mode of TiDB instances. - In each group, use the
instance.tidb_mem_arbitrator_soft_limitparameter in the configuration file to set the upper limit of the memory quota of TiDB instances as needed. - Distribute SQL to different instance groups according to business requirements, and handle SQL failures or retries based on the arbitrator mode of each instance group.
- In each group, use the
You can take the following measures to ensure the execution of important SQL:
- Use
tidb_mem_arbitrator_query_reservedto pre-subscribe memory quota for important SQL, enhancing its memory resource isolation. - Bind important SQL to high-priority resource groups.
- Set
tidb_mem_quota_queryto a larger value to reduce the probability that a single SQL is interrupted because it exceeds the memory quota. - If you can accept the OOM risk, set
tidb_mem_arbitrator_wait_aversetonolimitso that the related SQL bypasses the memory arbitrator limitation.