Deploy Monitoring and Alerts for a TiDB Cluster
This document describes how to monitor a TiDB cluster deployed using TiDB Operator and how to configure alerts for the cluster.
Monitor the TiDB cluster
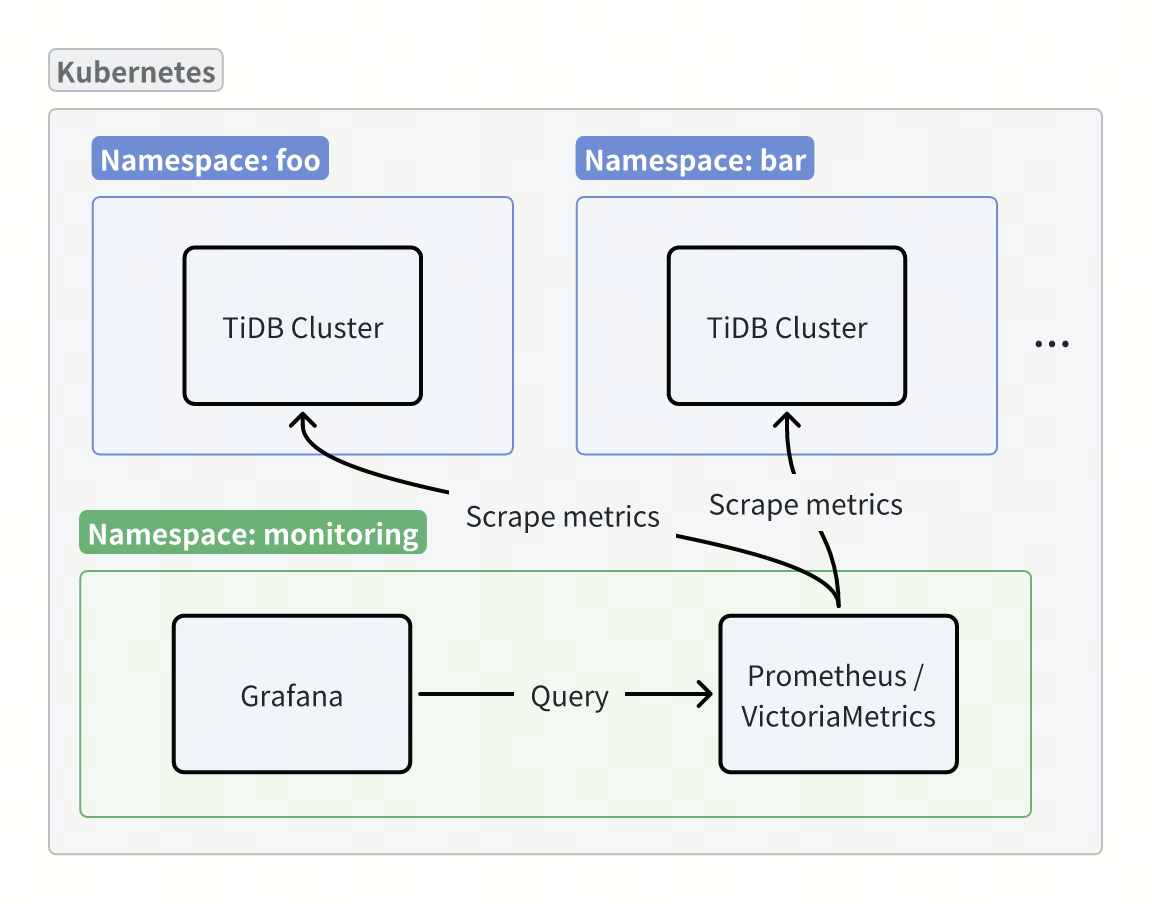
TiDB cluster monitoring consists of two parts: monitoring data and dashboards. You can collect metrics using open-source tools such as Prometheus or VictoriaMetrics, and display the metrics using Grafana.
Collect monitoring data
Collect monitoring data using Prometheus
To collect monitoring data using Prometheus, perform the following steps:
Deploy Prometheus Operator in your Kubernetes cluster by following the Prometheus Operator official documentation. This document uses version
v0.82.0as an example.Create a
PodMonitorCustom Resource (CR) in the namespace of your TiDB cluster:apiVersion: monitoring.coreos.com/v1 kind: PodMonitor metadata: name: tidb-cluster-pod-monitor namespace: ${tidb_cluster_namespace} labels: monitor: tidb-cluster spec: jobLabel: "pingcap.com/component" namespaceSelector: matchNames: - ${tidb_cluster_namespace} selector: matchLabels: app.kubernetes.io/managed-by: tidb-operator podMetricsEndpoints: - interval: 15s # If TLS is enabled in the TiDB cluster, set the scheme to https. Otherwise, set it to http. scheme: https honorLabels: true # Configure tlsConfig only if TLS is enabled in the TiDB cluster. tlsConfig: ca: secret: name: db-cluster-client-secret key: ca.crt cert: secret: name: db-cluster-client-secret key: tls.crt keySecret: name: db-cluster-client-secret key: tls.key metricRelabelings: - action: labeldrop regex: container relabelings: - sourceLabels: [__meta_kubernetes_pod_annotation_prometheus_io_scrape] action: keep regex: "true" - sourceLabels: - __meta_kubernetes_pod_name - __meta_kubernetes_pod_label_pingcap_com_group - __meta_kubernetes_pod_label_app_kubernetes_io_component - __meta_kubernetes_namespace - __meta_kubernetes_pod_annotation_prometheus_io_port action: replace regex: (.+);(.+);(.+);(.+);(.+) replacement: $1.$2-$3-peer.$4:$5 targetLabel: __address__ - sourceLabels: [__meta_kubernetes_pod_annotation_prometheus_io_path] targetLabel: __metrics_path__ - sourceLabels: [__meta_kubernetes_namespace] targetLabel: kubernetes_namespace - sourceLabels: [__meta_kubernetes_pod_label_app_kubernetes_io_instance] targetLabel: cluster - sourceLabels: [__meta_kubernetes_pod_name] targetLabel: instance - sourceLabels: [__meta_kubernetes_pod_label_app_kubernetes_io_component] targetLabel: component - sourceLabels: - __meta_kubernetes_namespace - __meta_kubernetes_pod_label_app_kubernetes_io_instance separator: '-' targetLabel: tidb_clusterCreate a
PrometheusCR to collect metrics. Follow the Prometheus Operator official documentation and make sure the appropriate permissions are granted to the ServiceAccount:apiVersion: monitoring.coreos.com/v1 kind: Prometheus metadata: name: prometheus namespace: monitoring spec: serviceAccountName: prometheus externalLabels: k8s_cluster: ${your_k8s_cluster_name} podMonitorSelector: matchLabels: monitor: tidb-cluster # An empty podMonitorNamespaceSelector means PodMonitors in all namespaces are collected. podMonitorNamespaceSelector: {}Execute the following
kubectl port-forwardcommand to access Prometheus through port forwarding:kubectl port-forward -n monitoring prometheus-prometheus-0 9090:9090 &>/tmp/portforward-prometheus.log &Then, you can access http://localhost:9090/targets in your browser view the monitoring data collection status.
Collect monitoring data using VictoriaMetrics
To collect monitoring data using VictoriaMetrics, perform the following steps:
Deploy VictoriaMetrics Operator in your Kubernetes cluster by following the VictoriaMetrics official documentation. This document uses version
v0.58.1as an example.Create a
VMSingleCustom Resource (CR) to store monitoring data:apiVersion: victoriametrics.com/v1beta1 kind: VMSingle metadata: name: demo namespace: monitoringCreate a
VMAgentCR to collect monitoring data:apiVersion: victoriametrics.com/v1beta1 kind: VMAgent metadata: name: demo namespace: monitoring spec: # Configure remoteWrite to write collected monitoring metrics to VMSingle. remoteWrite: - url: "http://vmsingle-demo.monitoring.svc:8429/api/v1/write" externalLabels: k8s_cluster: ${your_k8s_cluster_name} selectAllByDefault: trueCreate a
VMPodScrapeCR in the TiDB cluster namespace to discover Pods and generate scrape configs for VMAgent:apiVersion: victoriametrics.com/v1beta1 kind: VMPodScrape metadata: name: tidb-cluster-pod-scrape namespace: ${tidb_cluster_namespace} spec: jobLabel: "pingcap.com/component" namespaceSelector: matchNames: - ${tidb_cluster_namespace} selector: matchLabels: app.kubernetes.io/managed-by: tidb-operator podMetricsEndpoints: - interval: 15s # If TLS is enabled in the TiDB cluster, set the scheme to https. Otherwise, set it to http. scheme: https honorLabels: true # Configure tlsConfig only if TLS is enabled in the TiDB cluster. tlsConfig: ca: secret: name: db-cluster-client-secret key: ca.crt cert: secret: name: db-cluster-client-secret key: tls.crt keySecret: name: db-cluster-client-secret key: tls.key metricRelabelConfigs: - action: labeldrop regex: container relabelConfigs: - sourceLabels: [__meta_kubernetes_pod_annotation_prometheus_io_scrape] action: keep regex: "true" - sourceLabels: - __meta_kubernetes_pod_name - __meta_kubernetes_pod_label_app_kubernetes_io_instance - __meta_kubernetes_pod_label_app_kubernetes_io_component - __meta_kubernetes_namespace - __meta_kubernetes_pod_annotation_prometheus_io_port action: replace regex: (.+);(.+);(.+);(.+);(.+) replacement: $1.$2-$3-peer.$4:$5 targetLabel: __address__ - sourceLabels: [__meta_kubernetes_pod_annotation_prometheus_io_path] targetLabel: __metrics_path__ - sourceLabels: [__meta_kubernetes_namespace] targetLabel: kubernetes_namespace - sourceLabels: [__meta_kubernetes_pod_label_app_kubernetes_io_instance] targetLabel: cluster - sourceLabels: [__meta_kubernetes_pod_name] targetLabel: instance - sourceLabels: [__meta_kubernetes_pod_label_app_kubernetes_io_component] targetLabel: component - sourceLabels: - __meta_kubernetes_namespace - __meta_kubernetes_pod_label_app_kubernetes_io_instance separator: '-' targetLabel: tidb_clusterExecute the following
kubectl port-forwardcommand to access VMAgent through port forwarding:kubectl port-forward -n monitoring svc/vmagent-demo 8429:8429 &>/tmp/portforward-vmagent.log &Then, you can access http://localhost:8429/targets in your browser view the monitoring data collection status.
Configure monitoring dashboards
To configure the monitoring dashboard, perform the following steps:
Follow the Grafana official documentation to deploy Grafana. This document uses version
12.0.0-security-01as an example.Execute the following
kubectl port-forwardcommand to access Grafana through port forwarding:kubectl port-forward -n ${namespace} ${grafana_pod_name} 3000:3000 &>/tmp/portforward-grafana.log &Then, you can access http://localhost:3000 in your browser. The default username and password are both
admin. If you install Grafana using Helm, execute the following command to get the password ofadmin:kubectl get secret --namespace ${namespace} ${grafana_secret_name} -o jsonpath="{.data.admin-password}" | base64 --decode ; echoAdd a data source of type Prometheus in Grafana and set the Prometheus Server URL based on your monitoring setup:
- For Prometheus, set the URL to
http://prometheus-operated.monitoring.svc:9090. - For VictoriaMetrics, set the URL to
http://vmsingle-demo.monitoring.svc:8429.
- For Prometheus, set the URL to
Download Grafana dashboards for TiDB components using the
get-grafana-dashboards.shscript and import them manually into Grafana.
Configure alerts
You can manage and send alerts using Alertmanager. For specific deployment and configuration steps, refer to the Alertmanager official documentation.
Monitor multiple clusters using Grafana
To monitor multiple clusters in Grafana, perform the following steps:
- In the Grafana dashboard, click Dashboard settings to open the Settings page.
- On the Settings page, select the tidb_cluster variable under Variables, and set the Hide property of the tidb_cluster variable to empty.
- Return to the dashboard. You will see a cluster selector dropdown. Each option follows the
${namespace}-${tidb_cluster_name}format. - Click Save dashboard to apply the changes.