Troubleshoot TiDB Cluster Using PingCAP Clinic
For TiDB clusters deployed on Kubernetes using TiDB Operator, you can use PingCAP Clinic Diagnostic Service (PingCAP Clinic) to remotely troubleshoot cluster problems and locally check the cluster status using the Clinic Diag client (Diag) and the Clinic Server Platform (Clinic Server).
For clusters deployed using TiDB Operator, Diag is deployed as a standalone Pod. This document describes how to use the kubectl command to create and deploy the Diag Pod, then to collect data and perform a quick check through the API.
Usage scenarios
You can easily collect data from clusters and perform a quick check using the Diag of PingCAP Clinic:
Install Diag client
The following sections describe how to install Diag.
Step 1: Prepare the environment
Before deploying Diag, make sure the following items are installed on the cluster:
- Kubernetes >= v1.24
- TiDB Operator
- PersistentVolume
- RBAC
- Helm 3
Install Helm
To install Helm and configure the chart repository https://charts.pingcap.org/ maintained by PingCAP, you can refer to the Use Helm document.
helm search repo diag
NAME          CHART VERSION  APP VERSION  DESCRIPTION
pingcap/diag  v1.3.1         v1.3.1       Clinic Diag Helm chart for Kubernetes
Check the privilege of the user
The user used for deploying Diag is expected to have the following Role and Cluster Role resources:
Role access:
PolicyRule:
  Resources                               Non-Resource URLs  Resource Names  Verbs
  ---------                               -----------------  --------------  -----
  serviceaccounts                         []                 []              [get create delete]
  deployments.apps                        []                 []              [get create delete]
  rolebindings.rbac.authorization.k8s.io  []                 []              [get create delete]
  roles.rbac.authorization.k8s.io         []                 []              [get create delete]
  secrets                                 []                 []              [get list create delete]
  services                                []                 []              [get list create delete]
  pods                                    []                 []              [get list]
  tidbclusters.pingcap.com                []                 []              [get list]
  tidbmonitors.pingcap.com                []                 []              [get list]
Cluster Role access:
PolicyRule:
  Resources                                      Non-Resource URLs  Resource Names  Verbs
  ---------                                      -----------------  --------------  -----
  clusterrolebindings.rbac.authorization.k8s.io  []                 []              [get create delete]
  clusterroles.rbac.authorization.k8s.io         []                 []              [get create delete]
  pods                                           []                 []              [get list]
  secrets                                        []                 []              [get list]
  services                                       []                 []              [get list]
  tidbclusters.pingcap.com                       []                 []              [get list]
  tidbmonitors.pingcap.com                       []                 []              [get list]
Follow these steps to check the user access:
Check the user's Role and clusterRole:
kubectl describe rolebinding -n ${namespace} | grep ${user_name} -A 7
kubectl describe clusterrolebinding -n ${namespace} | grep ${user_name} -A 7
Check the user's access of Role and Cluster Role:
kubectl describe role ${role_name} -n ${namespace}
kubectl describe clusterrole ${clusterrole_name} -n ${namespace}
Step 2: Log in to the Clinic Server and get an access token
When Diag uploads data, the access token is used to identify the user and ensures that the data from Diag is uploaded to the organization created by the user. You need to log in to the Clinic Server to get a token.
Log in to the Clinic Server.
Go to the Clinic Server for international users and select Continue with TiDB Account to enter the TiDB Cloud login page. If you do not have a TiDB Cloud account, you can create one on that page.
Go to the Clinic Server for users in the Chinese mainland and select Continue with AskTUG to enter the AskTUG community login page. If you do not have an AskTUG account, you can create one on that page.
Create an organization.
Create an organization on the Clinic Server. An organization is a collection of TiDB clusters. You can upload diagnostic data to the created organization.
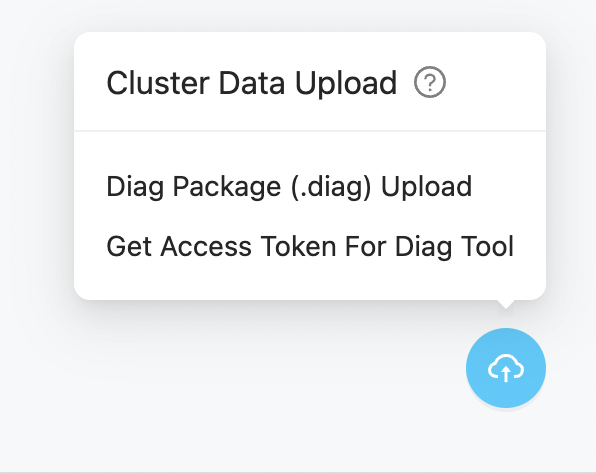
Get an access token.
To get a token, enter the organization page and click the icon in the lower-right corner of the Clusters page, and select Get Access Token For Diag Tool. Make sure that you have copied and saved the displayed token information.
Step 3: Deploy a Diag Pod
Depending on the network connection of the cluster, you can choose one of the following methods to deploy a Diag Pod:
- Quick online deployment: If the cluster has Internet access and you would like to use the default Diag configuration, it is recommended to use the quick online deployment.
- Standard online deployment: If the cluster has Internet access and you need to customize the Diag configuration, it is recommended to use the standard online deployment.
- Offline deployment: If the cluster cannot access the Internet, you can use the offline deployment.
- Least privilege deployment: If all nodes in the cluster are running under the same namespace, you can deploy Diag to the namespace of the cluster so that Diag has the least privileges.
To use the quick online deployment, do the following:
Deploy Diag using the following helm command and the latest Diag image is pulled from the Docker Hub.
# namespace: the same as that of TiDB Operator
# diag.clinicToken: get your token in "https://clinic.pingcap.com.cn" or "https://clinic.pingcap.com"
helm install --namespace tidb-admin diag-collector pingcap/diag --version ${chart_version} \
        --set diag.clinicToken=${clinic_token}
        --set diag.clinicRegion=${clinic_region}  # CN or US
The output is as follows:
NAME: diag-collector
LAST DEPLOYED: Tue Mar 15 13:00:44 2022
NAMESPACE: tidb-admin
STATUS: deployed
REVISION: 1
NOTES:
Make sure diag-collector components are running:

    kubectl get pods --namespace tidb-admin -l app.kubernetes.io/instance=diag-collector
    kubectl get svc --namespace tidb-admin -l app.kubernetes.io/name=diag-collector
To use the standard online deployment, do the following:
Get the
values-diag-collector.yamlfile from the Diag chart.mkdir -p ${HOME}/diag-collector && \ helm inspect values pingcap/diag --version=${chart_version} > ${HOME}/diag-collector/values-diag-collector.yamlConfigure the
values-diag-collector.yamlfile.Modify your
clinicTokenandclinicRegionin the${HOME}/diag-collector/values-diag-collector.yamlfile.Other configuration parameters such as
limits,requests, andvolumecan be modified according to your needs.Deploy Diag.
helm install diag-collector pingcap/diag --namespace=tidb-admin --version=${chart_version} -f ${HOME}/diag-collector/values-diag-collector.yaml && \ kubectl get pods --namespace tidb-admin -l app.kubernetes.io/instance=diag-collector(Optional) Set a persistent volume.
This step sets a data volume for Diag to persist its data. To set the volume, you can configure the
diag.volumefield with the volume type in the${HOME}/diag-collector/values-diag-collector.yamlfile. The following examples are PVC and Host:# Use PVC volume type volume: persistentVolumeClaim: claimName: local-storage-diag# Use Host volume type volume: hostPath: path: /data/diag(Optional) Upgrade Diag.
To upgrade Diag, modify the
${HOME}/diag-collector/values-diag-collector.yamlfile and then run the following command.helm upgrade diag-collector pingcap/diag --namespace=tidb-admin -f ${HOME}/diag-collector/values-diag-collector.yaml
If your cluster cannot access the Internet, you can deploy Diag using the offline method.
Download the Diag chart.
If your cluster cannot access the Internet, you cannot install Diag and other components by configuring the Helm repo. In this situation, you need to download the chart files on a machine with Internet access and then copy the file to the cluster.
To download Diag chart files, you can use the following command:
wget http://charts.pingcap.org/diag-${chart_version}.tgzCopy
diag-${chart_version}.tgzto the cluster and unpack it to the current directory.tar zxvf diag-${chart_version}.tgzDownload the Diag image.
You need to download the Diag image on a machine that has Internet access and then use the
docker loadcommand to load the image to the cluster.The Diag image is
pingcap/diag:${chart_version}. You can download and save the image using the following commands:docker pull pingcap/diag:${chart_version} docker save -o diag-${chart_version}.tar pingcap/diag:${chart_version}Then, copy the archived image to the cluster and use the
docker loadcommand to load the image to the cluster:docker load -i diag-${chart_version}.tarConfigure the
values-diag-collector.yamlfile.Modify your
clinicTokenandclinicRegionin the${HOME}/diag-collector/values-diag-collector.yamlfile.Other configuration parameters such as
limits,requests, andvolumecan be modified according to your needs.Install Diag.
Install Diag using the following command:
helm install diag-collector ./diag --namespace=tidb-admin(Optional) Set a persistent volume.
This step sets a data volume for Diag to persist its data. To set the volume, you can configure the
diag.volumefield with the volume type in the${HOME}/diag-collector/values-diag-collector.yamlfile. The following examples are PVC and Host:# Use PVC volume type volume: persistentVolumeClaim: claimName: local-storage-diag# Use Host volume type volume: hostPath: path: /data/diag
To use the least privilege deployment, do the following:
Check the privilege of the user.
This deployment method creates a Role with the following access. The user to deploy Diag needs the corresponding permissions to create a Role of this type.
Resources                               Non-Resource URLs  Resource Names  Verbs
---------                               -----------------  --------------  -----
serviceaccounts                         []                 []              [get create delete]
deployments.apps                        []                 []              [get create delete]
rolebindings.rbac.authorization.k8s.io  []                 []              [get create delete]
roles.rbac.authorization.k8s.io         []                 []              [get create delete]
secrets                                 []                 []              [get list create delete]
services                                []                 []              [get list create delete]
pods                                    []                 []              [get list]
tidbclusters.pingcap.com                []                 []              [get list]
tidbmonitors.pingcap.com                []                 []              [get list]
Deploy Diag using the following
helmcommand, and the latest Diag image is pulled from the Docker Hub.helm install --namespace tidb-cluster diag-collector pingcap/diag --version ${chart_version} \ --set diag.clinicToken=${clinic_token} \ --set diag.clusterRoleEnabled=false \ --set diag.clinicRegion=USIf TLS is not enabled in the cluster, you can add the
--set diag.tls.enabled=falseflag, then the created Role will not have thegetandlistprivileges ofsecrets.helm install --namespace tidb-cluster diag-collector pingcap/diag --version ${chart_version} \ --set diag.clinicToken=${clinic_token} \ --set diag.tlsEnabled=false \ --set diag.clusterRoleEnabled=false \ --set diag.clinicRegion=USThe output is as follows:
NAME: diag-collector
LAST DEPLOYED: Tue Mar 15 13:00:44 2022
NAMESPACE: tidb-cluster
STATUS: deployed
REVISION: 1
NOTES:
Make sure diag-collector components are running:
  kubectl get pods --namespace tidb-cluster -l app.kubernetes.io/instance=diag-collector
  kubectl get svc --namespace tidb-cluster -l app.kubernetes.io/name=diag-collector
Step 4: Check the status of the Diag Pod
You can check the status of the Diag Pod using the following command:
kubectl get pods --namespace tidb-admin -l app.kubernetes.io/instance=diag-collector
The output is as follows when the Pod is running properly:
NAME                             READY   STATUS    RESTARTS   AGE
diag-collector-5c9d8968c-clnfr   1/1     Running   0          89s
Use Diag to collect data
You can use Diag to quickly collect diagnostic data from TiDB clusters, including monitoring data and configurations.
Usage scenarios for Diag
Diag is suitable for the following scenarios:
- When your cluster has some problems, if you need to contact PingCAP technical support, you can use Diag to collect the diagnostic data to facilitate remote troubleshooting.
- Use Diag to collect and save the data for later analysis.
Step 1: Check the data to be collected
For a full list of data that can be collected by Diag, see Clinic diagnostic Data. It is recommended to collect all data to improve the efficiency of the diagnosis.
Step 2: Collect data
You can collect data using Diag APIs.
For detailed API documents, visit
http://${host}:${port}/api/v1.To get the IP of the node, use the following command:
kubectl get node | grep nodeTo get the port of
diag-collector service, use the following command:kubectl get service -n tidb-adminThe output is as follows:
NAME                 TYPE           CLUSTER-IP           EXTERNAL-IP   PORT(S)              AGE
diag-collector   NodePort   10.111.143.227   <none>            4917:31917/TCP   18m
In the preceding output:
- The port to access
diag-collector servicefrom outside is31917. - The service type is NodePort. You can access this service from any host in the Kubernetes cluster with its IP address
${host}and port${port}. - If there are network restrictions between hosts, you can use the
port-forwardcommand to redirect the service port4917to local, and then use127.0.0.1:4917to access this service.
- The port to access
The following describes how to collect data using Diag APIs.
Request for collecting data.
You can request for collecting data using the following API:
curl -s http://${host}:${port}/api/v1/collectors -X POST -d '{"clusterName": "${cluster-name}","namespace": "${cluster-namespace}","from": "2022-02-08 12:00 +0800","to": "2022-02-08 18:00 +0800"}'The usage of the API parameters is as follows:
clusterName: the name of the TiDB cluster.namespace: the namespace name of the TiDB cluster (not thenamespaceof TiDB Operator).collector: optional, which controls the data types to be collected. The supported values includemonitor,config, andperf. If the parameter is not specified,monitorandconfigdata is collected by default.fromandto: specify the start time and end time of the data collection.+0800indicates the time zone is UTC+8. The supported time formats are as follows:"2006-01-02T15:04:05Z07:00" "2006-01-02T15:04:05.999999999Z07:00" "2006-01-02 15:04:05 -0700", "2006-01-02 15:04 -0700", "2006-01-02 15 -0700", "2006-01-02 -0700", "2006-01-02 15:04:05", "2006-01-02 15:04", "2006-01-02 15", "2006-01-02",
An example output is as follows:
"clusterName": "${cluster-namespace}/${cluster-name}",
"collectors"            "config",
    "monitor"
],
"date": "2021-12-10T10:10:54Z",
"from": "2021-12-08 12:00 +0800",
"id": "fMcXDZ4hNzs",
"status": "accepted",
"to": "2021-12-08 18:00 +0800"
Descriptions of the preceding output:
date: the time when the collection task is requested.id: the ID of the collection task. It is the only information to identify the collection task in the following operations.status: the current status of the task andacceptedmeans the task is queued.
Check the status of collecting data.
To check the status of the collection task, use the following API:
curl -s http://${host}:${port}/api/v1/collectors/${id}
{
            "clusterName": "${cluster-namespace}/${cluster-name}",
        "collectors": [
            "config",
            "monitor"
        ],
        "date": "2021-12-10T10:10:54Z",
        "from": "2021-12-08 12:00 +0800",
        "id": "fMcXDZ4hNzs",
        "status": "finished",
        "to": "2021-12-08 18:00 +0800"
}
In the preceding command,
idis the ID of the collection task, which isfMcXDZ4hNzsin this case. The output format of this step is the same as the request for collecting data step.When the status of the collection task becomes
finished, the collection task is completed.View the collected data.
After the collection task, you can get the collection time and data size using the following API:
curl -s http://${host}:${port}/api/v1/data/${id}
{
        "clusterName": "${cluster-namespace}/${cluster-name}",
        "date": "2021-12-10T10:10:54Z",
        "id": "fMcXDZ4hNzs",
        "size": 1788980746
}
With the preceding command, you can only get the size of the dataset but cannot view the detailed data.
Step 3: Upload data
To provide cluster diagnostic data to PingCAP technical support, you need to upload the data to the Clinic Server first, and then send the obtained data access link to the staff. The Clinic Server is a cloud service that stores and shares the collected data.
Request for an upload task.
You can upload the collected dataset using the following API:
curl -s http://${host}:${port}/api/v1/data/${id}/upload -XPOST
{
        "date": "2021-12-10T11:26:39Z",
        "id": "fMcXDZ4hNzs",
        "status": "accepted"
}
The response of the preceding command only indicates that the upload task is started but might not be completed. To check whether the upload task is completed, go to the next step.
Check the status of the upload task.
To check the status of the upload task, use the following API:
curl -s http://${host}:${port}/api/v1/data/${id}/upload
{
        "date": "2021-12-10T10:23:36Z",
        "id": "fMcXDZ4hNzs",
        "result": "\"https://clinic.pingcap.com/portal/#/orgs/XXXXXXXX/clusters/XXXXXXXX\"",
        "status": "finished"
}
When the status of the upload task becomes
finished, the upload task is completed. At this time,resultindicates the access link of the uploaded data in the Clinic Server, which is the link you need to send to the staff.
View data locally (optional)
The collected data is stored in the /diag/collector/diag-${id} directory. You can view the data in the Pod using the following steps.
Get
diag-collector-pod-name.To get the
diag-collector-pod-name, you can execute the following command:kubectl get pod --all-namespaces | grep diagAn example output is as follows:
tidb-admin diag-collector-69bf78478c-nvt47 1/1 Running 0 19hIn the preceding output, the name of Diag Pod is
diag-collector-69bf78478c-nvt47and thenamespaceistidb-admin.View data in Pod.
To view data in Pod, you can use the following command. You should replace
${namespace}with thenamespaceof TiDB Operator (usuallytidb-admin).kubectl exec -n ${namespace} ${diag-collector-pod-name} -it -- sh cd /diag/collector/diag-${id}
Use Diag to perform a quick check on the cluster
You can use PingCAP Clinic to perform a quick check on cluster health. It mainly checks the configurations for unreasonable configuration items.
How to use
The following introduces how to use PingCAP Clinic to perform a quick check on a cluster deployed using TiDB Operator.
Collect data.
For more about how to collect data, see Use Diag to collect data.
Diagnose data.
You can diagnose the data locally using the following command:
curl -s http://${host}:${port}/api/v1/data/${id}/check -XPOST -d '{"types": ["config"]}'In the preceding output,
idis the ID of the collection task, which isfMcXDZ4hNzsin this case.The result lists potential risks found in configurations and detailed configuration suggestions with corresponding knowledge base links. For example:
# Diagnostic result
basic 2022-02-07T12:00:00+08:00

## 1. Cluster basic Information
- Cluster ID: 7039963340562527412
- Cluster Name: basic
- Cluster Version: v5.4.0

## 2. Sampling Information
- Sample ID: fPrz0RnDxRn
- Sampling Date: 2022-02-07T12:00:00+08:00
- Sample Content:: [monitor config]

## 3. Diagnostic results, including potential configuration problems
In this inspection, 21 rules were executed.
The results of **3** rules were abnormal and needed to be further discussed with support team.
The following is the details of the abnormalities.

### Configuration rules
The configuration rules are all derived from PingCAP’s OnCall Service.
If the results of the configuration rules are found to be abnormal, they may cause the cluster to fail.
There were **3** abnormal results.

#### Rule Name: tidb-max-days
- RuleID: 100
- Variation: TidbConfig.log.file.max-days
- For more information, please visit: https://s.tidb.io/msmo6awg
- Check Result:
TidbConfig_172.20.21.213:4000   TidbConfig.log.file.max-days:0   warning

#### Rule Name: pdconfig-max-days
- RuleID: 209
- Variation: PdConfig.log.file.max-days
- For more information, please visit: https://s.tidb.io/jkdqxudq
- Check Result:
PdConfig_172.20.22.100:2379   PdConfig.log.file.max-days:0   warning
PdConfig_172.20.14.102:2379   PdConfig.log.file.max-days:0   warning
PdConfig_172.20.15.222:2379   PdConfig.log.file.max-days:0   warning

#### Rule Name: pdconfig-max-backups
- RuleID: 210
- Variation: PdConfig.log.file.max-backups
- For more information, please visit: https://s.tidb.io/brd9zy53
- Check Result:
PdConfig_172.20.22.100:2379   PdConfig.log.file.max-backups:0   warning
PdConfig_172.20.14.102:2379   PdConfig.log.file.max-backups:0   warning
PdConfig_172.20.15.222:2379   PdConfig.log.file.max-backups:0   warning

Result report and record are saved at /diag-fPrz0RnDxRn/report-220208030210
In the preceding example:
- The first part is the basic information about the cluster.
- The second part is the sampling information.
- The third part is the diagnostic results, including potential configuration problems. For each configuration potential risk found, Diag provides a corresponding knowledge base link with detailed configuration suggestions.
- The last line is the file path of the result report and record.