TiDB on Kubernetes Sysbench Performance Test
Since the release of TiDB Operator GA, more users begin to deploy and manage the TiDB cluster on Kubernetes using TiDB Operator. In this report, an in-depth and comprehensive test of TiDB has been conducted on GKE, which offers insight into the influencing factors that affect the performance of TiDB on Kubernetes.
Test purpose
- To test the performance of TiDB on a typical public cloud platform
- To test the influences that the public cloud platform, network, CPU and different Pod networks have on the performance of TiDB
Test environment
Version and configuration
In this test:
- TiDB 3.0.1 and TiDB Operator 1.0.0 are used.
- Three instances are deployed for PD, TiDB, and TiKV respectively.
- Each component is configured as below. Components not configured use the default values.
PD:
[log]
level = "info"
[replication]
location-labels = ["region", "zone", "rack", "host"]
TiDB:
[log]
level = "error"
[prepared-plan-cache]
enabled = true
[tikv-client]
max-batch-wait-time = 2000000
TiKV:
log-level = "error"
[server]
status-addr = "0.0.0.0:20180"
grpc-concurrency = 6
[readpool.storage]
normal-concurrency = 10
[rocksdb.defaultcf]
block-cache-size = "14GB"
[rocksdb.writecf]
block-cache-size = "8GB"
[rocksdb.lockcf]
block-cache-size = "1GB"
[raftstore]
apply-pool-size = 3
store-pool-size = 3
TiDB parameter configuration
set global tidb_hashagg_final_concurrency=1;
set global tidb_hashagg_partial_concurrency=1;
set global tidb_disable_txn_auto_retry=0;
Hardware recommendations
Machine types
For the test in single AZ (Available Zone), the following machine types are chosen:
| Component | Instance type | Count |
|---|---|---|
| PD | n1-standard-4 | 3 |
| TiKV | c2-standard-16 | 3 |
| TiDB | c2-standard-16 | 3 |
| Sysbench | c2-standard-30 | 1 |
For the test (2019.08) where the result in multiple AZs is compared with that in a single AZ, the c2 machine is not simultaneously available in three AZs within the same Google Cloud region, so the following machine types are chosen:
| Component | Instance type | Count |
|---|---|---|
| PD | n1-standard-4 | 3 |
| TiKV | n1-standard-16 | 3 |
| TiDB | n1-standard-16 | 3 |
| Sysbench | n1-standard-16 | 3 |
Sysbench, the pressure test platform, has a high demand on CPU in the high concurrency read test. Therefore, it is recommended that you use machines with high configuration and multiple cores so that the test platform does not become the bottleneck.
Disk
The NVMe disks on GKE are still in the Alpha phase, so it requires special application to use them and is not for general usage. In this test, the iSCSI interface type is used for all local SSD disks. With reference to the official recommendations, the discard,nobarrier option has been added to the mounting parameter. Below is a complete example:
sudo mount -o defaults,nodelalloc,noatime,discard,nobarrier /dev/[LOCAL_SSD_ID] /mnt/disks/[MNT_DIR]
Network
GKE uses a more scalable and powerful VPC-Native mode as its network mode. In the performance comparison, TiDB is tested with Kubernetes Pod and Host respectively.
CPU
- In the test on a single AZ cluster, the c2-standard-16 machine mode is chosen for TiDB/TiKV.
- In the comparison test on a single AZ cluster and on multiple AZs cluster, the c2-standard-16 machine type cannot be simultaneously adopted in three AZs within the same Google Cloud region, so n1-standard-16 machine type is chosen.
Operation system and parameters
GKE supports two operating systems: COS (Container Optimized OS) and Ubuntu. The Point Select test is conducted on both systems and the results are compared. Other tests are only conducted on Ubuntu.
The core is configured as below:
sysctl net.core.somaxconn=32768
sysctl vm.swappiness=0
sysctl net.ipv4.tcp_syncookies=0
The maximum number of files is configured as 1000000.
Sysbench version and operating parameters
In this test, the version of sysbench is 1.0.17.
Before the test, the prewarm command of oltp_common is used to warm up data.
Initialization
sysbench \
  --mysql-host=${tidb_host} \
  --mysql-port=4000 \
  --mysql-user=root \
  --mysql-db=sbtest \
  --time=600 \
  --threads=16 \
  --report-interval=10 \
  --db-driver=mysql \
  --rand-type=uniform \
  --rand-seed=$RANDOM \
  --tables=16 \
  --table-size=10000000 \
  oltp_common \
  prepare
${tidb_host} is the address of the TiDB database, which is specified according to actual test needs. For example, Pod IP, Service domain name, Host IP, and Load Balancer IP (the same below).
Warming-up
sysbench \
  --mysql-host=${tidb_host} \
  --mysql-port=4000 \
  --mysql-user=root \
  --mysql-db=sbtest \
  --time=600 \
  --threads=16 \
  --report-interval=10 \
  --db-driver=mysql \
  --rand-type=uniform \
  --rand-seed=$RANDOM \
  --tables=16 \
  --table-size=10000000 \
  oltp_common \
  prewarm
Pressure test
sysbench \
  --mysql-host=${tidb_host} \
  --mysql-port=4000 \
  --mysql-user=root \
  --mysql-db=sbtest \
  --time=600 \
  --threads=${threads} \
  --report-interval=10 \
  --db-driver=mysql \
  --rand-type=uniform \
  --rand-seed=$RANDOM \
  --tables=16 \
  --table-size=10000000 \
  ${test} \
  run
${test} is the test case of sysbench. In this test, oltp_point_select, oltp_update_index, oltp_update_no_index, and oltp_read_write are chosen as ${test}.
Test report
In single AZ
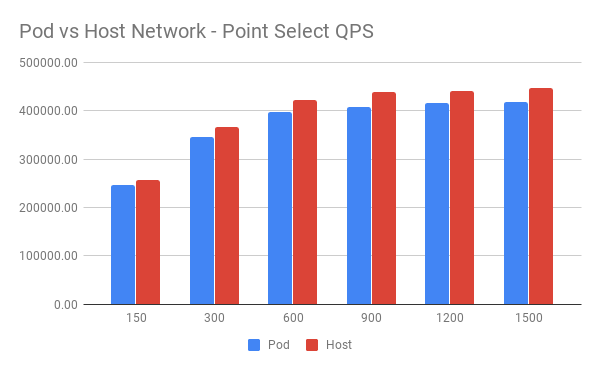
Pod Network vs Host Network
Kubernetes allows Pods to run in Host network mode. This way of deployment is suitable when a TiDB instance occupies the whole machine without causing any Pod conflict. The Point Select test is conducted in both modes respectively.
In this test, the operating system is COS.
Pod Network:
| Threads | QPS | 95% latency(ms) |
|---|---|---|
| 150 | 246386.44 | 0.95 |
| 300 | 346557.39 | 1.55 |
| 600 | 396715.66 | 2.86 |
| 900 | 407437.96 | 4.18 |
| 1200 | 415138.00 | 5.47 |
| 1500 | 419034.43 | 6.91 |
Host Network:
| Threads | QPS | 95% latency(ms) |
|---|---|---|
| 150 | 255981.11 | 1.06 |
| 300 | 366482.22 | 1.50 |
| 600 | 421279.84 | 2.71 |
| 900 | 438730.81 | 3.96 |
| 1200 | 441084.13 | 5.28 |
| 1500 | 447659.15 | 6.67 |
QPS comparison:
Latency comparison:
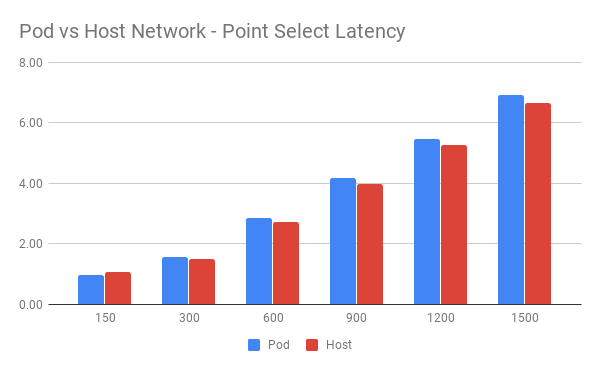
From the images above, the performance in Host network mode is slightly better than that in Pod network.
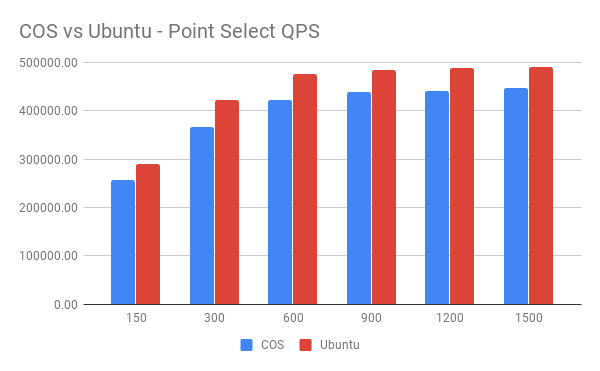
Ubuntu vs COS
GKE provides Ubuntu and COS for each node. In this test, the Point Select test of TiDB is conducted on both systems.
The network mode is Host.
COS:
| Threads | QPS | 95% latency(ms) |
|---|---|---|
| 150 | 255981.11 | 1.06 |
| 300 | 366482.22 | 1.50 |
| 600 | 421279.84 | 2.71 |
| 900 | 438730.81 | 3.96 |
| 1200 | 441084.13 | 5.28 |
| 1500 | 447659.15 | 6.67 |
Ubuntu:
| Threads | QPS | 95% latency(ms) |
|---|---|---|
| 150 | 290690.51 | 0.74 |
| 300 | 422941.17 | 1.10 |
| 600 | 476663.44 | 2.14 |
| 900 | 484405.99 | 3.25 |
| 1200 | 489220.93 | 4.33 |
| 1500 | 489988.97 | 5.47 |
QPS comparison:
Latency comparison:
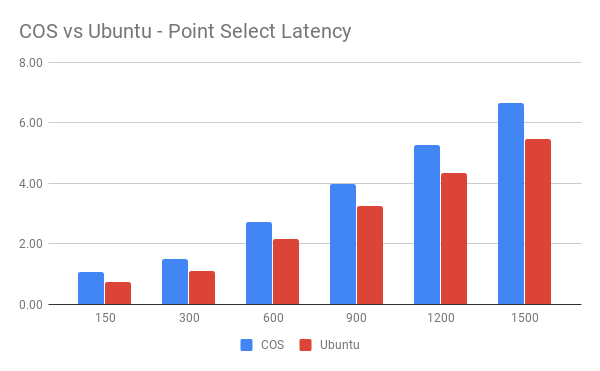
From the images above, TiDB performs better on Ubuntu than on COS in the Point Select test.
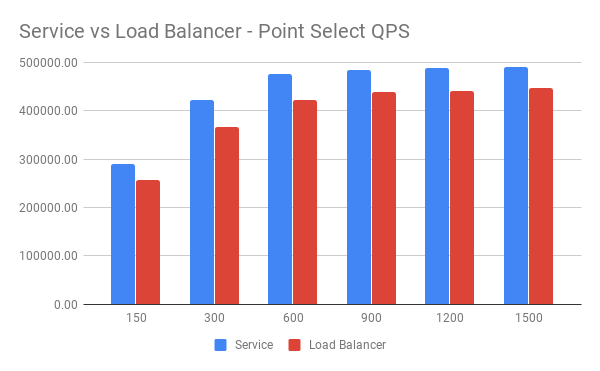
Kubernetes Service vs Google Cloud LoadBalancer
After TiDB is deployed on Kubernetes, there are two ways of accessing TiDB: via Kubernetes Service inside the cluster, or via Load Balancer IP outside the cluster. TiDB is tested in both ways.
In this test, the operating system is Ubuntu and the network mode is Host.
Service:
| Threads | QPS | 95% latency(ms) |
|---|---|---|
| 150 | 290690.51 | 0.74 |
| 300 | 422941.17 | 1.10 |
| 600 | 476663.44 | 2.14 |
| 900 | 484405.99 | 3.25 |
| 1200 | 489220.93 | 4.33 |
| 1500 | 489988.97 | 5.47 |
Load Balancer:
| Threads | QPS | 95% latency(ms) |
|---|---|---|
| 150 | 255981.11 | 1.06 |
| 300 | 366482.22 | 1.50 |
| 600 | 421279.84 | 2.71 |
| 900 | 438730.81 | 3.96 |
| 1200 | 441084.13 | 5.28 |
| 1500 | 447659.15 | 6.67 |
QPS comparison:
Latency comparison:
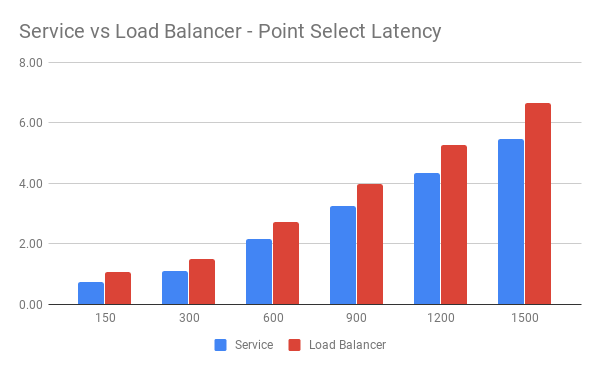
From the images above, TiDB performs better when accessed via Kubernetes Service than accessed via Google Cloud Load Balancer in the Point Select test.
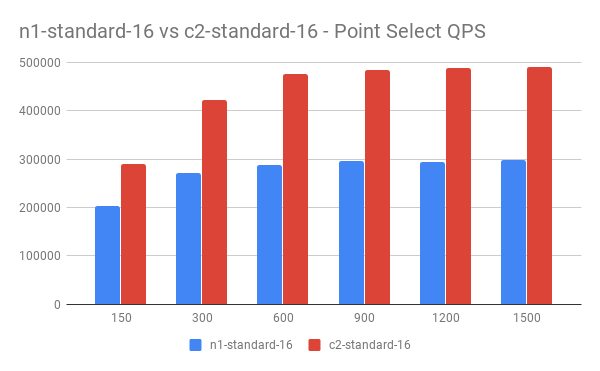
n1-standard-16 vs c2-standard-16
In the Point Select read test, TiDB's CPU usage exceeds 1400% (16 cores) while TiKV's CPU usage is about 1000% (16 cores).
The test compares the TiDB performance on general machine types with that on machines which are optimized for computing. In this performance comparison, the frequency of n1-standard-16 is about 2.3G, and the frequency of c2-standard-16 is about 3.1G.
In this test, the operating system is Ubuntu and the Pod network is Host. TiDB is accessed via Kubernetes Service.
n1-standard-16:
| Threads | QPS | 95% latency(ms) |
|---|---|---|
| 150 | 203879.49 | 1.37 |
| 300 | 272175.71 | 2.3 |
| 600 | 287805.13 | 4.1 |
| 900 | 295871.31 | 6.21 |
| 1200 | 294765.83 | 8.43 |
| 1500 | 298619.31 | 10.27 |
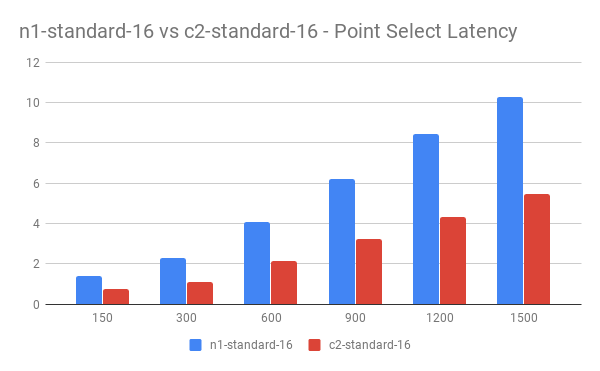
c2-standard-16:
| Threads | QPS | 95% latency(ms) |
|---|---|---|
| 150 | 290690.51 | 0.74 |
| 300 | 422941.17 | 1.10 |
| 600 | 476663.44 | 2.14 |
| 900 | 484405.99 | 3.25 |
| 1200 | 489220.93 | 4.33 |
| 1500 | 489988.97 | 5.47 |
QPS comparison:
Latency comparison:
OLTP and other tests
The Point Select test is conducted on different operating systems and in different network modes, and the test results are compared. In addition, other tests in the OLTP test set are also conducted on Ubuntu in Host network mode where the TiDB cluster is accessed via Kubernetes Service.
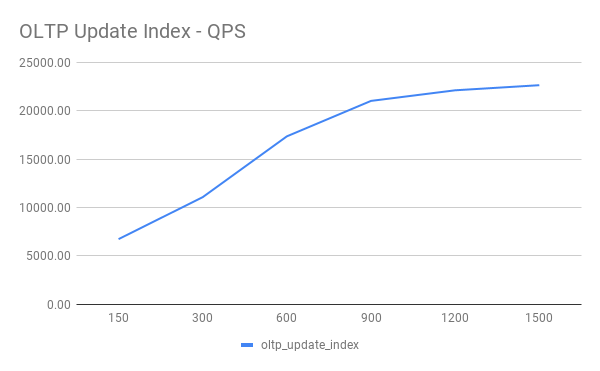
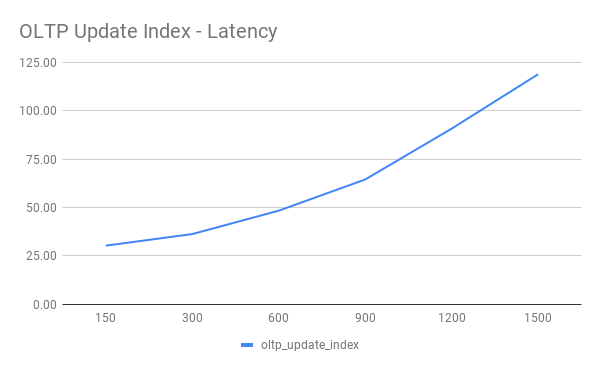
OLTP Update Index
| Threads | QPS | 95% latency(ms) |
|---|---|---|
| 150 | 6726.59 | 30.26 |
| 300 | 11067.55 | 36.24 |
| 600 | 17358.46 | 48.34 |
| 900 | 21025.23 | 64.47 |
| 1200 | 22121.87 | 90.78 |
| 1500 | 22650.13 | 118.92 |
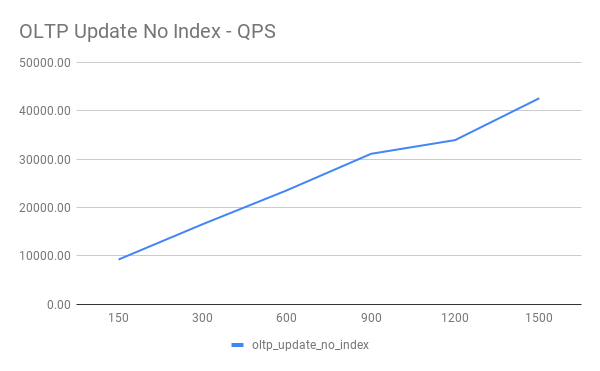
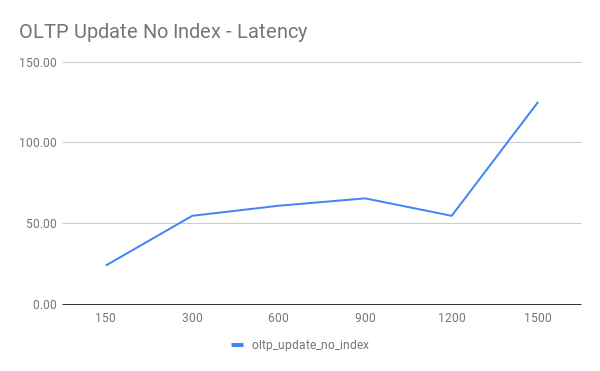
OLTP Update Non Index
| Threads | QPS | 95% latency(ms) |
|---|---|---|
| 150 | 9230.60 | 23.95 |
| 300 | 16543.63 | 54.83 |
| 600 | 23551.01 | 61.08 |
| 900 | 31100.10 | 65.65 |
| 1200 | 33942.60 | 54.83 |
| 1500 | 42603.13 | 125.52 |
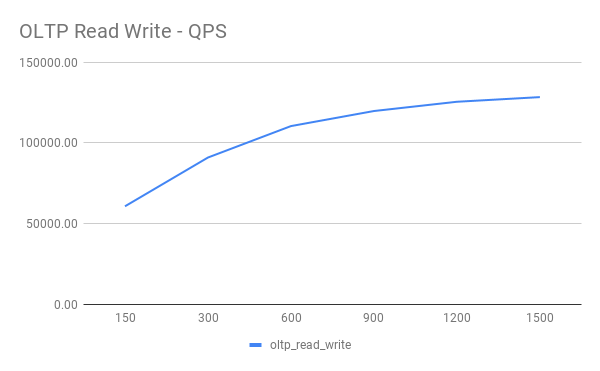
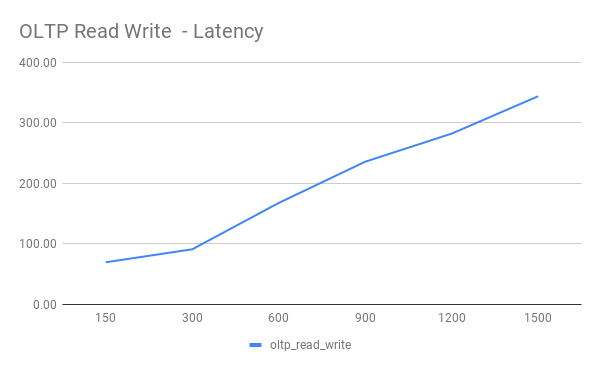
OLTP Read Write
| Threads | QPS | 95% latency(ms) |
|---|---|---|
| 150 | 60732.84 | 69.29 |
| 300 | 91005.98 | 90.78 |
| 600 | 110517.67 | 167.44 |
| 900 | 119866.38 | 235.74 |
| 1200 | 125615.89 | 282.25 |
| 1500 | 128501.34 | 344.082 |
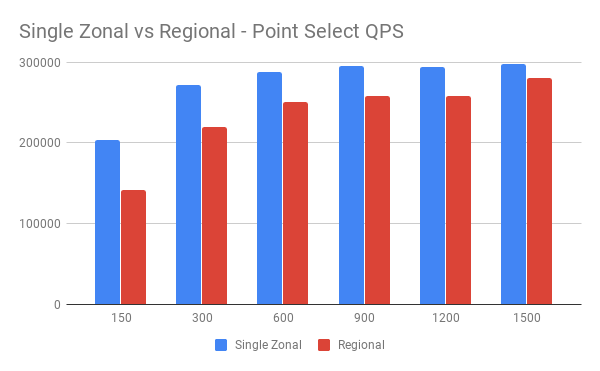
Performance comparison between single AZ and multiple AZs
The network latency on communication across multiple AZs in Google Cloud is slightly higher than that within the same zone. In this test, machines of the same configuration are used in different deployment plans under the same standard. The purpose is to learn how the latency across multiple AZs might affect the performance of TiDB.
Single AZ:
| Threads | QPS | 95% latency(ms) |
|---|---|---|
| 150 | 203879.49 | 1.37 |
| 300 | 272175.71 | 2.30 |
| 600 | 287805.13 | 4.10 |
| 900 | 295871.31 | 6.21 |
| 1200 | 294765.83 | 8.43 |
| 1500 | 298619.31 | 10.27 |
Multiple AZs:
| Threads | QPS | 95% latency(ms) |
|---|---|---|
| 150 | 141027.10 | 1.93 |
| 300 | 220205.85 | 2.91 |
| 600 | 250464.34 | 5.47 |
| 900 | 257717.41 | 7.70 |
| 1200 | 258835.24 | 10.09 |
| 1500 | 280114.00 | 12.75 |
QPS comparison:
Latency comparison:
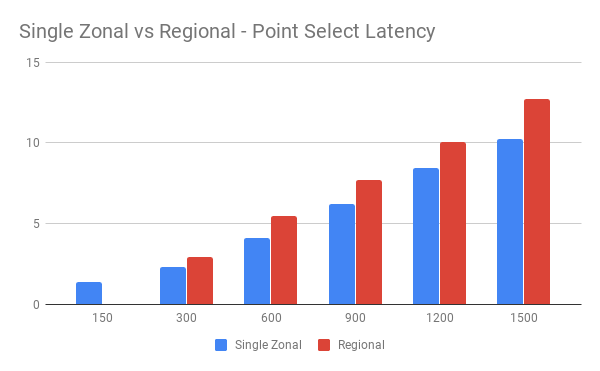
From the images above, the impact of network latency goes down as the concurrency pressure increases. In this situation, the extra network latency is no longer the main bottleneck of performance.
Conclusion
This is a test of TiDB using sysbench running on Kubernetes deployed on a typical public cloud platform. The purpose is to learn how different factors might affect the performance of TiDB. On the whole, these influencing factors include the following items:
- In the VPC-Native mode, TiDB performs slightly better in Host network than in Pod network. (The difference, ~7%, is measured in QPS. Performance differences caused by the factors below are also measured by QPS.)
- In Host network, TiDB performs better (~9%) in the read test on Ubuntu provided by Google Cloud than on COS.
- The TiDB performance is slightly lower (~5%) if it is accessed outside the cluster via Load Balancer.
- Increased latency among nodes in multiple AZs has a certain impact on the TiDB performance (30% ~ 6%; the impact diminishes as the concurrent number increases).
- The QPS performance is greatly improved (50% ~ 60%) if the Point Select read test is conducted on machines of computing type (compared with general types), because the test mainly consumes CPU resources.