TiKV 监控指标详解
使用 TiUP 部署 TiDB 集群时,一键部署监控系统 (Prometheus & Grafana),监控架构参见 TiDB 监控框架概述。
目前 Grafana Dashboard 整体分为 PD、TiDB、TiKV、Node_exporter、Overview 等。
对于日常运维,我们通过观察 TiKV-Details 面板上的指标,可以了解 TiKV 当前的状态。根据性能地图可以检查集群的状态是否符合预期。
以下为 TiKV-Details 默认的监控信息:
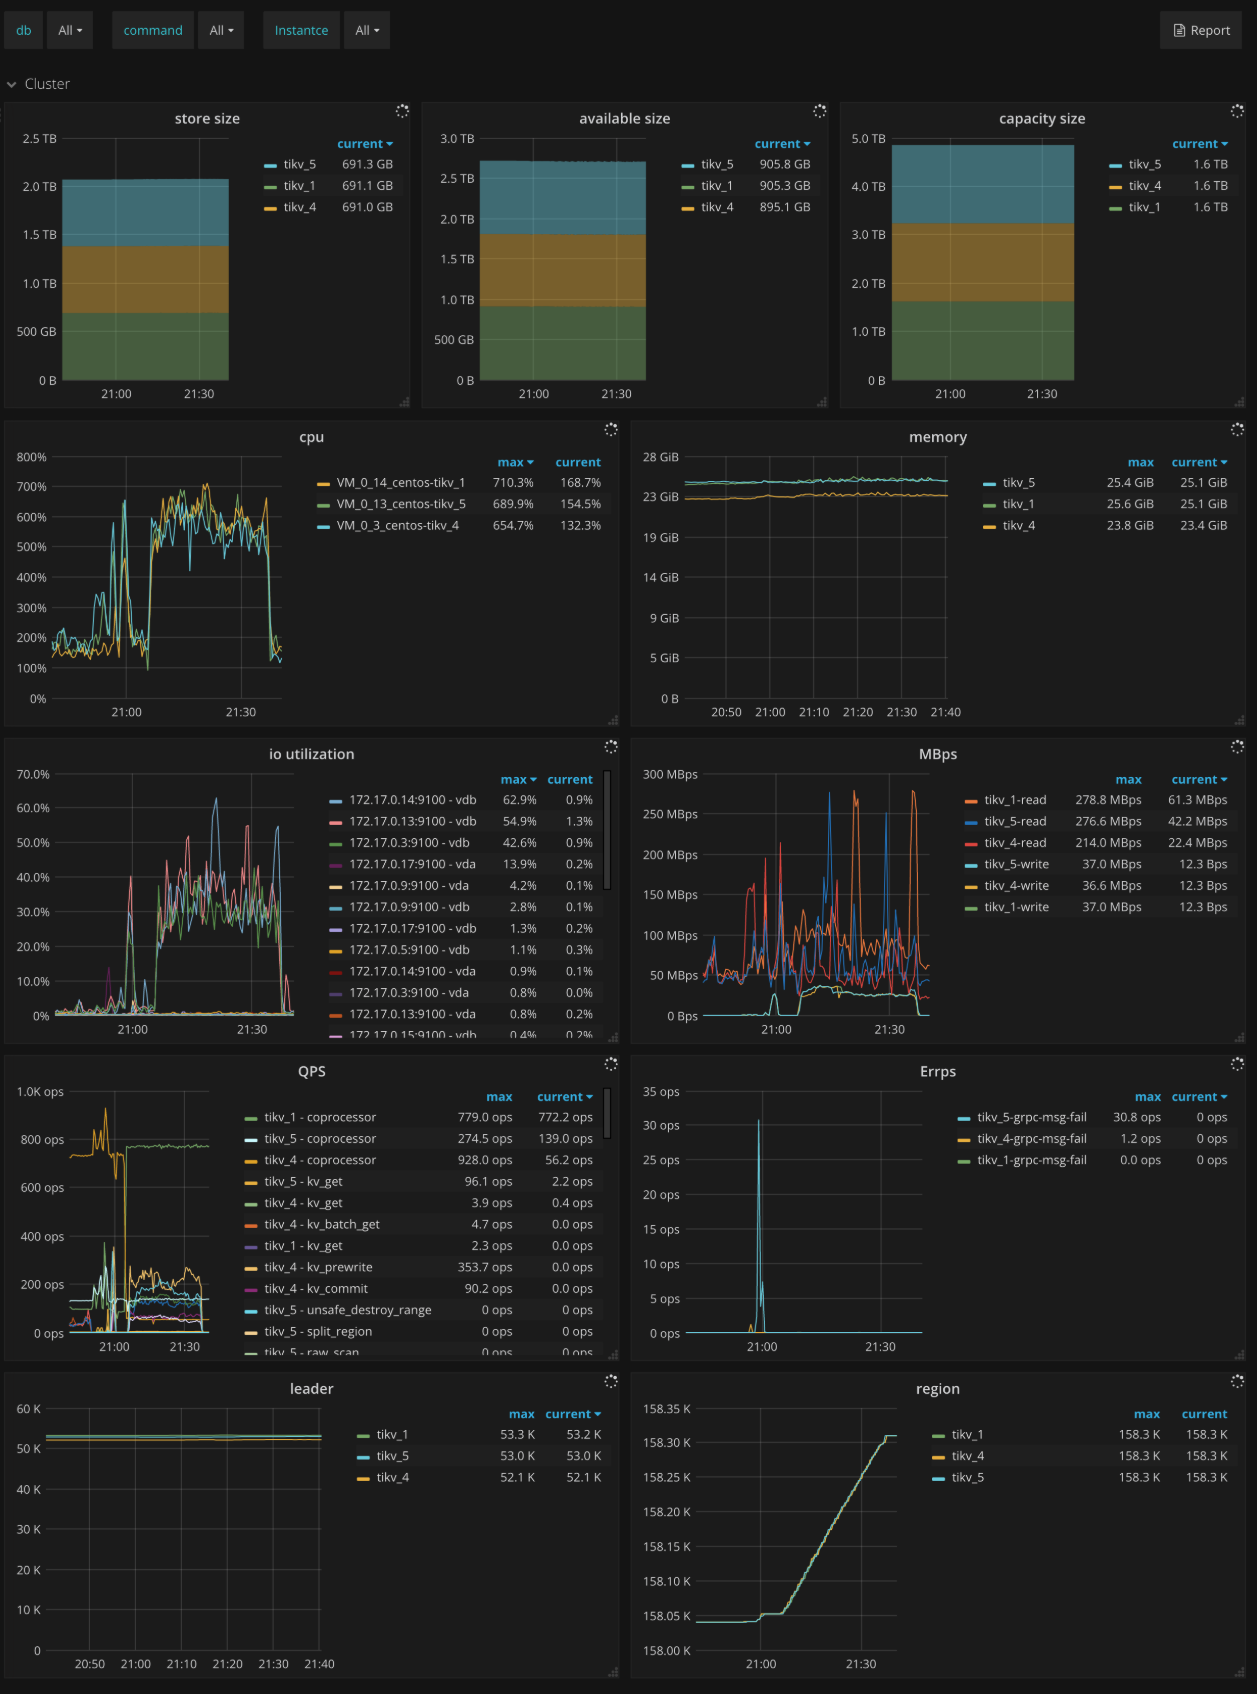
Cluster
- Store size:每个 TiKV 实例的使用的存储空间的大小
- Available size:每个 TiKV 实例的可用的存储空间的大小
- Capacity size:每个 TiKV 实例的存储容量的大小
- CPU:每个 TiKV 实例 CPU 的使用率
- Memory:每个 TiKV 实例内存的使用情况
- IO utilization:每个 TiKV 实例 IO 的使用率
- MBps:每个 TiKV 实例写入和读取的数据量大小
- QPS:每个 TiKV 实例上各种命令的 QPS
- Errps:每个 TiKV 实例上 gRPC 消息失败的速率
- leader:每个 TiKV 实例 leader 的个数
- Region:每个 TiKV 实例 Region 的个数
- Uptime:自上次重启以来 TiKV 正常运行的时间
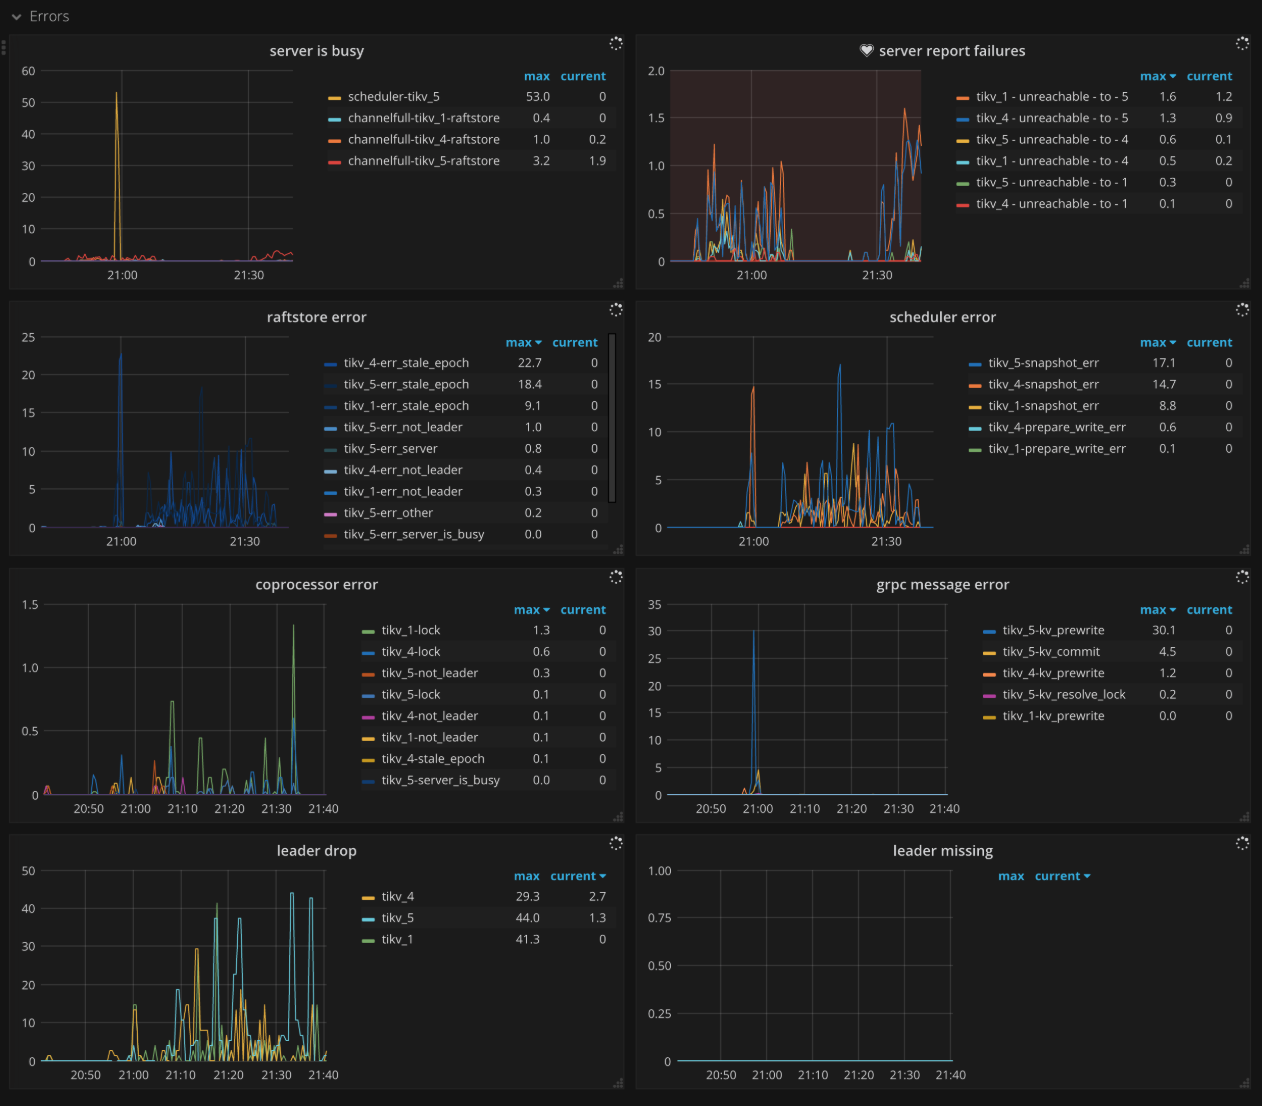
Errors
- Critical error:严重错误的数量
- Server is busy:各种会导致 TiKV 实例暂时不可用的事件个数,如 write stall,channel full 等,正常情况下应当为 0
- Server report failures:server 报错的消息个数,正常情况下应当为 0
- Raftstore error:每个 TiKV 实例上 raftstore 发生错误的个数
- Scheduler error:每个 TiKV 实例上 scheduler 发生错误的个数
- Coprocessor error:每个 TiKV 实例上 coprocessor 发生错误的个数
- gRPC message error:每个 TiKV 实例上 gRPC 消息发生错误的个数
- Leader drop:每个 TiKV 实例上 drop leader 的个数
- Leader missing:每个 TiKV 实例上 missing leader 的个数
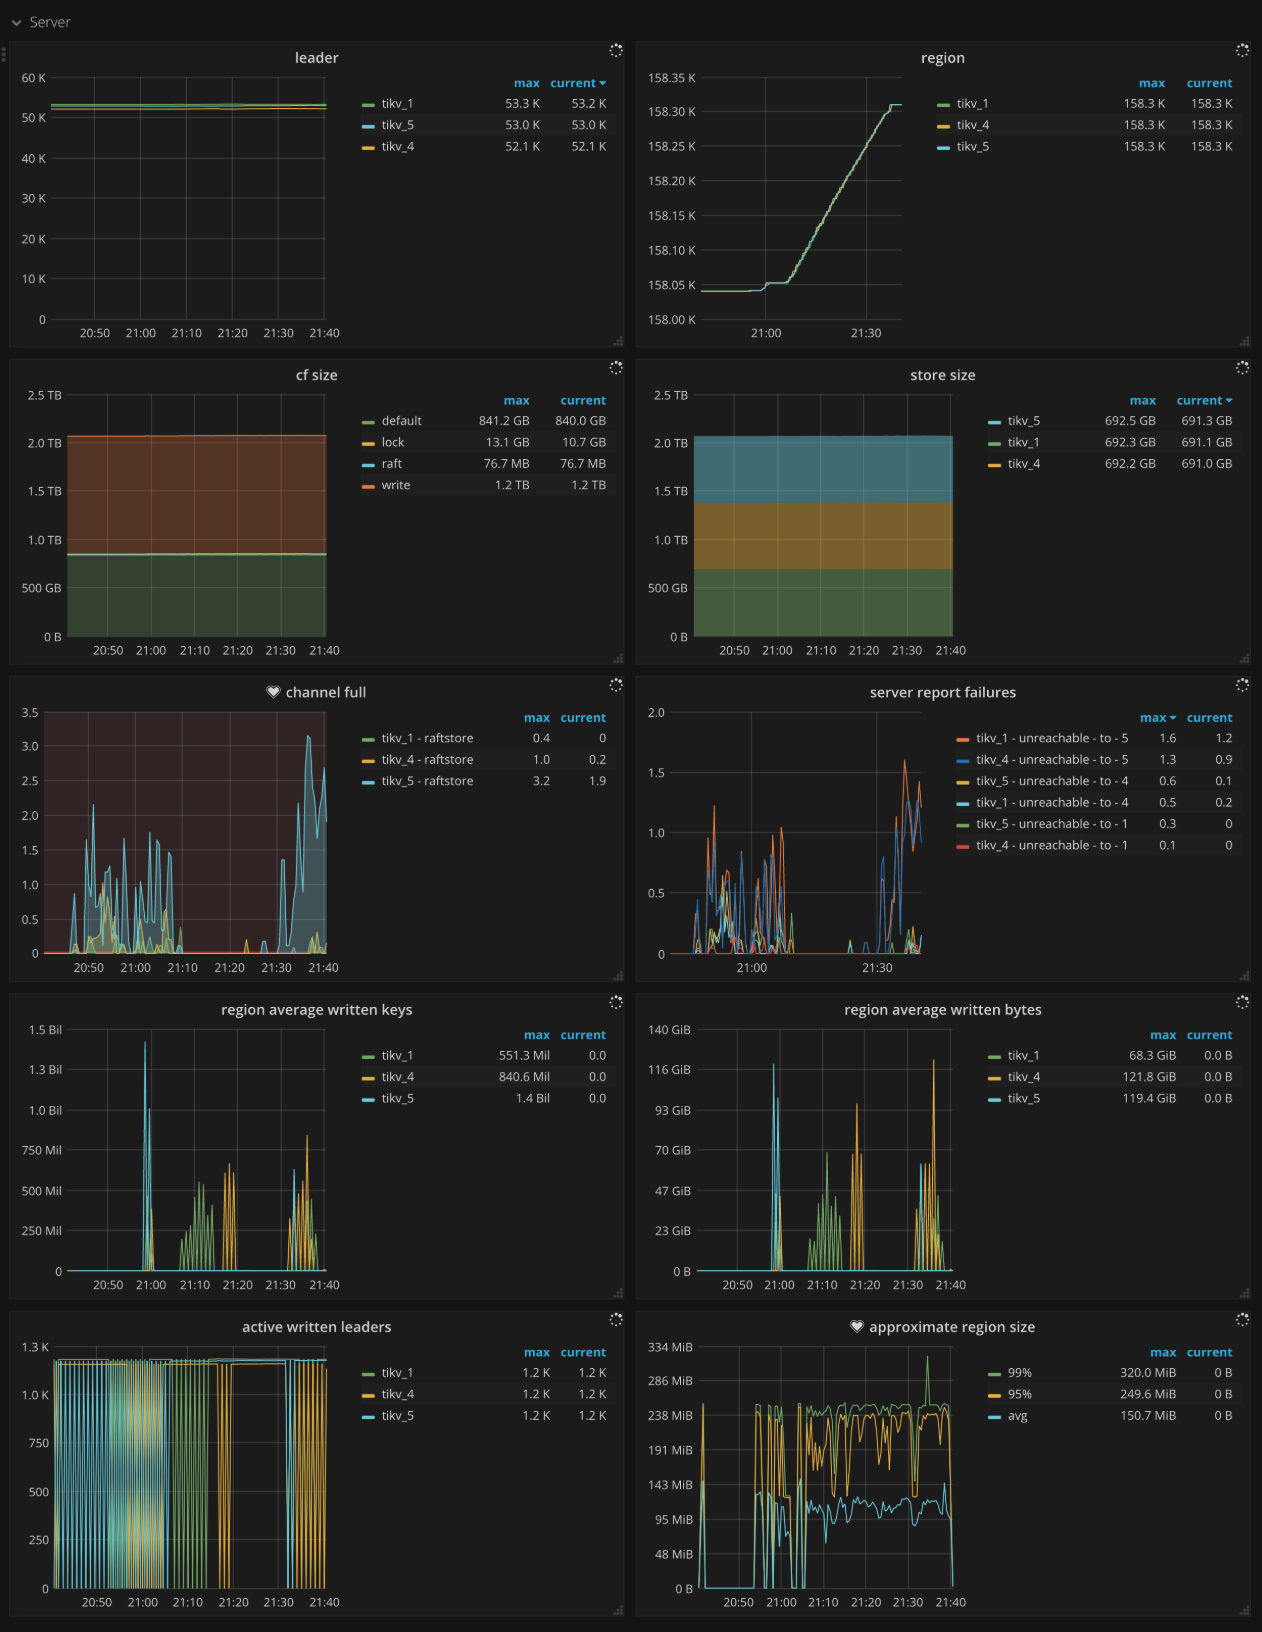
Server
- CF size:每个列族的大小
- Store size:每个 TiKV 实例的使用的存储空间的大小
- Channel full:每个 TiKV 实例上 channel full 错误的数量,正常情况下应当为 0
- Active written leaders:各个 TiKV 实例中正在被写入的 Leader 的数量
- Approximate Region size:每个 Region 近似的大小
- Approximate Region size Histogram:每个 Region 近似大小的直方图
- Region average written keys:每个 TiKV 实例上所有 Region 的平均 key 写入个数
- Region average written bytes:每个 TiKV 实例上所有 Region 的平均写入大小
gRPC
- gRPC message count:每种 gRPC 请求的速度
- gRPC message failed:失败的 gRPC 请求的速度
- 99% gRPC message duration:99% gRPC 请求的执行时间小于该值
- Average gRPC message duration:gRPC 请求平均的执行时间
- gRPC batch size:TiDB 与 TiKV 之间 grpc 请求的 batch 大小
- raft message batch size:TiKV 与 TiKV 之间 raft 消息的 batch 大小
Thread CPU
- Raft store CPU:raftstore 线程的 CPU 使用率,通常应低于 80% *
raftstore.store-pool-size - Async apply CPU:async apply 线程的 CPU 使用率,通常应低于 90% *
raftstore.apply-pool-size - Scheduler worker CPU:scheduler worker 线程的 CPU 使用率,通常应低于 90% *
storage.scheduler-worker-pool-size - gRPC poll CPU:gRPC 线程的 CPU 使用率,通常应低于 80% *
server.grpc-concurrency - Unified read pool CPU:unified read pool 线程的 CPU 使用率
- Storage ReadPool CPU:storage read pool 线程的 CPU 使用率
- Coprocessor CPU:coprocessor 线程的 CPU 使用率
- RocksDB CPU:RocksDB 线程的 CPU 使用率
- GC worker CPU:GC worker 线程的 CPU 使用率
- BackGround worker CPU:background worker 线程的 CPU 使用率
PD
- PD requests:TiKV 发送给 PD 的请求速度
- PD request duration (average):TiKV 发送给 PD 的请求处理的平均时间
- PD heartbeats:发送给 PD 的心跳的速度
- PD validate peers:TiKV 发送给 PD 用于验证 TiKV 的 peer 有效的消息的速度
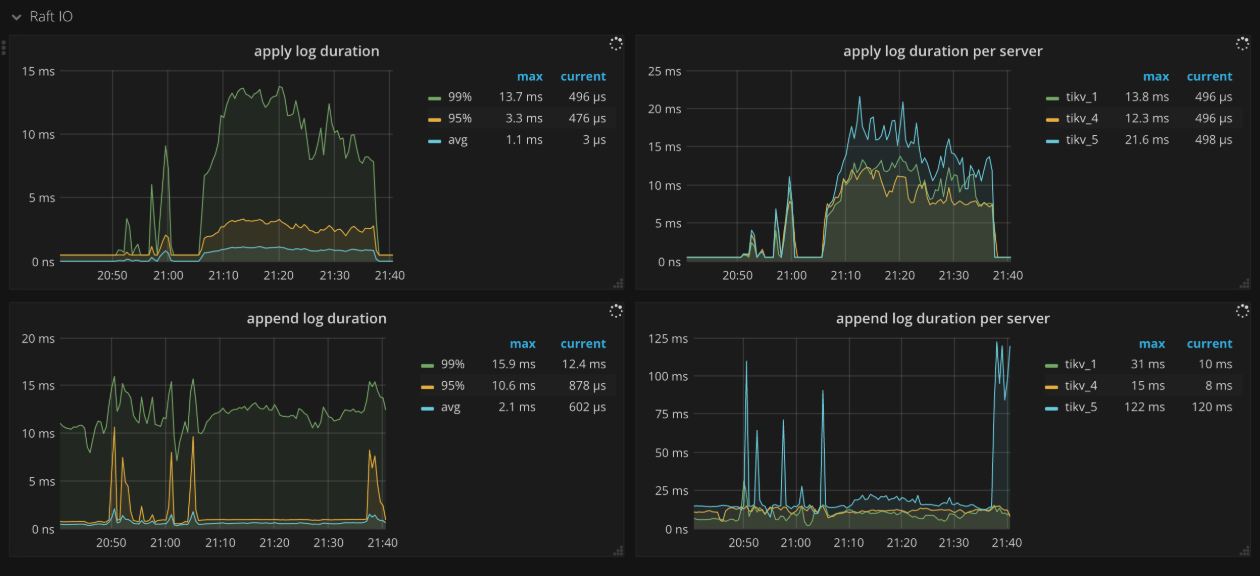
Raft IO
- Apply log duration:Raft apply 日志所花费的时间
- Apply log duration per server:每个 TiKV 实例上 Raft apply 日志所花费的时间
- Append log duration:Raft append 日志所花费的时间
- Append log duration per server:每个 TiKV 实例上 Raft append 日志所花费的时间
- Commit log duration:Raft commit 日志所花费的时间
- Commit log duration per server:每个 TiKV 实例上 Raft commit 日志所花费的时间
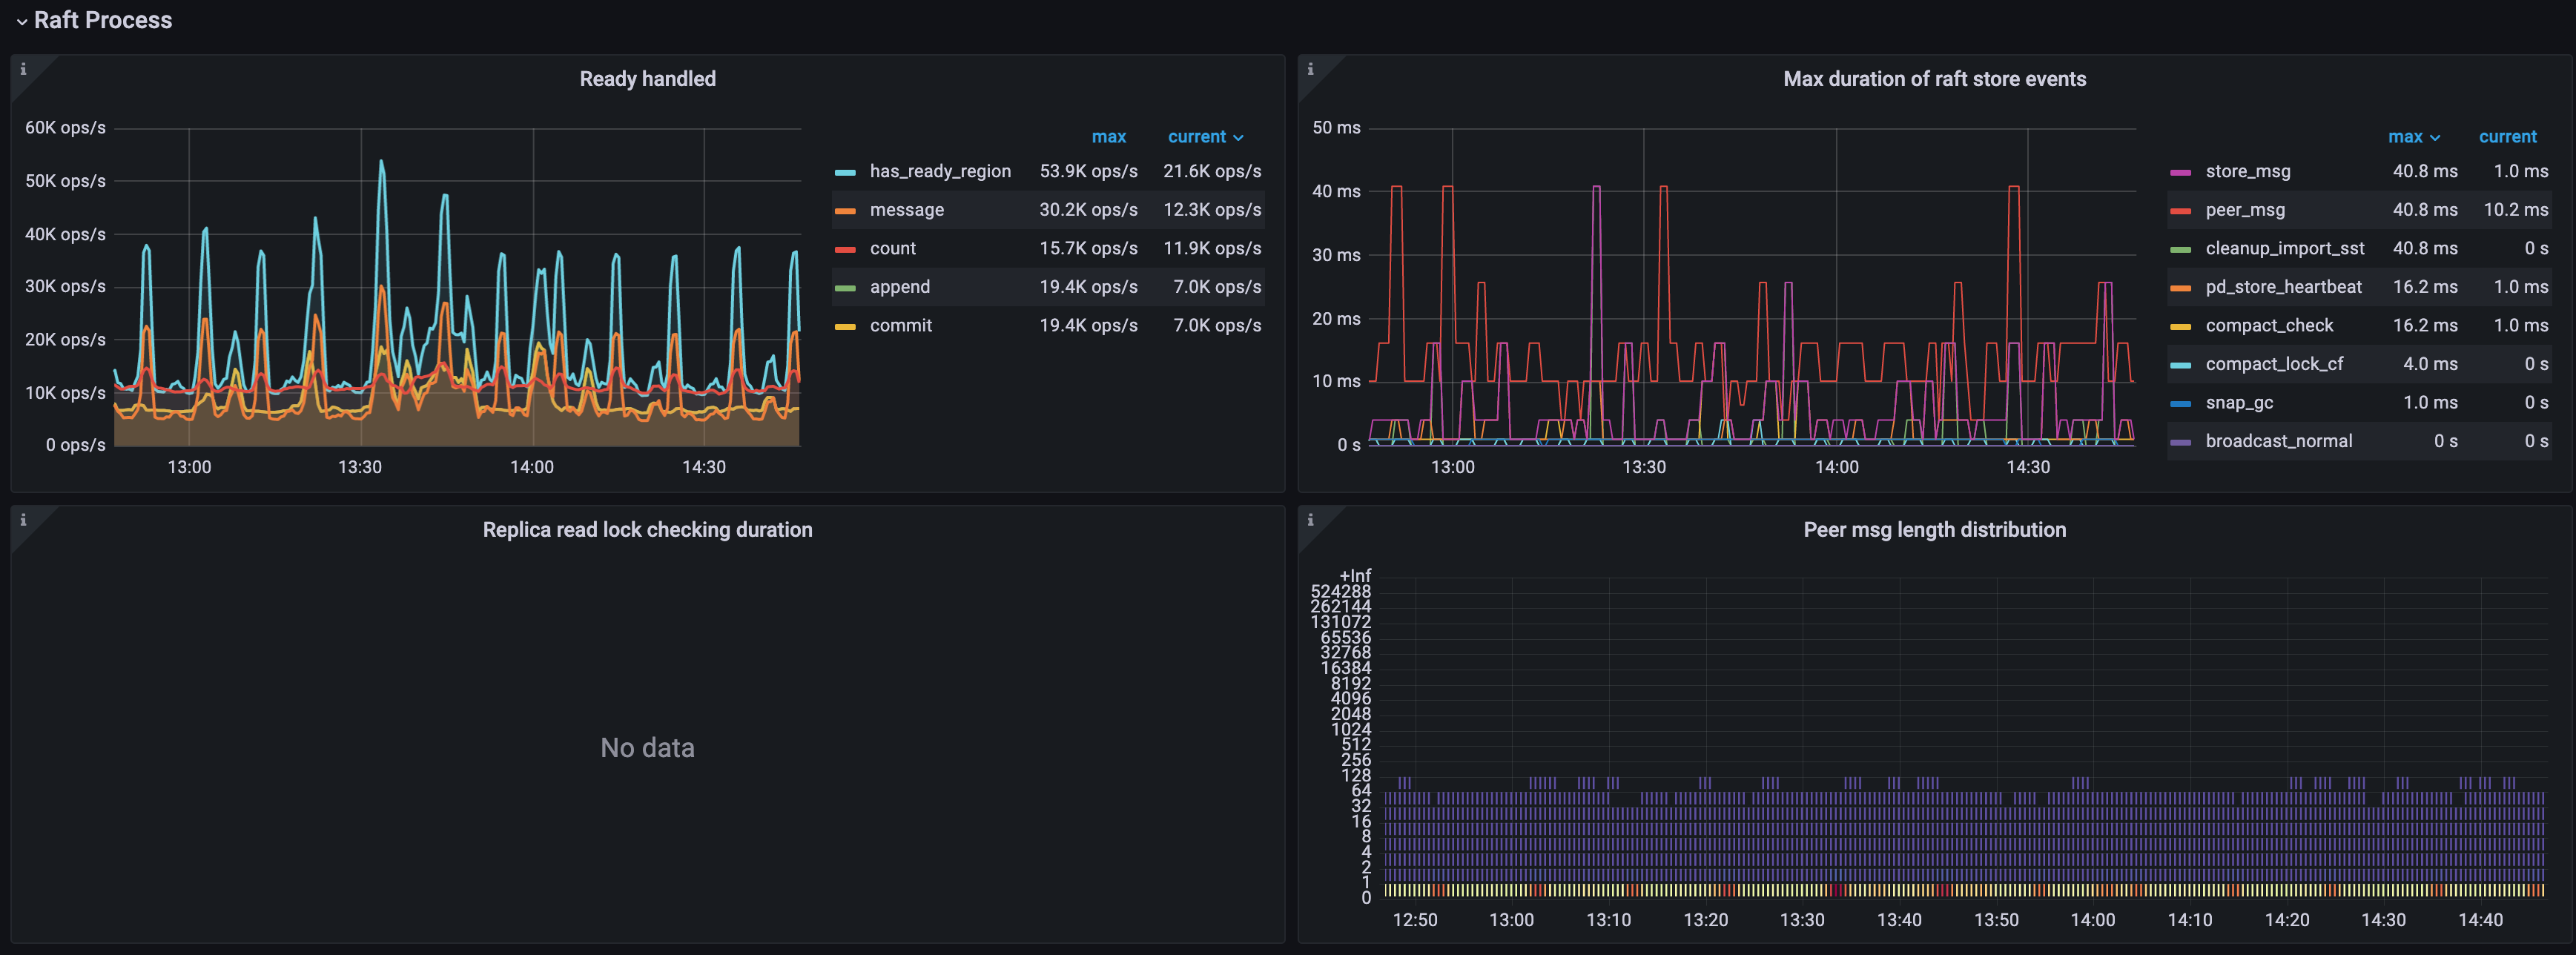
Raft process
- Ready handled:Raft 中不同 ready 类型的 ops
- count: 批量处理 ready 的 ops
- has_ready_region: 获得 ready 的 Region 的 ops
- pending_region: 被检查是否获得 ready 的 Region 的 ops,v3.0.0 后废弃
- message: ready 内待发送 message 的 ops
- append: ready 内 Raft log entry 的 ops
- commit: ready 内 committed Raft log entry 的 ops
- snapshot: 携带 snapshot 的 ready 的 ops
- 0.99 Duration of Raft store events:99% 的 raftstore 事件所花费的时间
- Process ready duration:处理 ready 所花费的时间
- Process ready duration per server:每个 TiKV 实例处理 ready 所花费的时间,99.99% 的情况下,应该小于 2s
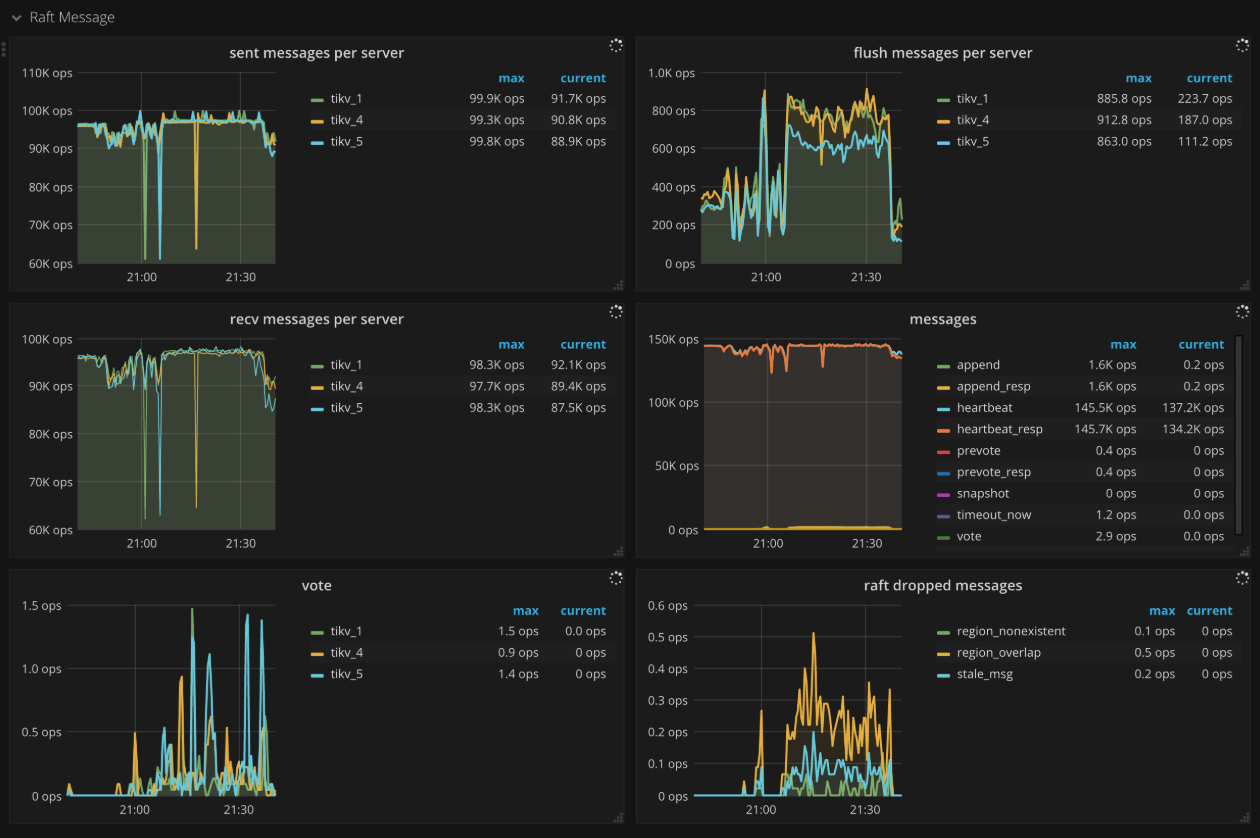
Raft message
- Sent messages per server:每个 TiKV 实例发送 Raft 消息的 ops
- Flush messages per server:每个 TiKV 实例中 raft client 往外 flush Raft 消息的 ops
- Receive messages per server:每个 TiKV 实例接受 Raft 消息的 ops
- Messages:发送不同类型的 Raft 消息的 ops
- Vote:Raft 投票消息发送的 ops
- Raft dropped messages:每秒钟丢弃不同类型的 Raft 消息的个数
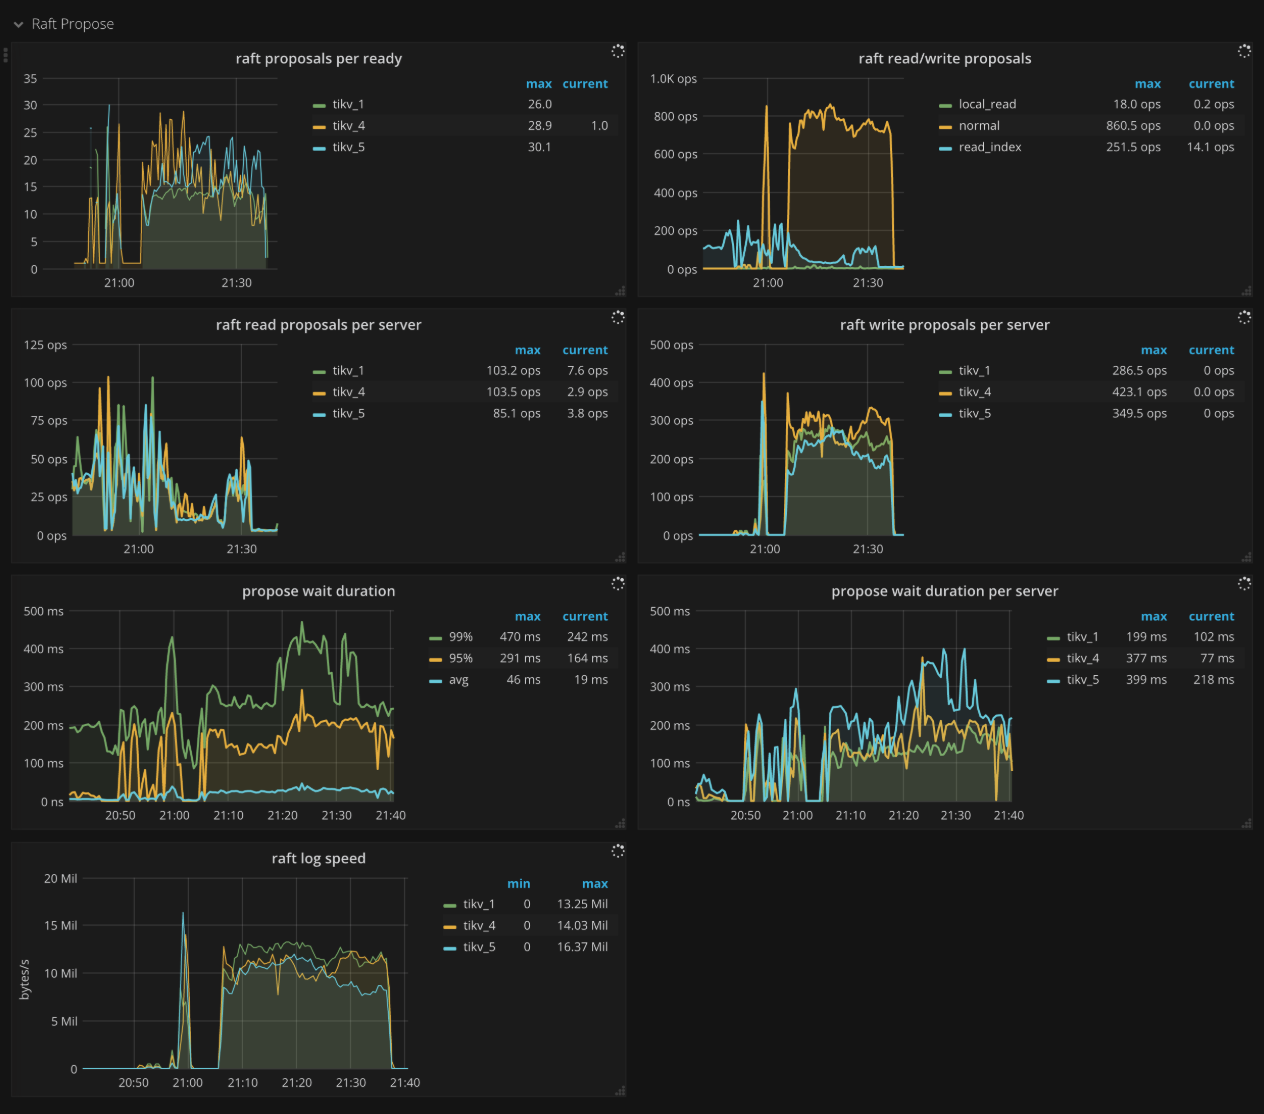
Raft propose
- Raft apply proposals per ready:在一个 batch 内,apply proposal 时每个 ready 中包含 proposal 的个数的直方图
- Raft read/write proposals:不同类型的 proposal 的 ops
- Raft read proposals per server:每个 TiKV 实例发起读 proposal 的 ops
- Raft write proposals per server:每个 TiKV 实例发起写 proposal 的 ops
- Propose wait duration:proposal 的等待时间的直方图
- Propose wait duration per server:每个 TiKV 实例上每个 proposal 的等待时间的直方图
- Apply wait duration:apply 的等待时间的直方图
- Apply wait duration per server:每个 TiKV 实例上每个 apply 的等待时间的直方图
- Raft log speed:peer propose 日志的平均速度
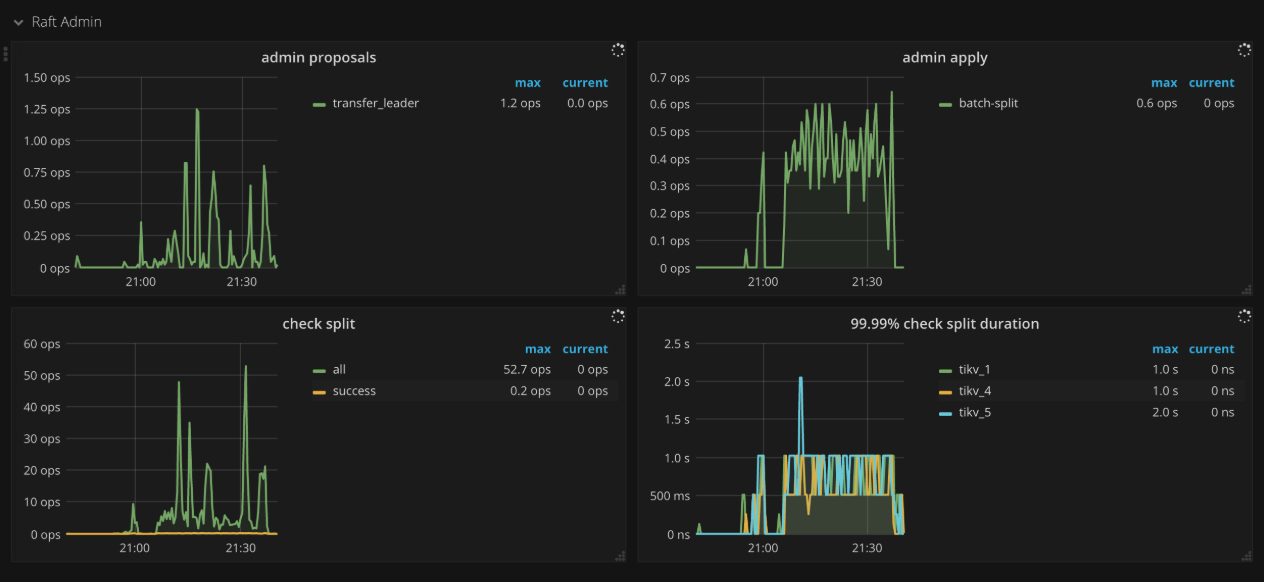
Raft admin
- Admin proposals:admin proposal 的 ops
- Admin apply:apply 命令的 ops
- Check split:split check 命令的 ops
- 99.99% Check split duration:99.99% 的情况下,split check 所需花费的时间
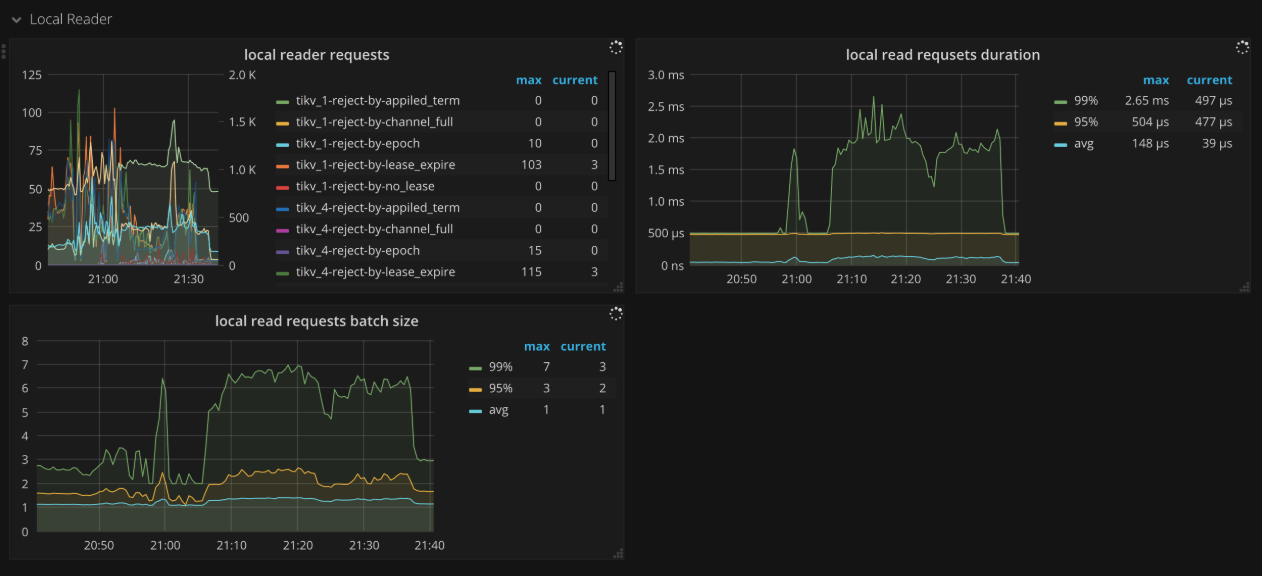
Local reader
- Local reader requests:所有请求的总数以及 local read 线程拒绝的请求数量
Unified Read Pool
- Time used by level:在 unified read pool 中每个级别使用的时间,级别 0 指小查询
- Level 0 chance:在 unified read pool 中调度的 level 0 任务的比例
- Running tasks:在 unified read pool 中并发运行的任务数量
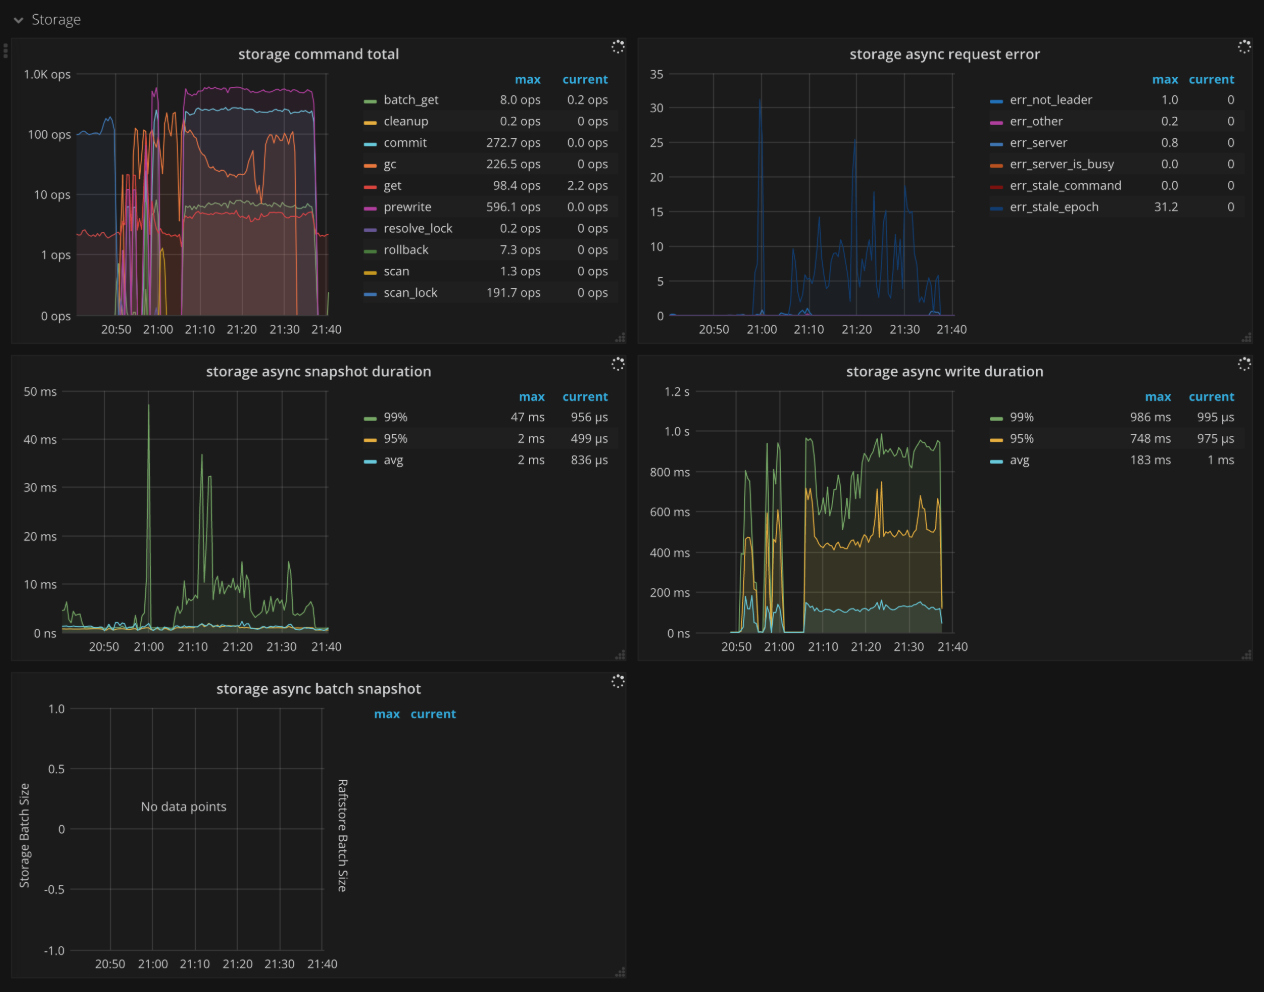
Storage
- Storage command total:收到不同命令的 ops
- Storage async request error:异步请求出错的 ops
- Storage async snapshot duration:异步处理 snapshot 所花费的时间,99% 的情况下,应该小于 1s
- Storage async write duration:异步写所花费的时间,99% 的情况下,应该小于 1s
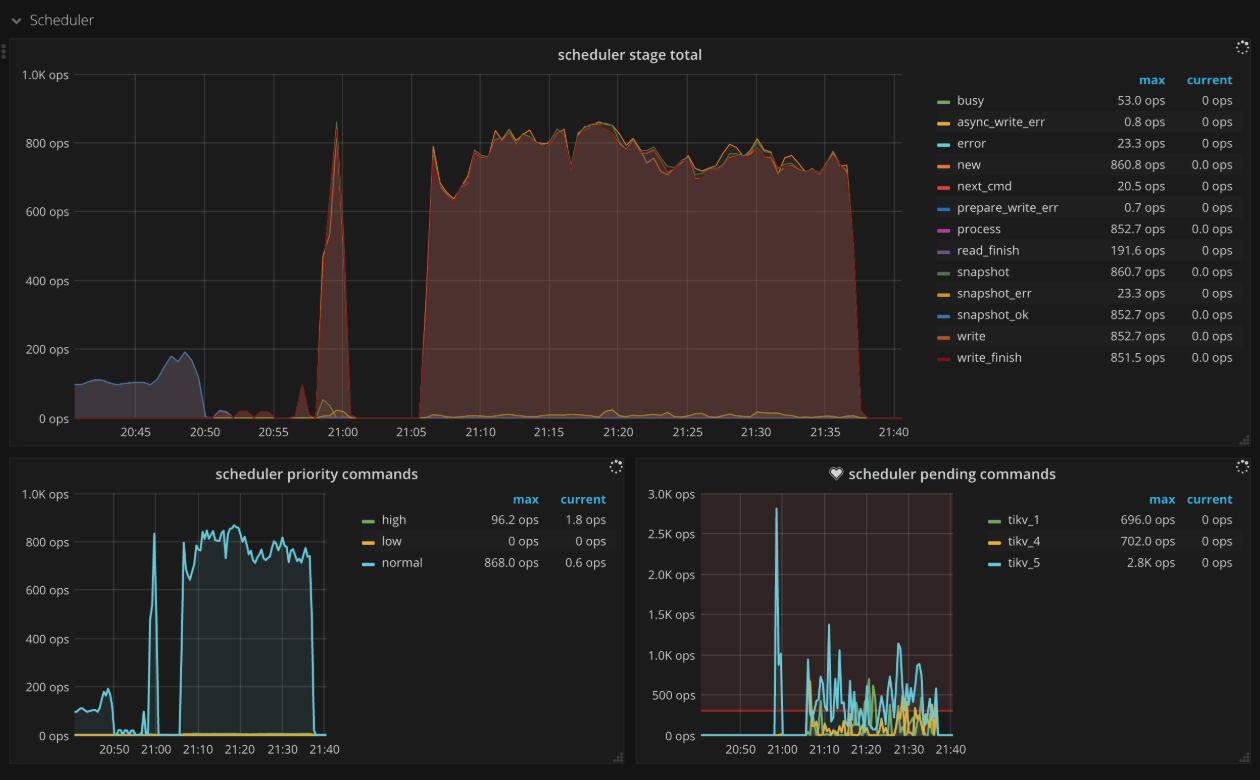
Scheduler
- Scheduler stage total:每种命令不同阶段的 ops,正常情况下,不会在短时间内出现大量的错误
- Scheduler writing bytes:每个 TiKV 实例正在处理的命令的写入字节数量
- Scheduler priority commands:不同优先级命令的 ops
- Scheduler pending commands:每个 TiKV 实例上 pending 命令的 ops
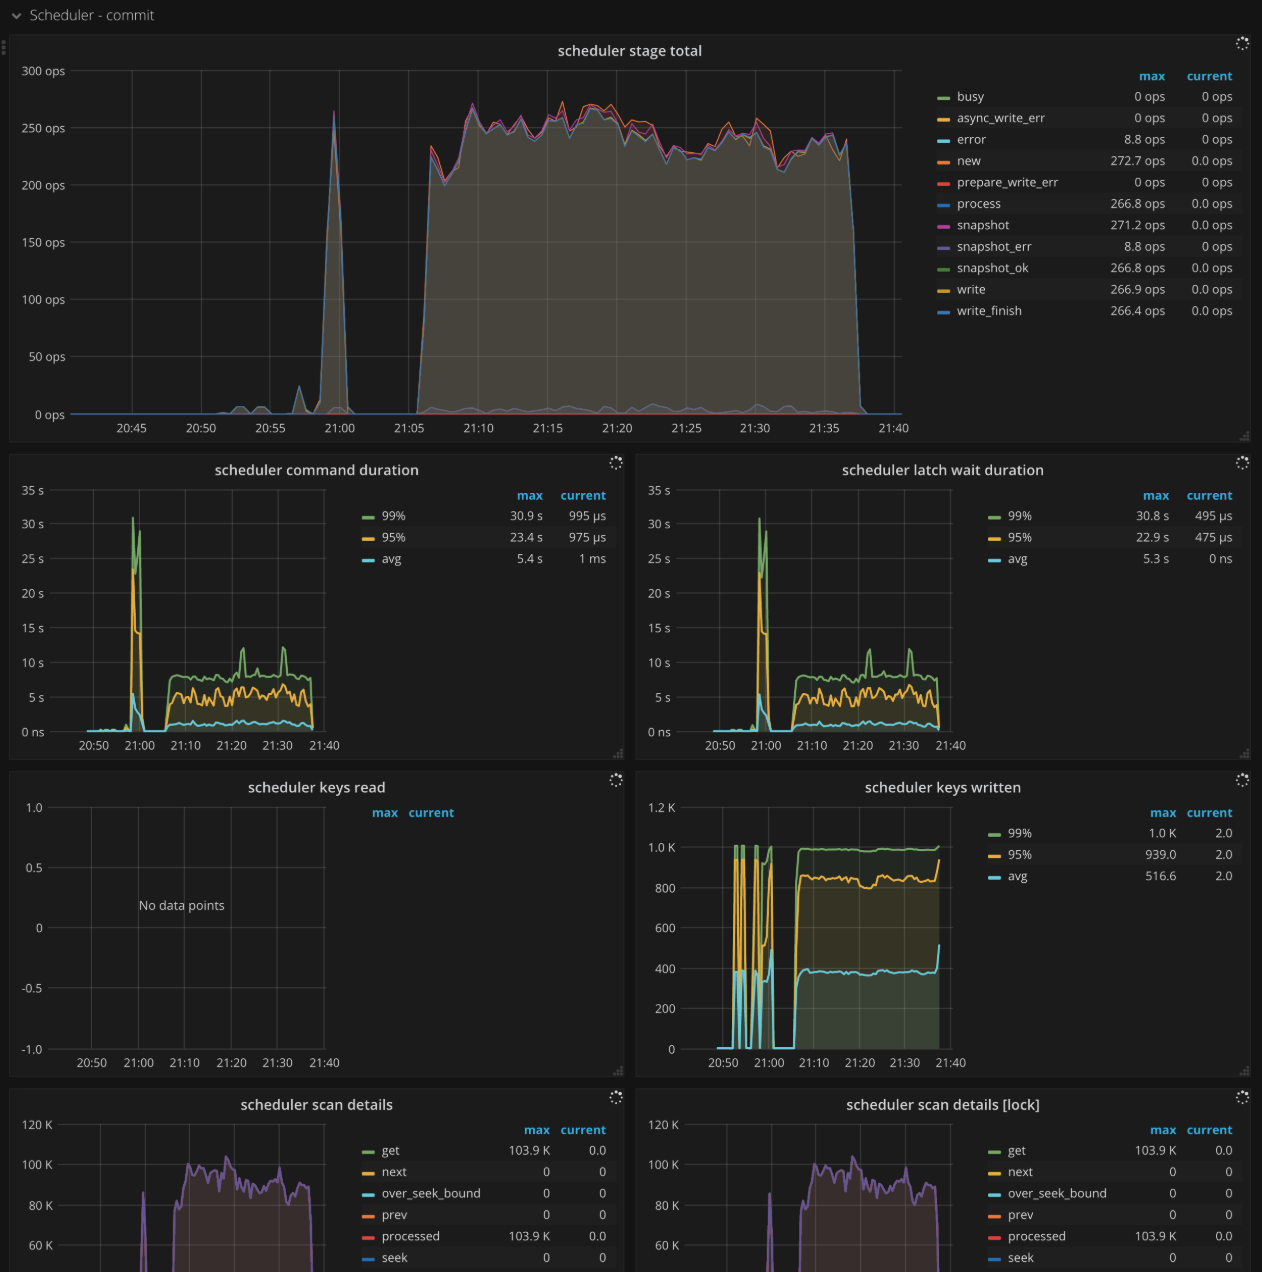
Scheduler - commit
- Scheduler stage total:commit 中每个命令所处不同阶段的 ops,正常情况下,不会在短时间内出现大量的错误
- Scheduler command duration:执行 commit 命令所需花费的时间,正常情况下,应该小于 1s
- Scheduler latch wait duration:由于 latch wait 造成的时间开销,正常情况下,应该小于 1s
- Scheduler keys read:commit 命令读取 key 的个数
- Scheduler keys written:commit 命令写入 key 的个数
- Scheduler scan details:执行 commit 命令时,扫描每个 CF 中 key 的详细情况
- Scheduler scan details [lock]:执行 commit 命令时,扫描每个 lock CF 中 key 的详细情况
- Scheduler scan details [write]:执行 commit 命令时,扫描每个 write CF 中 key 的详细情况
- Scheduler scan details [default]:执行 commit 命令时,扫描每个 default CF 中 key 的详细情况
Scheduler - pessimistic_rollback
- Scheduler stage total:pessimistic_rollback 中每个命令所处不同阶段的 ops,正常情况下,不会在短时间内出现大量的错误
- Scheduler command duration:执行 pessimistic_rollback 命令所需花费的时间,正常情况下,应该小于 1s
- Scheduler latch wait duration:由于 latch wait 造成的时间开销,正常情况下,应该小于 1s
- Scheduler keys read:pessimistic_rollback 命令读取 key 的个数
- Scheduler keys written:pessimistic_rollback 命令写入 key 的个数
- Scheduler scan details:执行 pessimistic_rollback 命令时,扫描每个 CF 中 key 的详细情况
- Scheduler scan details [lock]:执行 pessimistic_rollback 命令时,扫描每个 lock CF 中 key 的详细情况
- Scheduler scan details [write]:执行 pessimistic_rollback 命令时,扫描每个 write CF 中 key 的详细情况
- Scheduler scan details [default]:执行 pessimistic_rollback 命令时,扫描每个 default CF 中 key 的详细情况
Scheduler - prewrite
- Scheduler stage total:prewrite 中每个命令所处不同阶段的 ops,正常情况下,不会在短时间内出现大量的错误
- Scheduler command duration:执行 prewrite 命令所需花费的时间,正常情况下,应该小于 1s
- Scheduler latch wait duration:由于 latch wait 造成的时间开销,正常情况下,应该小于 1s
- Scheduler keys read:prewrite 命令读取 key 的个数
- Scheduler keys written:prewrite 命令写入 key 的个数
- Scheduler scan details:执行 prewrite 命令时,扫描每个 CF 中 key 的详细情况
- Scheduler scan details [lock]:执行 prewrite 命令时,扫描每个 lock CF 中 key 的详细情况
- Scheduler scan details [write]:执行 prewrite 命令时,扫描每个 write CF 中 key 的详细情况
- Scheduler scan details [default]:执行 prewrite 命令时,扫描每个 default CF 中 key 的详细情况
Scheduler - rollback
- Scheduler stage total:rollback 中每个命令所处不同阶段的 ops,正常情况下,不会在短时间内出现大量的错误
- Scheduler command duration:执行 rollback 命令所需花费的时间,正常情况下,应该小于 1s
- Scheduler latch wait duration:由于 latch wait 造成的时间开销,正常情况下,应该小于 1s
- Scheduler keys read:rollback 命令读取 key 的个数
- Scheduler keys written:rollback 命令写入 key 的个数
- Scheduler scan details:执行 rollback 命令时,扫描每个 CF 中 key 的详细情况
- Scheduler scan details [lock]:执行 rollback 命令时,扫描每个 lock CF 中 key 的详细情况
- Scheduler scan details [write]:执行 rollback 命令时,扫描每个 write CF 中 key 的详细情况
- Scheduler scan details [default]:执行 rollback 命令时,扫描每个 default CF 中 key 的详细情况
GC
- GC tasks:由 gc_worker 处理的 GC 任务的个数
- GC tasks Duration:执行 GC 任务时所花费的时间
- TiDB GC seconds:TiDB 执行 GC 花费的时间
- TiDB GC worker actions:TiDB GC worker 的不同 action 的个数
- TiKV AutoGC Working:Auto GC 管理器的工作状态
- ResolveLocks Progress:GC 第一阶段 (ResolveLocks) 的进度
- TiKV Auto GC Progress:GC 第二阶段的进度
- GC speed:GC 每秒删除的 key 的数量
- TiKV Auto GC SafePoint:TiKV GC 的 safe point 的数值,safe point 为当前 GC 的时间戳
- GC lifetime:TiDB 设置的 GC lifetime
- GC interval:TiDB 设置的 GC 间隔
- GC in Compaction Filter:write CF 的 Compaction Filter 中已过滤版本的数量
Snapshot
- Rate snapshot message:发送 Raft snapshot 消息的速率
- 99% Handle snapshot duration:99% 的情况下,处理 snapshot 所需花费的时间
- Snapshot state count:不同状态的 snapshot 的个数
- 99.99% Snapshot size:99.99% 的 snapshot 的大小
- 99.99% Snapshot KV count:99.99% 的 snapshot 包含的 key 的个数
Task
- Worker handled tasks:worker 每秒钟处理的任务的数量
- Worker pending tasks:当前 worker 中,每秒钟 pending 和 running 的任务的数量,正常情况下,应该小于 1000
- FuturePool handled tasks:future pool 每秒钟处理的任务的数量
- FuturePool pending tasks:当前 future pool 中,每秒钟 pending 和 running 的任务的数量
Coprocessor Overview
- Request duration:从收到 coprocessor 请求到处理结束所消耗的总时间
- Total Requests:每种类型的总请求的 ops
- Handle duration:每分钟实际处理 coprocessor 请求所消耗的时间的直方图
- Total Request Errors:Coprocessor 每秒请求错误的数量,正常情况下,短时间内不应该有大量的错误
- Total KV Cursor Operations:各种类型的 KV cursor 操作的总数量的 ops,例如 select、index、analyze_table、analyze_index、checksum_table、checksum_index 等
- KV Cursor Operations:每秒各种类型的 KV cursor 操作的数量,以直方图形式显示
- Total RocksDB Perf Statistics:RocksDB 性能统计数据
- Total Response Size:coprocessor 回应的数据大小
Coprocessor Detail
- Handle duration:每秒钟实际处理 coprocessor 请求所消耗的时间的直方图
- 95% Handle duration by store:每秒钟中 95% 的情况下,每个 TiKV 实例处理 coprocessor 请求所花费的时间
- Wait duration:coprocessor 每秒钟内请求的等待时间,99.99% 的情况下,应该小于 10s
- 95% Wait duration by store:每秒钟 95% 的情况下,每个 TiKV 实例上 coprocessor 请求的等待时间
- Total DAG Requests:DAG 请求的总数量的 ops
- Total DAG Executors:DAG executor 的总数量的 ops
- Total Ops Details (Table Scan):coprocessor 中请求为 select 的 scan 过程中每秒钟各种事件发生的次数
- Total Ops Details (Index Scan):coprocessor 中请求为 index 的 scan 过程中每秒钟各种事件发生的次数
- Total Ops Details by CF (Table Scan):coprocessor 中对于每个 CF 请求为 select 的 scan 过程中每秒钟各种事件发生的次数
- Total Ops Details by CF (Index Scan):coprocessor 中对于每个 CF 请求为 index 的 scan 过程中每秒钟各种事件发生的次数
Threads
- Threads state:TiKV 线程的状态
- Threads IO:TiKV 各个线程的 I/O 流量
- Thread Voluntary Context Switches:TiKV 线程自主切换的次数
- Thread Nonvoluntary Context Switches:TiKV 线程被动切换的次数
RocksDB - kv/raft
- Get operations:get 操作的 ops
- Get duration:get 操作的耗时
- Seek operations:seek 操作的 ops
- Seek duration:seek 操作的耗时
- Write operations:write 操作的 ops
- Write duration:write 操作的耗时
- WAL sync operations:sync WAL 操作的 ops
- Write WAL duration:write 操作中写 WAL 的耗时
- WAL sync duration:sync WAL 操作的耗时
- Compaction operations:compaction 和 flush 操作的 ops
- Compaction duration:compaction 和 flush 操作的耗时
- SST read duration:读取 SST 所需的时间
- Write stall duration:由于 write stall 造成的时间开销,正常情况下应为 0
- Memtable size:每个 CF 的 memtable 的大小
- Memtable hit:memtable 的命中率
- Block cache size:block cache 的大小。如果将
shared block cache禁用,即为每个 CF 的 block cache 的大小 - Block cache hit:block cache 的命中率
- Block cache flow:不同 block cache 操作的流量
- Block cache operations 不同 block cache 操作的个数
- Keys flow:不同操作造成的 key 的流量
- Total keys:每个 CF 中 key 的个数
- Read flow:不同读操作的流量
- Bytes/Read:每次读的大小
- Write flow:不同写操作的流量
- Bytes/Write:每次写的大小
- Compaction flow:compaction 相关的流量
- Compaction pending bytes:等待 compaction 的大小
- Read amplification:每个 TiKV 实例的读放大
- Compression ratio:每一层的压缩比
- Number of snapshots:每个 TiKV 的 snapshot 的数量
- Oldest snapshots duration:最旧的 snapshot 保留的时间
- Number files at each level:每一层的文件个数
- Ingest SST duration seconds:ingest SST 所花费的时间
- Stall conditions changed of each CF:每个 CF stall 的原因
Titan - All
- Blob file count:Titan blob 文件的数量
- Blob file size:Titan blob 文件总大小
- Live blob size:有效 blob record 的总大小
- Blob cache hit:Titan 的 blob cache 命中率
- Iter touched blob file count:单个 Iterator 所涉及到 blob 文件的数量
- Blob file discardable ratio distribution:blob 文件的失效 blob record 比例的分布情况
- Blob key size:Titan 中 blob key 的大小
- Blob value size:Titan 中 blob value 的大小
- Blob get operations:blob 的 get 操作的数量
- Blob get duration:blob 的 get 操作的耗时
- Blob iter operations:blob 的 iter 操作的耗时
- Blob seek duration:blob 的 seek 操作的耗时
- Blob next duration:blob 的 next 操作的耗时
- Blob prev duration:blob 的 prev 操作的耗时
- Blob keys flow:Titan blob 读写的 key 数量
- Blob bytes flow:Titan blob 读写的 bytes 数量
- Blob file read duration:blob 文件的读取耗时
- Blob file write duration:blob 文件的写入耗时
- Blob file sync operations:blob 文件 sync 次数
- Blob file sync duration:blob 文件 sync 耗时
- Blob GC action:Titan GC 细分动作的次数
- Blob GC duration:Titan GC 的耗时
- Blob GC keys flow:Titan GC 读写的 key 数量
- Blob GC bytes flow:Titan GC 读写的 bytes 数量
- Blob GC input file size:Titan GC 输入文件的大小
- Blob GC output file size:Titan GC 输出文件的大小
- Blob GC file count:Titan GC 涉及的 blob 文件数量
Lock manager
- Thread CPU:lock manager 的线程 CPU 使用率
- Handled tasks:lock manager 处理的任务数量
- Waiter lifetime duration:事务等待锁释放的时间
- Wait table:wait table 的状态信息,包括锁的数量和等锁事务的数量
- Deadlock detect duration:处理死锁检测请求的耗时
- Detect error:死锁检测遇到的错误数量,包含死锁的数量
- Deadlock detector leader:死锁检测器 leader 所在节点的信息
Memory
- Allocator Stats:内存分配器的统计信息
Backup
- Backup CPU:backup 的线程 CPU 使用率
- Range Size:backup range 的大小直方图
- Backup Duration:backup 的耗时
- Backup Flow:backup 总的字节大小
- Disk Throughput:实例磁盘的吞吐量
- Backup Range Duration:backup range 的耗时
- Backup Errors:backup 中发生的错误数量
Encryption
- Encryption data keys:正在使用的加密 data key 的总数量
- Encrypted files:被加密的文件数量
- Encryption initialized:显示加密是否被启用,
1代表已经启用 - Encryption meta files size:加密相关的元数据文件的大小
- Encrypt/decrypt data nanos:每次加密/解密数据的耗时的直方图
- Read/write encryption meta duration:每秒钟读写加密文件所耗费的时间
面板常见参数的解释
gRPC 消息类型
使用事务型接口的命令:
- kv_get:事务型的 get 命令,获取指定 ts 能读到的最新版本数据
- kv_scan:扫描连续的一段数据
- kv_prewrite:2PC 的第一阶段,预写入事务要提交的数据
- kv_pessimistic_lock:对 key 加悲观锁,防止其他事务修改
- kv_pessimistic_rollback:删除 key 上的悲观锁
- kv_txn_heart_beat:更新悲观事务或大事务的
lock_ttl以防止其被回滚 - kv_check_txn_status:检查事务的状态
- kv_commit:2PC 的第二阶段,提交 prewrite 阶段写入的数据
- kv_cleanup:回滚一个事务(此命令将会在 4.0 中废除)
- kv_batch_get:与
kv_get类似,一次性获取批量 key 的 value - kv_batch_rollback:批量回滚多个预写的事务
- kv_scan_lock:扫描所有版本号在
max_version之前的锁,用于清理过期的事务 - kv_resolve_lock:根据事务状态,提交或回滚事务的锁
- kv_gc:触发垃圾回收
- kv_delete_range:从 TiKV 中删除连续的一段数据
非事务型的裸命令:
- raw_get:获取 key 所对应的 value
- raw_batch_get:获取一批 key 所对应的 value
- raw_scan:扫描一段连续的数据
- raw_batch_scan:扫描多段连续的数据
- raw_put:写入一个 key/value 对
- raw_batch_put:直接写入一批 key/value 对
- raw_delete:删除一个 key/value 对
- raw_batch_delete:删除一批 key/value 对
- raw_delete_range:删除连续的一段区间