Configure TiDB for Optimal Performance
This guide describes how to optimize the performance of TiDB, including:
- Best practices for common workloads.
- Strategies for handling challenging performance scenarios.
Overview
Optimizing TiDB for peak performance requires careful tuning of various settings. In many cases, achieving optimal performance involves adjusting configurations beyond their default values.
The default settings prioritize stability over performance. To maximize performance, you might need to use more aggressive configurations and, in some cases, experimental features. These recommendations are based on production deployment experience and performance optimization research.
This guide describes the non-default settings, including their benefits and potential trade-offs. Use this information to optimize TiDB settings for your workload requirements.
Key settings for common workloads
The following settings are commonly used to optimize TiDB performance:
- Enhance execution plan cache, such as SQL Prepared Execution Plan Cache and Non-prepared plan cache.
- Optimize the behavior of the TiDB optimizer by using Optimizer Fix Controls.
- Use the Titan storage engine more aggressively.
- Fine-tune TiKV's compaction and flow control configurations, to ensure optimal and stable performance under write-intensive workloads.
These settings can significantly improve performance for many workloads. However, as with any optimization, thoroughly test them in your environment before deploying to production.
System variables
Execute the following SQL commands to apply the recommended settings:
SET GLOBAL tidb_session_plan_cache_size=200;
SET GLOBAL tidb_enable_non_prepared_plan_cache=on;
SET GLOBAL tidb_ignore_prepared_cache_close_stmt=on;
SET GLOBAL tidb_stats_load_sync_wait=2000;
SET GLOBAL tidb_enable_inl_join_inner_multi_pattern=on;
SET GLOBAL tidb_opt_limit_push_down_threshold=10000;
SET GLOBAL tidb_opt_derive_topn=on;
SET GLOBAL tidb_runtime_filter_mode=LOCAL;
SET GLOBAL tidb_opt_enable_mpp_shared_cte_execution=on;
SET GLOBAL tidb_rc_read_check_ts=on;
SET GLOBAL tidb_guarantee_linearizability=off;
SET GLOBAL pd_enable_follower_handle_region=on;
SET GLOBAL tidb_opt_fix_control = '44262:ON,44389:ON,44823:10000,44830:ON,44855:ON,52869:ON';
The following table outlines the impact of specific system variable configurations:
The following describes the optimizer control configurations that enable additional optimizations:
44262:ON: Use Dynamic pruning mode to access the partitioned table when the GlobalStats are missing.44389:ON: For filters such asc = 10 and (a = 'xx' or (a = 'kk' and b = 1)), build more comprehensive scan ranges forIndexRangeScan.44823:10000: To save memory, plan cache does not cache queries with parameters exceeding the specified number of this variable. Increase plan cache parameter limit from200to10000to make plan cache available for query with long in-lists.44830:ON: Plan cache is allowed to cache execution plans with thePointGetoperator generated during physical optimization.44855:ON: The optimizer selectsIndexJoinwhen theProbeside of anIndexJoinoperator contains aSelectionoperator.52869:ON: The optimizer chooses index merge automatically if the optimizer can choose the single index scan method (other than full table scan) for a query plan.
TiKV configurations
Add the following configuration items to the TiKV configuration file:
[server]
concurrent-send-snap-limit = 64
concurrent-recv-snap-limit = 64
snap-io-max-bytes-per-sec = "400MiB"

[rocksdb]
max-manifest-file-size = "256MiB"
[rocksdb.titan]
enabled = true
[rocksdb.defaultcf.titan]
min-blob-size = "1KB"
blob-file-compression = "zstd"

[storage]
scheduler-pending-write-threshold = "512MiB"
[storage.flow-control]
l0-files-threshold = 50
soft-pending-compaction-bytes-limit = "512GiB"

[rocksdb.writecf]
level0-slowdown-writes-trigger = 20
soft-pending-compaction-bytes-limit = "192GiB"
[rocksdb.defaultcf]
level0-slowdown-writes-trigger = 20
soft-pending-compaction-bytes-limit = "192GiB"
[rocksdb.lockcf]
level0-slowdown-writes-trigger = 20
soft-pending-compaction-bytes-limit = "192GiB"
Note that the compaction and flow control configuration adjustments outlined in the preceding table are tailored for TiKV deployments on instances with the following specifications:
- CPU: 32 cores
- Memory: 128 GiB
- Storage: 5 TiB EBS
- Disk Throughput: 1 GiB/s
Recommended configuration adjustments for write-intensive workloads
To optimize TiKV performance and stability under write-intensive workloads, it is recommended that you adjust certain compaction and flow control parameters based on the hardware specifications of the instance. For example:
rocksdb.rate-bytes-per-sec: usually use the default value. If you notice that compaction I/O is consuming a significant share of the disk bandwidth, consider capping the rate to about 60% of your disk’s maximum throughput. This helps balance compaction work and ensures the disk is not saturated. For example, on a disk rated at 1 GiB/s, set this to roughly600MiB.storage.flow-control.soft-pending-compaction-bytes-limitandstorage.flow-control.hard-pending-compaction-bytes-limit: increase these limits proportionally to the available disk space (for example, 1 TiB and 2 TiB, respectively) to provide more buffer for compaction processes.
These settings help ensure efficient resource utilization and minimize potential bottlenecks during peak write loads.
TiFlash-learner configurations
Add the following configuration items to the TiFlash-learner configuration file:
[server]
snap-io-max-bytes-per-sec = "300MiB"
Benchmark
This section compares performance between default settings (baseline) and optimized settings based on the preceding key settings for common loads.
YCSB workloads on large record value
Test environment
The test environment is as follows:
- 3 TiDB servers (16 cores, 64 GiB)
- 3 TiKV servers (16 cores, 64 GiB)
- TiDB version: v8.1.0
- Workload: go-ycsb workloada
Performance comparison
The following table compares throughput (operations per second) between the baseline and optimized settings.
Performance analysis
Titan is enabled by default starting from v7.6.0 and the default min-blob-size of Titan in TiDB v8.1.0 is 32KiB. The baseline configuration uses a record size of 31KiB to ensure data is stored in RocksDB. In contrast, for the key settings configuration, set min-blob-size to 1KiB, causing data to be stored in Titan.
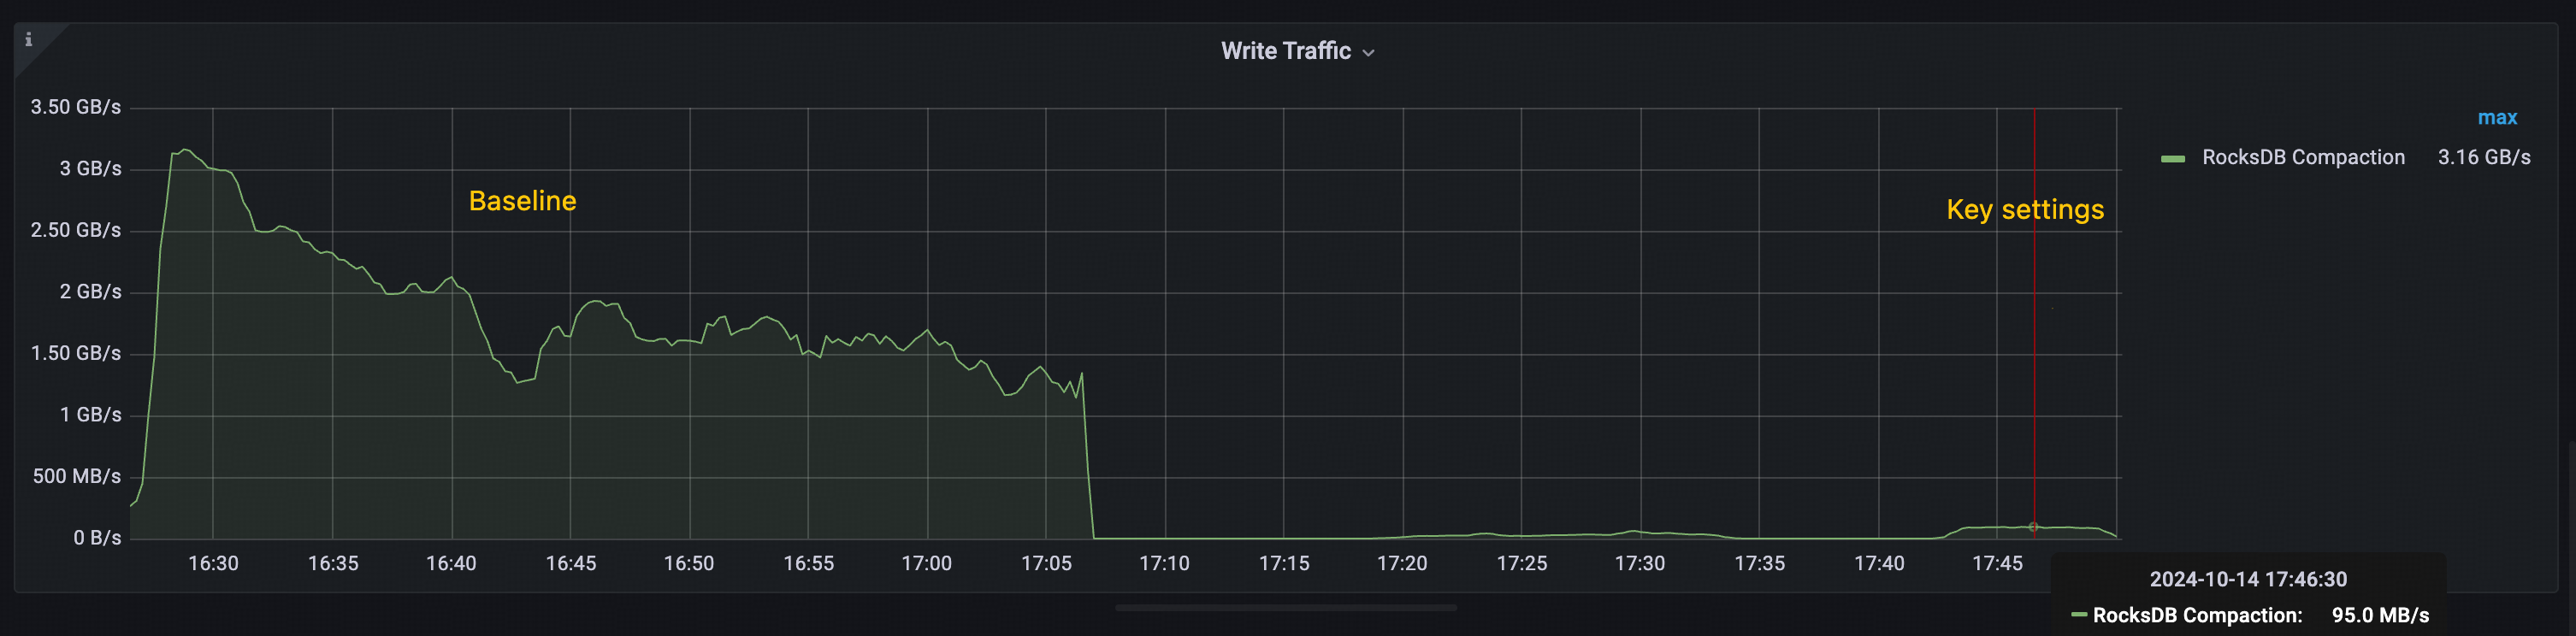
The performance improvement observed in the key settings is primarily attributed to Titan's ability to reduce RocksDB compactions. As shown in the following figures:
- Baseline: The total throughput of RocksDB compaction exceeds 1 GiB/s, with peaks over 3 GiB/s.
- Key settings: The peak throughput of RocksDB compaction remains below 100 MiB/s.
This significant reduction in compaction overhead contributes to the overall throughput improvement seen in the key settings configuration.
Test workload
The following go-ycsb load command loads data:
go-ycsb load mysql -P /ycsb/workloads/workloada -p {host} -p mysql.port={port} -p threadcount=100 -p recordcount=5000000 -p operationcount=5000000 -p workload=core -p requestdistribution=uniform -pfieldcount=31 -p fieldlength=1024
The following go-ycsb run command runs workload:
go-ycsb run mysql -P /ycsb/workloads/workloada -p {host} -p mysql.port={port} -p mysql.db=test -p threadcount=100 -p recordcount=5000000 -p operationcount=5000000 -p workload=core -prequestdistribution=uniform -p fieldcount=31 -p fieldlength=1024
Edge cases and optimizations
This section shows you how to optimize TiDB for specific scenarios that need targeted adjustments beyond basic optimizations. You will learn how to tune TiDB for your particular use cases.
Identify edge cases
To identify edge cases, perform the following steps:
- Analyze query patterns and workload characteristics.
- Monitor system metrics to identify performance bottlenecks.
- Gather feedback from application teams about specific issues.
Common edge cases
The following lists some common edge cases:
- High TSO wait for high-frequency small queries
- Choose the proper max chunk size for different workloads
- Tune coprocessor cache for read-heavy workloads
- Optimize chunk size for workload characteristics
- Optimize transaction mode and DML type for different workloads
- Optimize
GROUP BYandDISTINCToperations with TiKV pushdown - Optimize statistics collection during batch operations
- Optimize thread pool settings for different instance types
The following sections explain how to handle each of these cases. You need to adjust different parameters or use specific TiDB features for each scenario.
High TSO wait for high-frequency small queries
Troubleshooting
If your workload involves frequent small transactions or queries that frequently request timestamps, TSO (Timestamp Oracle) can become a performance bottleneck. To check if TSO wait time is impacting your system, check the Performance Overview > SQL Execute Time Overview panel. If TSO wait time constitutes a large portion of your SQL execution time, consider the following optimizations:
- Use low-precision TSO (enable
tidb_low_resolution_tso) for read operations that do not need strict consistency. For more information, see Solution 1: use low-precision TSO. - Enable
tidb_enable_batch_dmlto reduce TSO requests for batch operations.
Solution 1: low-precision TSO
You can reduce TSO wait time by enabling the low-precision TSO feature (tidb_low_resolution_tso). After this feature is enabled, TiDB uses the cached timestamp to read data, reducing TSO wait time at the expense of potentially stale reads.
This optimization is particularly effective in the following scenarios:
- Read-heavy workloads where slight staleness is acceptable.
- Scenarios where reducing query latency is more important than absolute consistency.
- Applications that can tolerate reads that are a few seconds behind the latest committed state.
Benefits and trade-offs:
- Reduce query latency by enabling stale reads with a cached TSO, eliminating the need to request new timestamps.
- Balance performance against data consistency: this feature is only suitable for scenarios where stale reads are acceptable. It is not recommended to use it when strict data consistency is required.
To enable this optimization:
SET GLOBAL tidb_low_resolution_tso=ON;
Tune coprocessor cache for read-heavy workloads
You can improve query performance for read-heavy workloads by optimizing the coprocessor cache. This cache stores the results of coprocessor requests, reducing repeated computations of frequently accessed data. To optimize cache performance, perform the following steps:
- Monitor the cache hit ratio using the metrics described in Coprocessor Cache.
- Increase the cache size to improve hit rates for larger working sets.
- Adjust the admission threshold based on query patterns.
The following lists some recommended settings for a read-heavy workload:
[tikv-client.copr-cache]
capacity-mb = 4096
admission-max-ranges = 5000
admission-max-result-mb = 10
admission-min-process-ms = 0
Optimize chunk size for workload characteristics
The tidb_max_chunk_size system variable sets the maximum number of rows in a chunk during the execution process. Adjusting this value based on your workload can improve performance.
For OLTP workloads with large concurrency and small transactions:
Set the value between
128and256rows (the default value is1024).This reduces memory usage and makes limit queries faster.
Use case: point queries, small range scans.
SET GLOBAL tidb_max_chunk_size = 128;
For OLAP or analytical workloads with complex queries and large result sets:
Set the value between
1024and4096rows.This increases throughput when scanning large amounts of data.
Use case: aggregations, large table scans.
SET GLOBAL tidb_max_chunk_size = 4096;
Optimize transaction mode and DML type for different workloads
TiDB provides different transaction modes and DML execution types to optimize performance for various workload patterns.
Transaction modes
You can set the transaction mode using the tidb_txn_mode system variable.
Pessimistic transaction mode (default):
- Suitable for general workloads with potential write conflicts.
- Provides stronger consistency guarantees.
SET SESSION tidb_txn_mode = "pessimistic";- Suitable for workloads with minimal write conflicts.
- Better performance for multi-statement transactions.
- Example:
BEGIN; INSERT...; INSERT...; COMMIT;.
SET SESSION tidb_txn_mode = "optimistic";
DML types
You can control the execution mode of DML statements using the tidb_dml_type system variable, which is introduced in v8.0.0.
To use the bulk DML execution mode, set tidb_dml_type to "bulk". This mode optimizes bulk data loading without conflicts and reduces memory usage during large write operations. Before using this mode, ensure that:
autocommitis enabled.- The
pessimistic-auto-commitconfiguration item is set tofalse.
SET SESSION tidb_dml_type = "bulk";
Optimize GROUP BY and DISTINCT operations with TiKV pushdown
TiDB pushes down aggregation operations to TiKV to reduce data transfer and processing overhead. The performance improvement varies based on your data characteristics.
Usage scenarios
Ideal scenarios (high performance gain):
- Columns containing few distinct values (low NDV).
- Data containing frequent duplicate values.
- Example: status columns, category codes, date parts.
Non-ideal scenarios (potential performance loss):
- Columns containing mostly unique values (high NDV).
- Unique identifiers or timestamps.
- Example: User IDs, transaction IDs.
Configuration
Enable pushdown optimizations at the session or global level:
-- Enable regular aggregation pushdown
SET GLOBAL tidb_opt_agg_push_down = ON;

-- Enable distinct aggregation pushdown
SET GLOBAL tidb_opt_distinct_agg_push_down = ON;
Optimize statistics collection during batch operations
You can optimize performance during batch operations while maintaining query optimization by managing statistics collection. This section describes how to manage this process effectively.
When to disable auto analyze
You can disable auto analyze by setting the tidb_enable_auto_analyze system variable to OFF in the following scenarios:
- During large data imports.
- During bulk update operations.
- For time-sensitive batch processing.
- When you need full control over the timing of statistics collection.
Best practices
Before the batch operation:
-- Disable auto analyze
SET GLOBAL tidb_enable_auto_analyze = OFF;
After the batch operation:
-- Manually collect statistics
ANALYZE TABLE your_table;

-- Re-enable auto analyze
SET GLOBAL tidb_enable_auto_analyze = ON;
Optimize thread pool settings for different instance types
To improve TiKV performance, configure the thread pools based on your instance's CPU resources. The following guidelines help you optimize these settings:
For instances with 8 to 16 cores, the default settings are typically sufficient.
For instances with 32 or more cores, increase the pool sizes for better resource utilization. Adjust the settings as follows:
[server]
# Increase gRPC thread pool
grpc-concurrency = 10

[raftstore]
# Optimize for write-intensive workloads
apply-pool-size = 4
store-pool-size = 4
store-io-pool-size = 2