Introduction to Statistics
TiDB uses statistics to decide which index to choose. The tidb_analyze_version variable controls the statistics collected by TiDB. Currently, two versions of statistics are supported: tidb_analyze_version = 1 and tidb_analyze_version = 2. In versions before v5.1.0, the default value of this variable is 1. In v5.3.0 and later versions, the default value of this variable is 2. If your cluster is upgraded from a version earlier than v5.3.0 to v5.3.0 or later, the default value of tidb_analyze_version does not change.
These two versions include different information in TiDB:
Compared to Version 1, Version 2 statistics avoids the potential inaccuracy caused by hash collision when the data volume is huge. It also maintains the estimate precision in most scenarios.
This document briefly introduces the histogram, Count-Min Sketch, and Top-N, and details the collection and maintenance of statistics.
Histogram
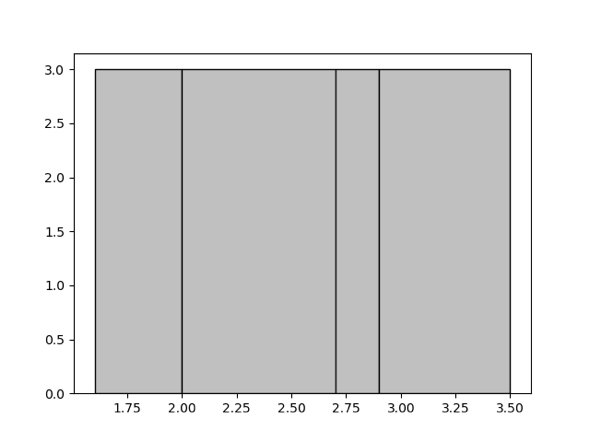
A histogram is an approximate representation of the distribution of data. It divides the entire range of values into a series of buckets, and uses simple data to describe each bucket, such as the number of values falling in the bucket. In TiDB, an equal-depth histogram is created for the specific columns of each table. The equal-depth histogram can be used to estimate the interval query.
Here "equal-depth" means that the number of values falling into each bucket is as equal as possible. For example, for a given set {1.6, 1.9, 1.9, 2.0, 2.4, 2.6, 2.7, 2.7, 2.8, 2.9, 3.4, 3.5}, you want to generate 4 buckets. The equal-depth histogram is as follows. It contains four buckets [1.6, 1.9], [2.0, 2.6], [2.7, 2.8], [2.9, 3.5]. The bucket depth is 3.
For details about the parameter that determines the upper limit to the number of histogram buckets, refer to Manual Collection. When the number of buckets is larger, the accuracy of the histogram is higher; however, higher accuracy is at the cost of the usage of memory resources. You can adjust this number appropriately according to the actual scenario.
Count-Min Sketch
Count-Min Sketch is a hash structure. When an equivalence query contains a = 1 or IN query (for example, a in (1, 2, 3)), TiDB uses this data structure for estimation.
A hash collision might occur since Count-Min Sketch is a hash structure. In the EXPLAIN statement, if the estimate of the equivalent query deviates greatly from the actual value, it can be considered that a larger value and a smaller value have been hashed together. In this case, you can take one of the following ways to avoid the hash collision:
- Modify the
WITH NUM TOPNparameter. TiDB stores the high-frequency (top x) data separately, with the other data stored in Count-Min Sketch. Therefore, to prevent a larger value and a smaller value from being hashed together, you can increase the value ofWITH NUM TOPN. In TiDB, its default value is 20. The maximum value is 1024. For more information about this parameter, see Full Collection. - Modify two parameters
WITH NUM CMSKETCH DEPTHandWITH NUM CMSKETCH WIDTH. Both affect the number of hash buckets and the collision probability. You can increase the values of the two parameters appropriately according to the actual scenario to reduce the probability of hash collision, but at the cost of higher memory usage of statistics. In TiDB, the default value ofWITH NUM CMSKETCH DEPTHis 5, and the default value ofWITH NUM CMSKETCH WIDTHis 2048. For more information about the two parameters, see Full Collection.
Top-N values
Top-N values are values with the top N occurrences in a column or index. TiDB records the values and occurrences of Top-N values.
Collect statistics
Manual collection
You can run the ANALYZE statement to collect statistics.
Full collection
You can perform full collection using the following syntax.
To collect statistics of all the tables in
TableNameList:ANALYZE TABLE TableNameList [WITH NUM BUCKETS|TOPN|CMSKETCH DEPTH|CMSKETCH WIDTH]|[WITH NUM SAMPLES|WITH FLOATNUM SAMPLERATE];WITH NUM BUCKETSspecifies the maximum number of buckets in the generated histogram.WITH NUM TOPNspecifies the maximum number of the generatedTOPNs.WITH NUM CMSKETCH DEPTHspecifies the depth of the CM Sketch.WITH NUM CMSKETCH WIDTHspecifies the width of the CM Sketch.WITH NUM SAMPLESspecifies the number of samples.WITH FLOAT_NUM SAMPLERATEspecifies the sampling rate.
WITH NUM SAMPLES and WITH FLOAT_NUM SAMPLERATE correspond to two different algorithms of collecting samples.
WITH NUM SAMPLESspecifies the size of the sampling set, which is implemented in the reservoir sampling method in TiDB. When a table is large, it is not recommended to use this method to collect statistics. Because the intermediate result set of the reservoir sampling contains redundant results, it causes additional pressure on resources such as memory.WITH FLOAT_NUM SAMPLERATEis a sampling method introduced in v5.3.0. With the value range(0, 1], this parameter specifies the sampling rate. It is implemented in the way of Bernoulli sampling in TiDB, which is more suitable for sampling larger tables and performs better in collection efficiency and resource usage.
Before v5.3.0, TiDB uses the reservoir sampling method to collect statistics. Since v5.3.0, the TiDB Version 2 statistics uses the Bernoulli sampling method to collect statistics by default. To re-use the reservoir sampling method, you can use the WITH NUM SAMPLES statement.
Collect statistics on some columns
In most cases, when executing SQL statements, the optimizer only uses statistics on some columns (such as columns in the WHERE, JOIN, ORDER BY, and GROUP BY statements). These columns are called PREDICATE COLUMNS.
If a table has many columns, collecting statistics on all the columns can cause a large overhead. To reduce the overhead, you can collect statistics on only specific columns or PREDICATE COLUMNS to be used by the optimizer.
To collect statistics on specific columns, use the following syntax:
ANALYZE TABLE TableName COLUMNS ColumnNameList [WITH NUM BUCKETS|TOPN|CMSKETCH DEPTH|CMSKETCH WIDTH]|[WITH NUM SAMPLES|WITH FLOATNUM SAMPLERATE];In the syntax,
ColumnNameListspecifies the name list of the target columns. If you need to specify more than one column, use comma,to separate the column names. For example,ANALYZE table t columns a, b. Besides collecting statistics on the specific columns in a specific table, this syntax collects statistics on the indexed columns and all indexes in that table at the same time.To collect statistics on
PREDICATE COLUMNS, do the following:Set the value of the
tidb_enable_column_trackingsystem variable toONto enable TiDB to collectPREDICATE COLUMNS.After the setting, TiDB writes the
PREDICATE COLUMNSinformation to themysql.column_stats_usagesystem table every 100 *stats-lease.After the query pattern of your business is relatively stable, collect statistics on
PREDICATE COLUMNSby using the following syntax:ANALYZE TABLE TableName PREDICATE COLUMNS [WITH NUM BUCKETS|TOPN|CMSKETCH DEPTH|CMSKETCH WIDTH]|[WITH NUM SAMPLES|WITH FLOATNUM SAMPLERATE];Besides collecting statistics on
PREDICATE COLUMNSin a specific table, this syntax collects statistics on indexed columns and all indexes in that table at the same time.
To collect statistics on all columns and indexes, use the following syntax:
ANALYZE TABLE TableName ALL COLUMNS [WITH NUM BUCKETS|TOPN|CMSKETCH DEPTH|CMSKETCH WIDTH]|[WITH NUM SAMPLES|WITH FLOATNUM SAMPLERATE];
If you want to persist the column configuration in the ANALYZE statement (including COLUMNS ColumnNameList, PREDICATE COLUMNS, and ALL COLUMNS), set the value of the tidb_persist_analyze_options system variable to ON to enable the ANALYZE configuration persistence feature. After enabling the ANALYZE configuration persistence feature:
- When TiDB collects statistics automatically or when you manually collect statistics by executing the
ANALYZEstatement without specifying the column configuration, TiDB continues using the previously persisted configuration for statistics collection. - When you manually execute the
ANALYZEstatement multiple times with column configuration specified, TiDB overwrites the previously recorded persistent configuration using the new configuration specified by the latestANALYZEstatement.
To locate PREDICATE COLUMNS and columns on which statistics have been collected, use the following syntax:
SHOW COLUMN_STATS_USAGE [ShowLikeOrWhere];
The SHOW COLUMN_STATS_USAGE statement returns the following 6 columns:
In the following example, after executing ANALYZE TABLE t PREDICATE COLUMNS;, TiDB collects statistics on columns b, c, and d, where column b is a PREDICATE COLUMN and columns c and d are index columns.
SET GLOBAL tidb_enable_column_tracking = ON;
Query OK, 0 rows affected (0.00 sec)

CREATE TABLE t (a INT, b INT, c INT, d INT, INDEX idx_c_d(c, d));
Query OK, 0 rows affected (0.00 sec)

-- The optimizer uses the statistics on column b in this query.
SELECT * FROM t WHERE b > 1;
Empty set (0.00 sec)

-- After waiting for a period of time (100 * stats-lease), TiDB writes the collected `PREDICATE COLUMNS` to mysql.column_stats_usage.
-- Specify `last_used_at IS NOT NULL` to show the `PREDICATE COLUMNS` collected by TiDB.
SHOW COLUMN_STATS_USAGE WHERE db_name = 'test' AND table_name = 't' AND last_used_at IS NOT NULL;
+---------+------------+----------------+-------------+---------------------+------------------+
| Db_name | Table_name | Partition_name | Column_name | Last_used_at        | Last_analyzed_at |
+---------+------------+----------------+-------------+---------------------+------------------+
| test    | t          |                | b           | 2022-01-05 17:21:33 | NULL             |
+---------+------------+----------------+-------------+---------------------+------------------+
1 row in set (0.00 sec)

ANALYZE TABLE t PREDICATE COLUMNS;
Query OK, 0 rows affected, 1 warning (0.03 sec)

-- Specify `last_analyzed_at IS NOT NULL` to show the columns for which statistics have been collected.
SHOW COLUMN_STATS_USAGE WHERE db_name = 'test' AND table_name = 't' AND last_analyzed_at IS NOT NULL;
+---------+------------+----------------+-------------+---------------------+---------------------+
| Db_name | Table_name | Partition_name | Column_name | Last_used_at        | Last_analyzed_at    |
+---------+------------+----------------+-------------+---------------------+---------------------+
| test    | t          |                | b           | 2022-01-05 17:21:33 | 2022-01-05 17:23:06 |
| test    | t          |                | c           | NULL                | 2022-01-05 17:23:06 |
| test    | t          |                | d           | NULL                | 2022-01-05 17:23:06 |
+---------+------------+----------------+-------------+---------------------+---------------------+
3 rows in set (0.00 sec)
Collect statistics on indexes
To collect statistics on all indexes in IndexNameList in TableName, use the following syntax:
ANALYZE TABLE TableName INDEX [IndexNameList] [WITH NUM BUCKETS|TOPN|CMSKETCH DEPTH|CMSKETCH WIDTH]|[WITH NUM SAMPLES|WITH FLOATNUM SAMPLERATE];
When IndexNameList is empty, this syntax collects statistics on all indexes in TableName.
Collect statistics on partitions
To collect statistics on all partitions in
PartitionNameListinTableName, use the following syntax:ANALYZE TABLE TableName PARTITION PartitionNameList [WITH NUM BUCKETS|TOPN|CMSKETCH DEPTH|CMSKETCH WIDTH]|[WITH NUM SAMPLES|WITH FLOATNUM SAMPLERATE];To collect index statistics on all partitions in
PartitionNameListinTableName, use the following syntax:ANALYZE TABLE TableName PARTITION PartitionNameList INDEX [IndexNameList] [WITH NUM BUCKETS|TOPN|CMSKETCH DEPTH|CMSKETCH WIDTH]|[WITH NUM SAMPLES|WITH FLOATNUM SAMPLERATE];If you only need to collect statistics on some columns of some partitions in a table, use the following syntax:
ANALYZE TABLE TableName PARTITION PartitionNameList [COLUMNS ColumnNameList|PREDICATE COLUMNS|ALL COLUMNS] [WITH NUM BUCKETS|TOPN|CMSKETCH DEPTH|CMSKETCH WIDTH]|[WITH NUM SAMPLES|WITH FLOATNUM SAMPLERATE];
Incremental collection
To improve the speed of analysis after full collection, incremental collection could be used to analyze the newly added sections in monotonically non-decreasing columns such as time columns.
You can perform incremental collection using the following syntax.
To incrementally collect statistics on index columns in all
IndexNameListsinTableName:ANALYZE INCREMENTAL TABLE TableName INDEX [IndexNameList] [WITH NUM BUCKETS|TOPN|CMSKETCH DEPTH|CMSKETCH WIDTH]|[WITH NUM SAMPLES|WITH FLOATNUM SAMPLERATE];To incrementally collect statistics on index columns for partitions in all
PartitionNameListsinTableName:ANALYZE INCREMENTAL TABLE TableName PARTITION PartitionNameList INDEX [IndexNameList] [WITH NUM BUCKETS|TOPN|CMSKETCH DEPTH|CMSKETCH WIDTH]|[WITH NUM SAMPLES|WITH FLOATNUM SAMPLERATE];
Automatic update
For the INSERT, DELETE, or UPDATE statements, TiDB automatically updates the number of rows and updated rows. TiDB persists this information regularly and the update cycle is 20 * stats-lease. The default value of stats-lease is 3s. If you specify the value as 0, it does not update automatically.
Three system variables related to automatic update of statistics are as follows:
When the ratio of the number of modified rows to the total number of rows of tbl in a table is greater than tidb_auto_analyze_ratio, and the current time is between tidb_auto_analyze_start_time and tidb_auto_analyze_end_time, TiDB executes the ANALYZE TABLE tbl statement in the background to automatically update the statistics on this table.
To avoid the situation that modifying a small amount of data on a small table frequently triggers the automatic update, when a table has less than 1000 rows, such data modifying does not trigger the automatic update in TiDB. You can use the SHOW STATS_META statement to view the number of rows in a table.
Before TiDB v5.0, when you execute a query, TiDB collects feedback with feedback-probability and updates the histogram and Count-Min Sketch based on the feedback. Since v5.0, this feature is disabled by default. Since v5.4, this feature has been deprecated, and it is not recommended to enable this feature.
Control ANALYZE concurrency
When you run the ANALYZE statement, you can adjust the concurrency using the following parameters, to control its effect on the system.
tidb_build_stats_concurrency
Currently, when you run the ANALYZE statement, the task is divided into multiple small tasks. Each task only works on one column or index. You can use the tidb_build_stats_concurrency parameter to control the number of simultaneous tasks. The default value is 4.
tidb_distsql_scan_concurrency
When you analyze regular columns, you can use the tidb_distsql_scan_concurrency parameter to control the number of Region to be read at one time. The default value is 15.
tidb_index_serial_scan_concurrency
When you analyze index columns, you can use the tidb_index_serial_scan_concurrency parameter to control the number of Region to be read at one time. The default value is 1.
Persist ANALYZE configurations
Since v5.4.0, TiDB supports persisting some ANALYZE configurations. With this feature, the existing configurations can be easily reused for future statistics collection.
The following are the ANALYZE configurations that support persistence:
Enable ANALYZE configuration persistence
The ANALYZE configuration persistence feature is enabled by default (the system variable tidb_analyze_version is 2 and tidb_persist_analyze_options is ON by default). You can use this feature to record the persistence configurations specified in the ANALYZE statement when executing the statement manually. Once recorded, the next time TiDB automatically updates statistics or you manually collect statistics without specifying these configuration, TiDB will collect statistics according to the recorded configurations.
To query the configuration persisted on a specific table used for auto analyze operations, you can use the following SQL statement:
SELECT sample_num, sample_rate, buckets, topn, column_choice, column_ids FROM mysql.analyze_options opt JOIN information_schema.tables tbl ON opt.table_id = tbl.tidb_table_id WHERE tbl.table_schema = '{db_name}' AND tbl.table_name = '{table_name}';
TiDB will overwrite the previously recorded persistent configuration using the new configurations specified by the latest ANALYZE statement. For example, if you run ANALYZE TABLE t WITH 200 TOPN;, it will set the top 200 values in the ANALYZE statement. Subsequently, executing ANALYZE TABLE t WITH 0.1 SAMPLERATE; will set both the top 200 values and a sampling rate of 0.1 for auto ANALYZE statements, similar to ANALYZE TABLE t WITH 200 TOPN, 0.1 SAMPLERATE;.
Disable ANALYZE configuration persistence
To disable the ANALYZE configuration persistence feature, set the tidb_persist_analyze_options system variable to OFF. Because the ANALYZE configuration persistence feature is not applicable to tidb_analyze_version = 1, setting tidb_analyze_version = 1 can also disable the feature.
After disabling the ANALYZE configuration persistence feature, TiDB does not clear the persisted configuration records. Therefore, if you enable this feature again, TiDB continues to collect statistics using the previously recorded persistent configurations.
View ANALYZE state
When executing the ANALYZE statement, you can view the current state of ANALYZE using the following SQL statement:
SHOW ANALYZE STATUS [ShowLikeOrWhere]
This statement returns the state of ANALYZE. You can use ShowLikeOrWhere to filter the information you need.
Currently, the SHOW ANALYZE STATUS statement returns the following 7 columns:
View statistics
You can view the statistics status using the following statements.
Metadata of tables
You can use the SHOW STATS_META statement to view the total number of rows and the number of updated rows.
SHOW STATS_META [ShowLikeOrWhere];
The syntax of ShowLikeOrWhereOpt is as follows:

Currently, the SHOW STATS_META statement returns the following 6 columns:
Health state of tables
You can use the SHOW STATS_HEALTHY statement to check the health state of tables and roughly estimate the accuracy of the statistics. When modify_count >= row_count, the health state is 0; when modify_count < row_count, the health state is (1 - modify_count/row_count) * 100.
The syntax is as follows:
SHOW STATS_HEALTHY [ShowLikeOrWhere];
The synopsis of SHOW STATS_HEALTHY is:

Currently, the SHOW STATS_HEALTHY statement returns the following 4 columns:
Metadata of columns
You can use the SHOW STATS_HISTOGRAMS statement to view the number of different values and the number of NULL in all the columns.
Syntax as follows:
SHOW STATS_HISTOGRAMS [ShowLikeOrWhere]
This statement returns the number of different values and the number of NULL in all the columns. You can use ShowLikeOrWhere to filter the information you need.
Currently, the SHOW STATS_HISTOGRAMS statement returns the following 10 columns:
Buckets of histogram
You can use the SHOW STATS_BUCKETS statement to view each bucket of the histogram.
The syntax is as follows:
SHOW STATS_BUCKETS [ShowLikeOrWhere]
The diagram is as follows:

This statement returns information about all the buckets. You can use ShowLikeOrWhere to filter the information you need.
Currently, the SHOW STATS_BUCKETS statement returns the following 11 columns:
Top-N information
You can use the SHOW STATS_TOPN statement to view the Top-N information currently collected by TiDB.
The syntax is as follows:
SHOW STATS_TOPN [ShowLikeOrWhere];
Currently, the SHOW STATS_TOPN statement returns the following 7 columns:
Delete statistics
You can run the DROP STATS statement to delete statistics.
Syntax as follows:
DROP STATS TableName
The statement deletes statistics of all the tables in TableName.
Load statistics
By default, depending on the size of column statistics, TiDB loads statistics differently as follows:
- For statistics that consume small amounts of memory (such as count, distinctCount, and nullCount), as long as the column data is updated, TiDB automatically loads the corresponding statistics into memory for use in the SQL optimization stage.
- For statistics that consume large amounts of memory (such as histograms, TopN, and Count-Min Sketch), to ensure the performance of SQL execution, TiDB loads the statistics asynchronously on demand. Take histograms as an example. TiDB loads histogram statistics on a column into memory only when the optimizer uses the histogram statistics on that column. On-demand asynchronous statistics loading does not affect the performance of SQL execution but might provide incomplete statistics for SQL optimization.
Since v5.4.0, TiDB introduces the synchronously loading statistics feature. This feature allows TiDB to synchronously load large-sized statistics (such as histograms, TopN, and Count-Min Sketch statistics) into memory when you execute SQL statements, which improves the completeness of statistics for SQL optimization.
The synchronously loading statistics feature is disabled by default. To enable this feature, set the value of the tidb_stats_load_sync_wait system variable to a timeout (in milliseconds) that SQL optimization can wait for at most to synchronously load complete column statistics. The default value of this variable is 0, indicating that the feature is disabled.
After enabling the synchronously loading statistics feature, you can further configure the feature as follows:
- To control how TiDB behaves when the waiting time of SQL optimization reaches the timeout, modify the value of the
tidb_stats_load_pseudo_timeoutsystem variable. The default value of this variable isOFF, indicating that the SQL execution fails after the timeout. If you set this variable toON, after the timeout, the SQL optimization process does not use any histogram, TopN, or CMSketch statistics on any columns, but gets back to using pseudo statistics. - To specify the maximum number of columns that the synchronously loading statistics feature can process concurrently, modify the value of the
stats-load-concurrencyoption in the TiDB configuration file. The default value is5. - To specify the maximum number of column requests that the synchronously loading statistics feature can cache, modify the value of the
stats-load-queue-sizeoption in the TiDB configuration file. The default value is1000.
Import and export statistics
Export statistics
The interface to export statistics is as follows:
To obtain the JSON format statistics of the
${table_name}table in the${db_name}database:http://${tidb-server-ip}:${tidb-server-status-port}/stats/dump/${db_name}/${table_name}For example:
curl -s http://127.0.0.1:10080/stats/dump/test/t1 -o /tmp/t1.jsonTo obtain the JSON format statistics of the
${table_name}table in the${db_name}database at specific time:http://${tidb-server-ip}:${tidb-server-status-port}/stats/dump/${db_name}/${table_name}/${yyyyMMddHHmmss}
Import statistics
Generally, the imported statistics refer to the JSON file obtained using the export interface.
Syntax:
LOAD STATS 'file_name'
file_name is the file name of the statistics to be imported.