You are viewing the documentation of an older version of the TiDB database (TiDB v5.4). It is recommended that you use the latest LTS version of the TiDB database.
Key Metrics
If you use TiUP to deploy the TiDB cluster, the monitoring system (Prometheus & Grafana) is deployed at the same time. For more information, see TiDB Monitoring Framework Overview.
The Grafana dashboard is divided into a series of sub dashboards which include Overview, PD, TiDB, TiKV, Node_exporter, Disk Performance, and so on. A lot of metrics are there to help you diagnose.
For routine operations, you can get an overview of the component (PD, TiDB, TiKV) status and the entire cluster from the Overview dashboard, where the key metrics are displayed. This document provides a detailed description of these key metrics.
Key metrics description
To understand the key metrics displayed on the Overview dashboard, check the following table:
| Service | Panel Name | Description | Normal Range |
|---|---|---|---|
| Services Port Status | Services Up | The online nodes number of each service. | |
| PD | PD role | The role of the current PD. | |
| PD | Storage capacity | The total storage capacity of the TiDB cluster. | |
| PD | Current storage size | The occupied storage capacity of the TiDB cluster, including the space occupied by TiKV replicas. | |
| PD | Normal stores | The number of nodes in the normal state. | |
| PD | Abnormal stores | The number of nodes in the abnormal state. | 0 |
| PD | Number of Regions | The total number of Regions in the current cluster. Note that the number of Regions has nothing to do with the number of replicas. | |
| PD | 99% completed_cmds_duration_seconds | The 99th percentile duration to complete a pd-server request. | less than 5ms |
| PD | Handle_requests_duration_seconds | The network duration of a PD request. | |
| PD | Region health | The state of each Region. | Generally, the number of pending peers is less than 100, and that of the missing peers cannot always be greater than 0. |
| PD | Hot write Region's leader distribution | The total number of leaders who are the write hotspots on each TiKV instance. | |
| PD | Hot read Region's leader distribution | The total number of leaders who are the read hotspots on each TiKV instance. | |
| PD | Region heartbeat report | The count of heartbeats reported to PD per instance. | |
| PD | 99% Region heartbeat latency | The heartbeat latency per TiKV instance (P99). | |
| TiDB | Statement OPS | The number of different types of SQL statements executed per second, which is counted according to SELECT, INSERT, UPDATE, and other types of statements. | |
| TiDB | Duration | The execution time. 1. The duration between the time that the client's network request is sent to TiDB and the time that the request is returned to the client after TiDB has executed the request. In general, client requests are sent in the form of SQL statements; however, this duration can include the execution time of commands such as COM_PING, COM_SLEEP, COM_STMT_FETCH, and COM_SEND_LONG_DATA.2. Because TiDB supports Multi-Query, TiDB supports sending multiple SQL statements at one time, such as select 1; select 1; select 1;. In this case, the total execution time of this query includes the execution time of all SQL statements. | |
| TiDB | CPS By Instance | CPS By Instance: the command statistics on each TiDB instance, which is classified according to the success or failure of command execution results. | |
| TiDB | Failed Query OPM | The statistics of error types (such as syntax errors and primary key conflicts) based on the errors occurred when executing SQL statements per second on each TiDB instance. The module in which the error occurs and the error code are included. | |
| TiDB | Connection Count | The connection number of each TiDB instance. | |
| TiDB | Memory Usage | The memory usage statistics of each TiDB instance, which is divided into the memory occupied by processes and the memory applied by Golang on the heap. | |
| TiDB | Transaction OPS | The number of transactions executed per second. | |
| TiDB | Transaction Duration | The execution time of a transaction | |
| TiDB | KV Cmd OPS | The number of executed KV commands. | |
| TiDB | KV Cmd Duration 99 | The execution time of the KV command. | |
| TiDB | PD TSO OPS | The number of TSO that TiDB obtains from PD per second. | |
| TiDB | PD TSO Wait Duration | The duration that TiDB waits for PD to return TSO. | |
| TiDB | TiClient Region Error OPS | The number of Region related errors returned by TiKV. | |
| TiDB | Lock Resolve OPS | The number of TiDB operations that resolve locks. When TiDB's read or write request encounters a lock, it tries to resolve the lock. | |
| TiDB | KV Backoff OPS | The number of errors returned by TiKV. | |
| TiKV | leader | The number of leaders on each TiKV node. | |
| TiKV | region | The number of Regions on each TiKV node. | |
| TiKV | CPU | The CPU usage ratio on each TiKV node. | |
| TiKV | Memory | The memory usage on each TiKV node. | |
| TiKV | store size | The size of storage space used by each TiKV instance. | |
| TiKV | cf size | The size of each column family (CF for short). | |
| TiKV | channel full | The number of "channel full" errors on each TiKV instance. | 0 |
| TiKV | server report failures | The number of error messages reported by each TiKV instance. | 0 |
| TiKV | scheduler pending commands | The number of pending commands on each TiKV instance. | |
| TiKV | coprocessor executor count | The number of coprocessor operations received by TiKV per second. Each type of coprocessor is counted separately. | |
| TiKV | coprocessor request duration | The time consumed to process read requests of coprocessor. | |
| TiKV | raft store CPU | The CPU usage ratio of the raftstore thread | The default number of threads is 2 (configured by raftstore.store-pool-size). A value of over 80% for a single thread indicates that the CPU usage ratio is very high. |
| TiKV | Coprocessor CPU | The CPU usage ratio of the coprocessor thread. | |
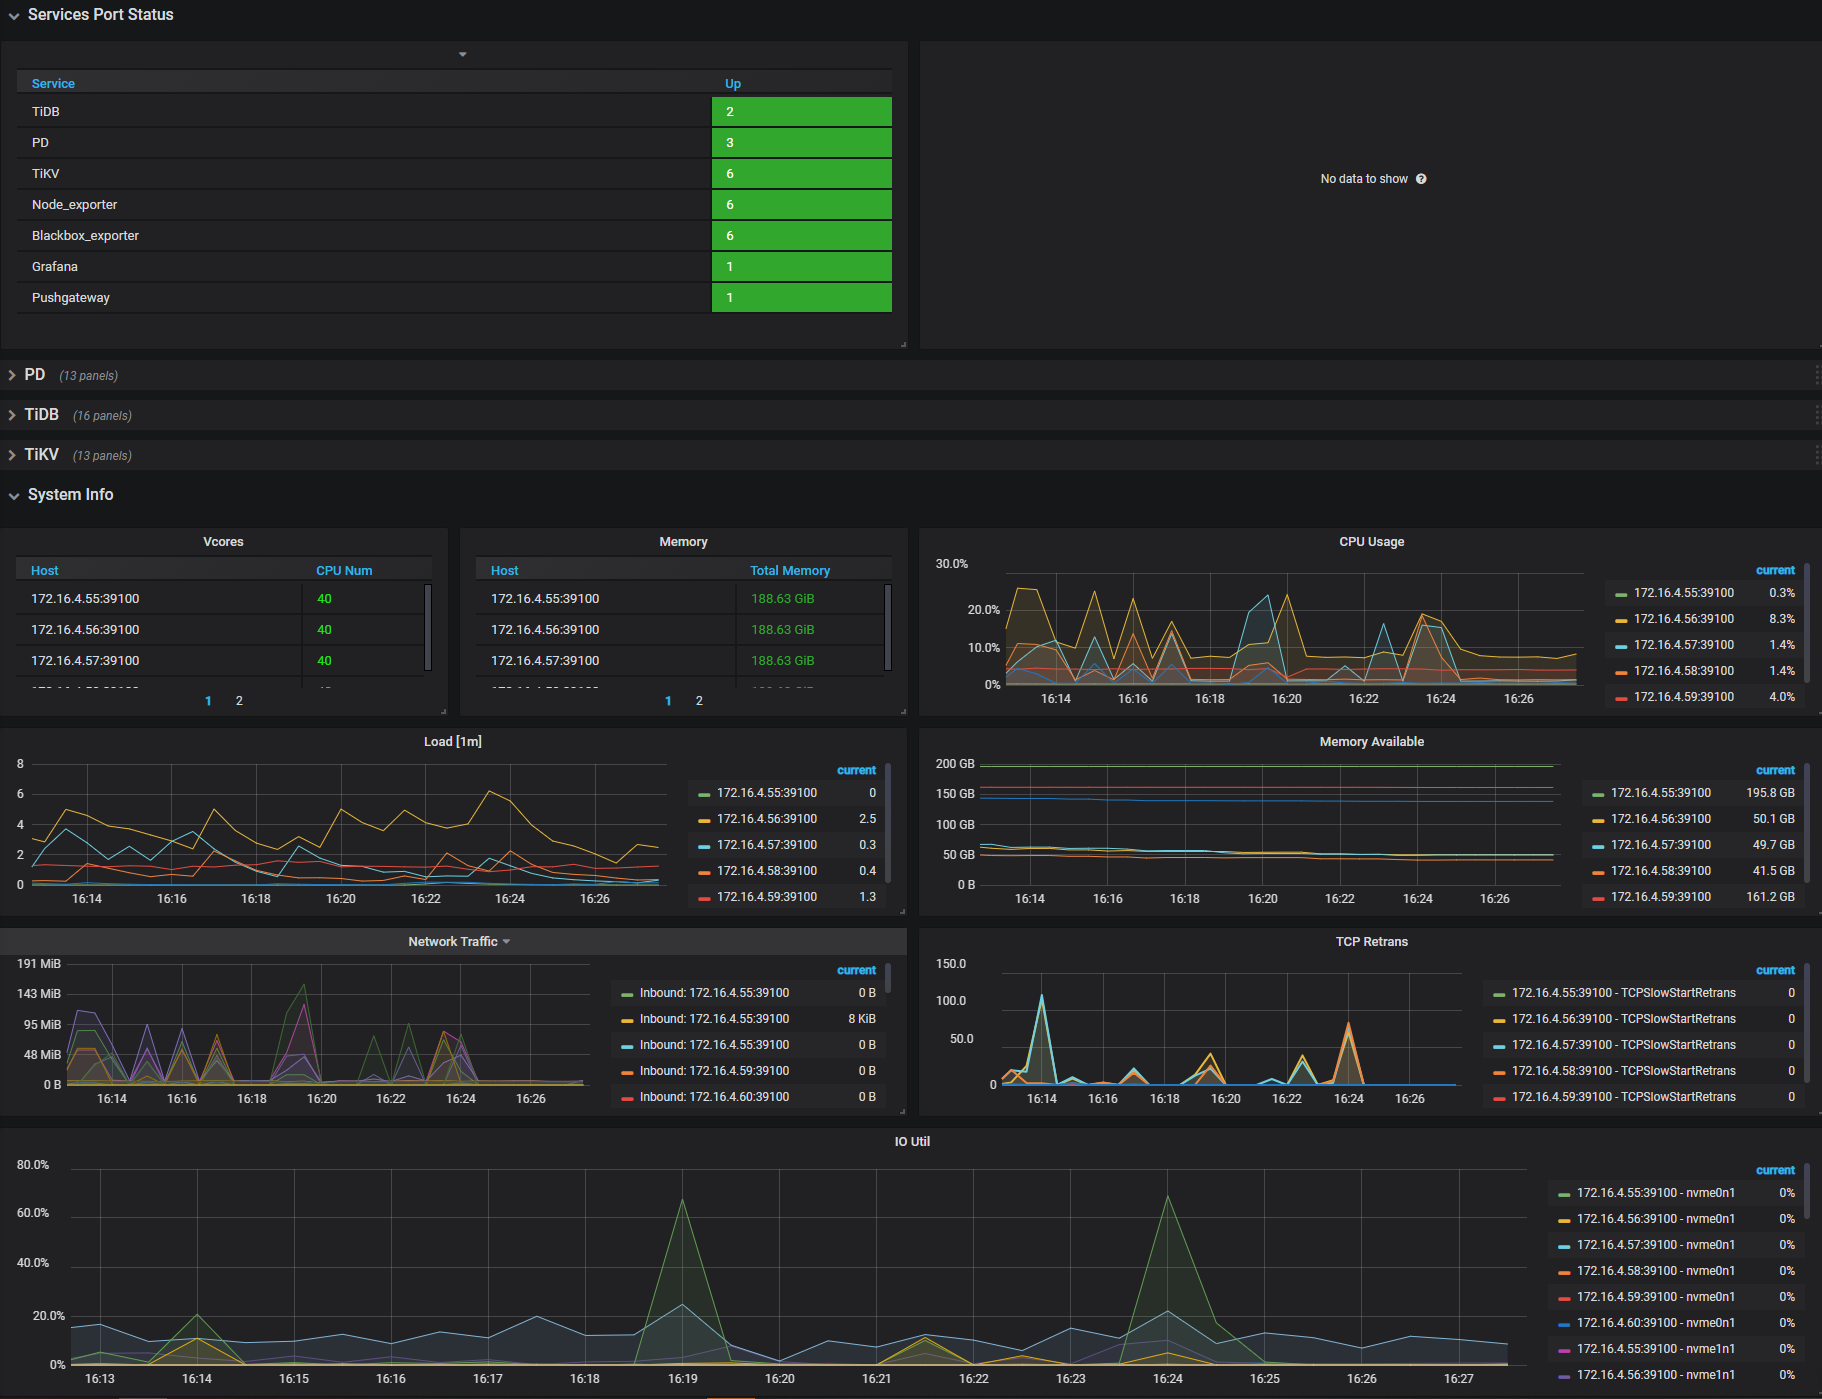
| System Info | Vcores | The number of CPU cores. | |
| System Info | Memory | The total memory. | |
| System Info | CPU Usage | The CPU usage ratio, 100% at a maximum. | |
| System Info | Load [1m] | The overload within 1 minute. | |
| System Info | Memory Available | The size of the available memory. | |
| System Info | Network Traffic | The statistics of the network traffic. | |
| System Info | TCP Retrans | The frequency of the TOC retransmission. | |
| System Info | IO Util | The disk usage ratio, 100% at a maximum; generally you need to consider adding a new node when the usage ratio is up to 80% ~ 90%. |
Interface of the Overview dashboard