Manual Instance Profiling Page
On the manual instance profiling page, you can collect performance data of TiDB, TiKV, PD, and TiFlash instances. The data collected can be displayed on a flame graph or a directed acyclic graph. The graph visually shows what internal operations are performed on the instances during the performance summary period and the corresponding proportions. With this graph, you can quickly learn the CPU resource consumption of these instances.
Profiling content
With Manual Profiling, you can collect performance data of TiDB, PD, TiKV, and TiFlash instances. The data collected can be displayed in forms such as a flame graph or a directed acyclic graph. The data displayed visually shows what internal operations are performed on the instances during the performance profiling period and the corresponding proportions. With such data, you can quickly learn the CPU resource consumption of these instances.
Access the page
You can access the instance profiling page using either of the following methods:
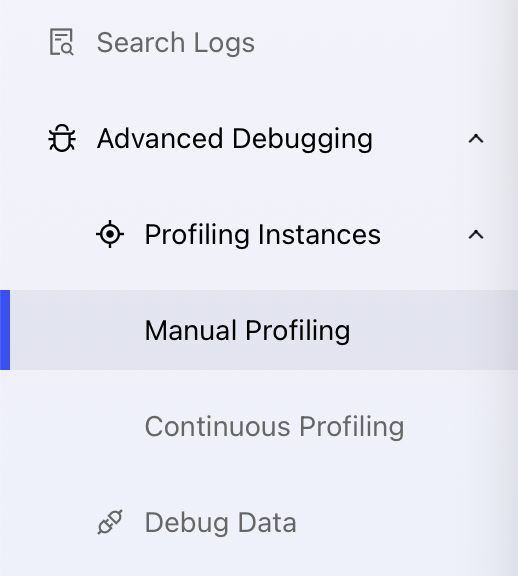
After logging into TiDB Dashboard, click Advanced Debugging > Profiling Instances > Manual Profiling on the left navigation bar.
Visit http://127.0.0.1:2379/dashboard/#/instance_profiling in your browser. Replace
127.0.0.1:2379with the actual PD instance address and port.
Start Profiling
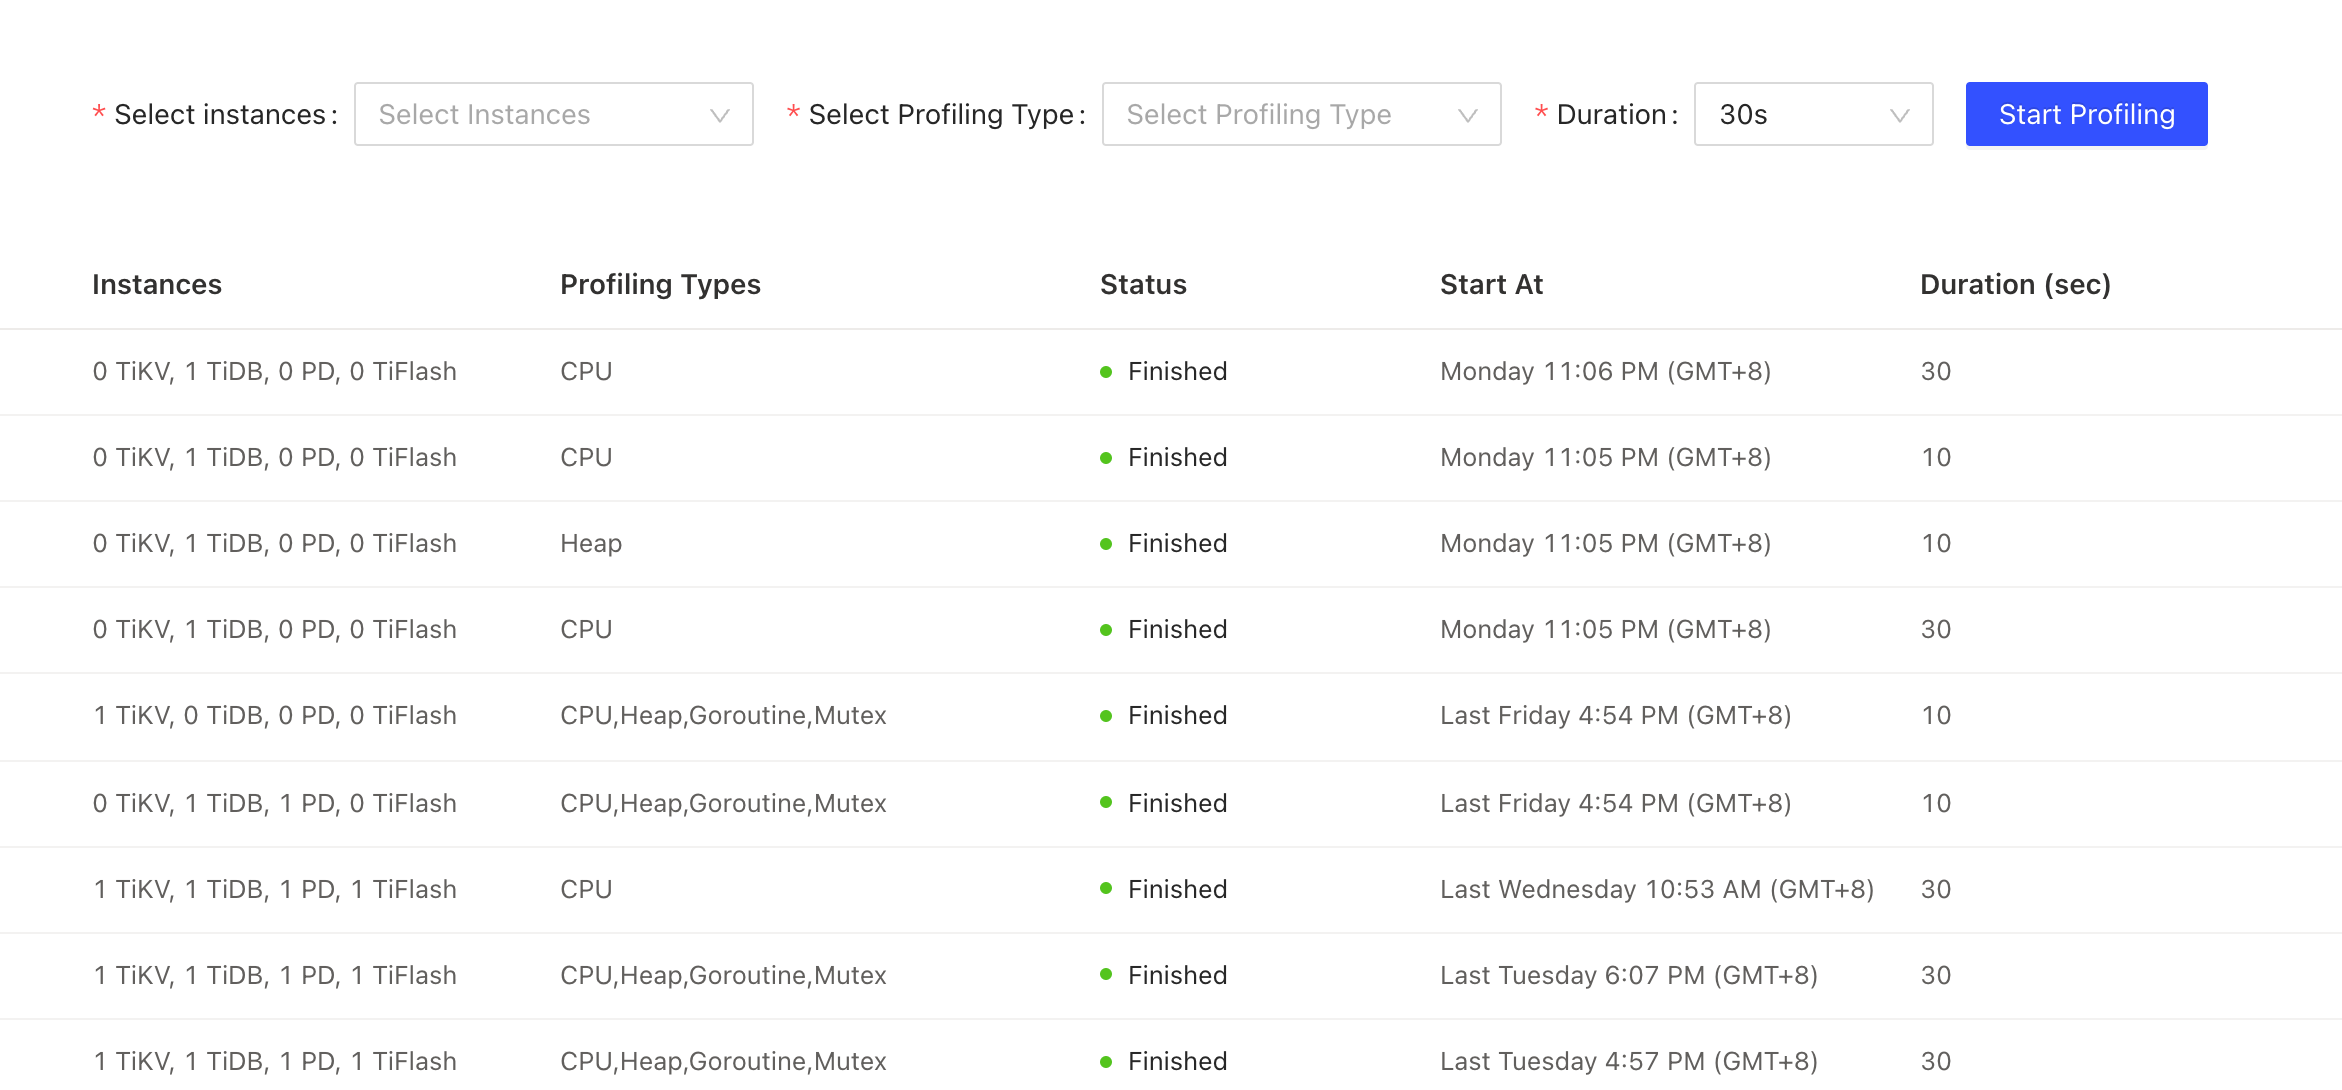
In the instance profiling page, choose at least one target instance and click Start Profiling to start the instance profiling.
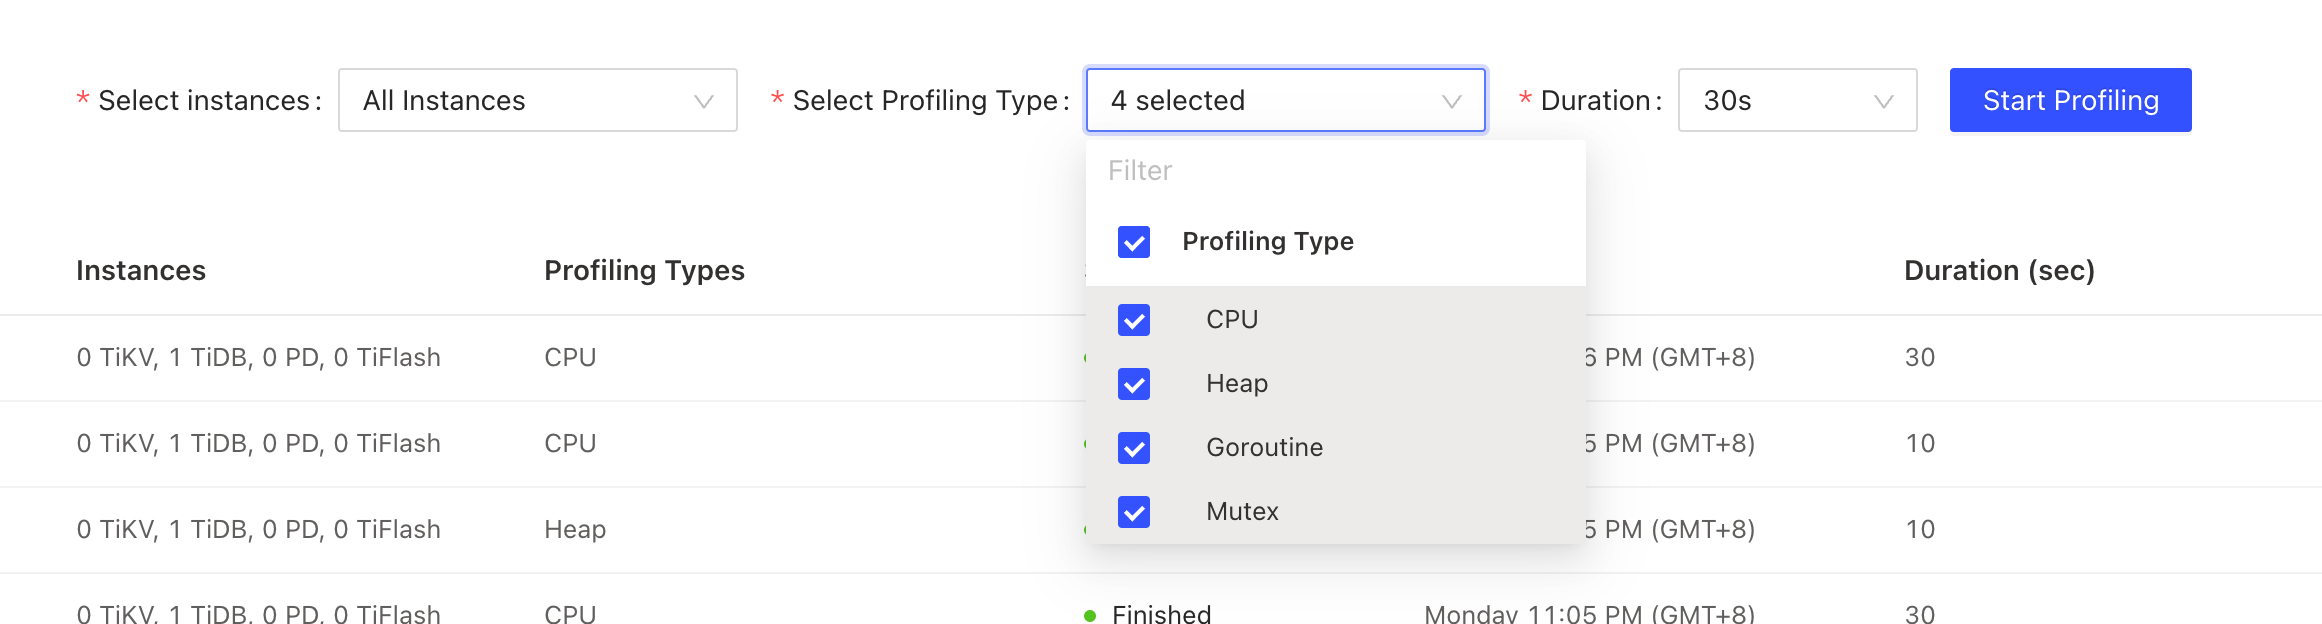
You can modify the profiling duration before starting the profiling. This duration is determined by the time needed for the profiling, which is 30 seconds by default. The 30-second duration takes approximately 30 seconds to complete.
View profiling status
After a profiling is started, you can view the profiling status and progress in real time.
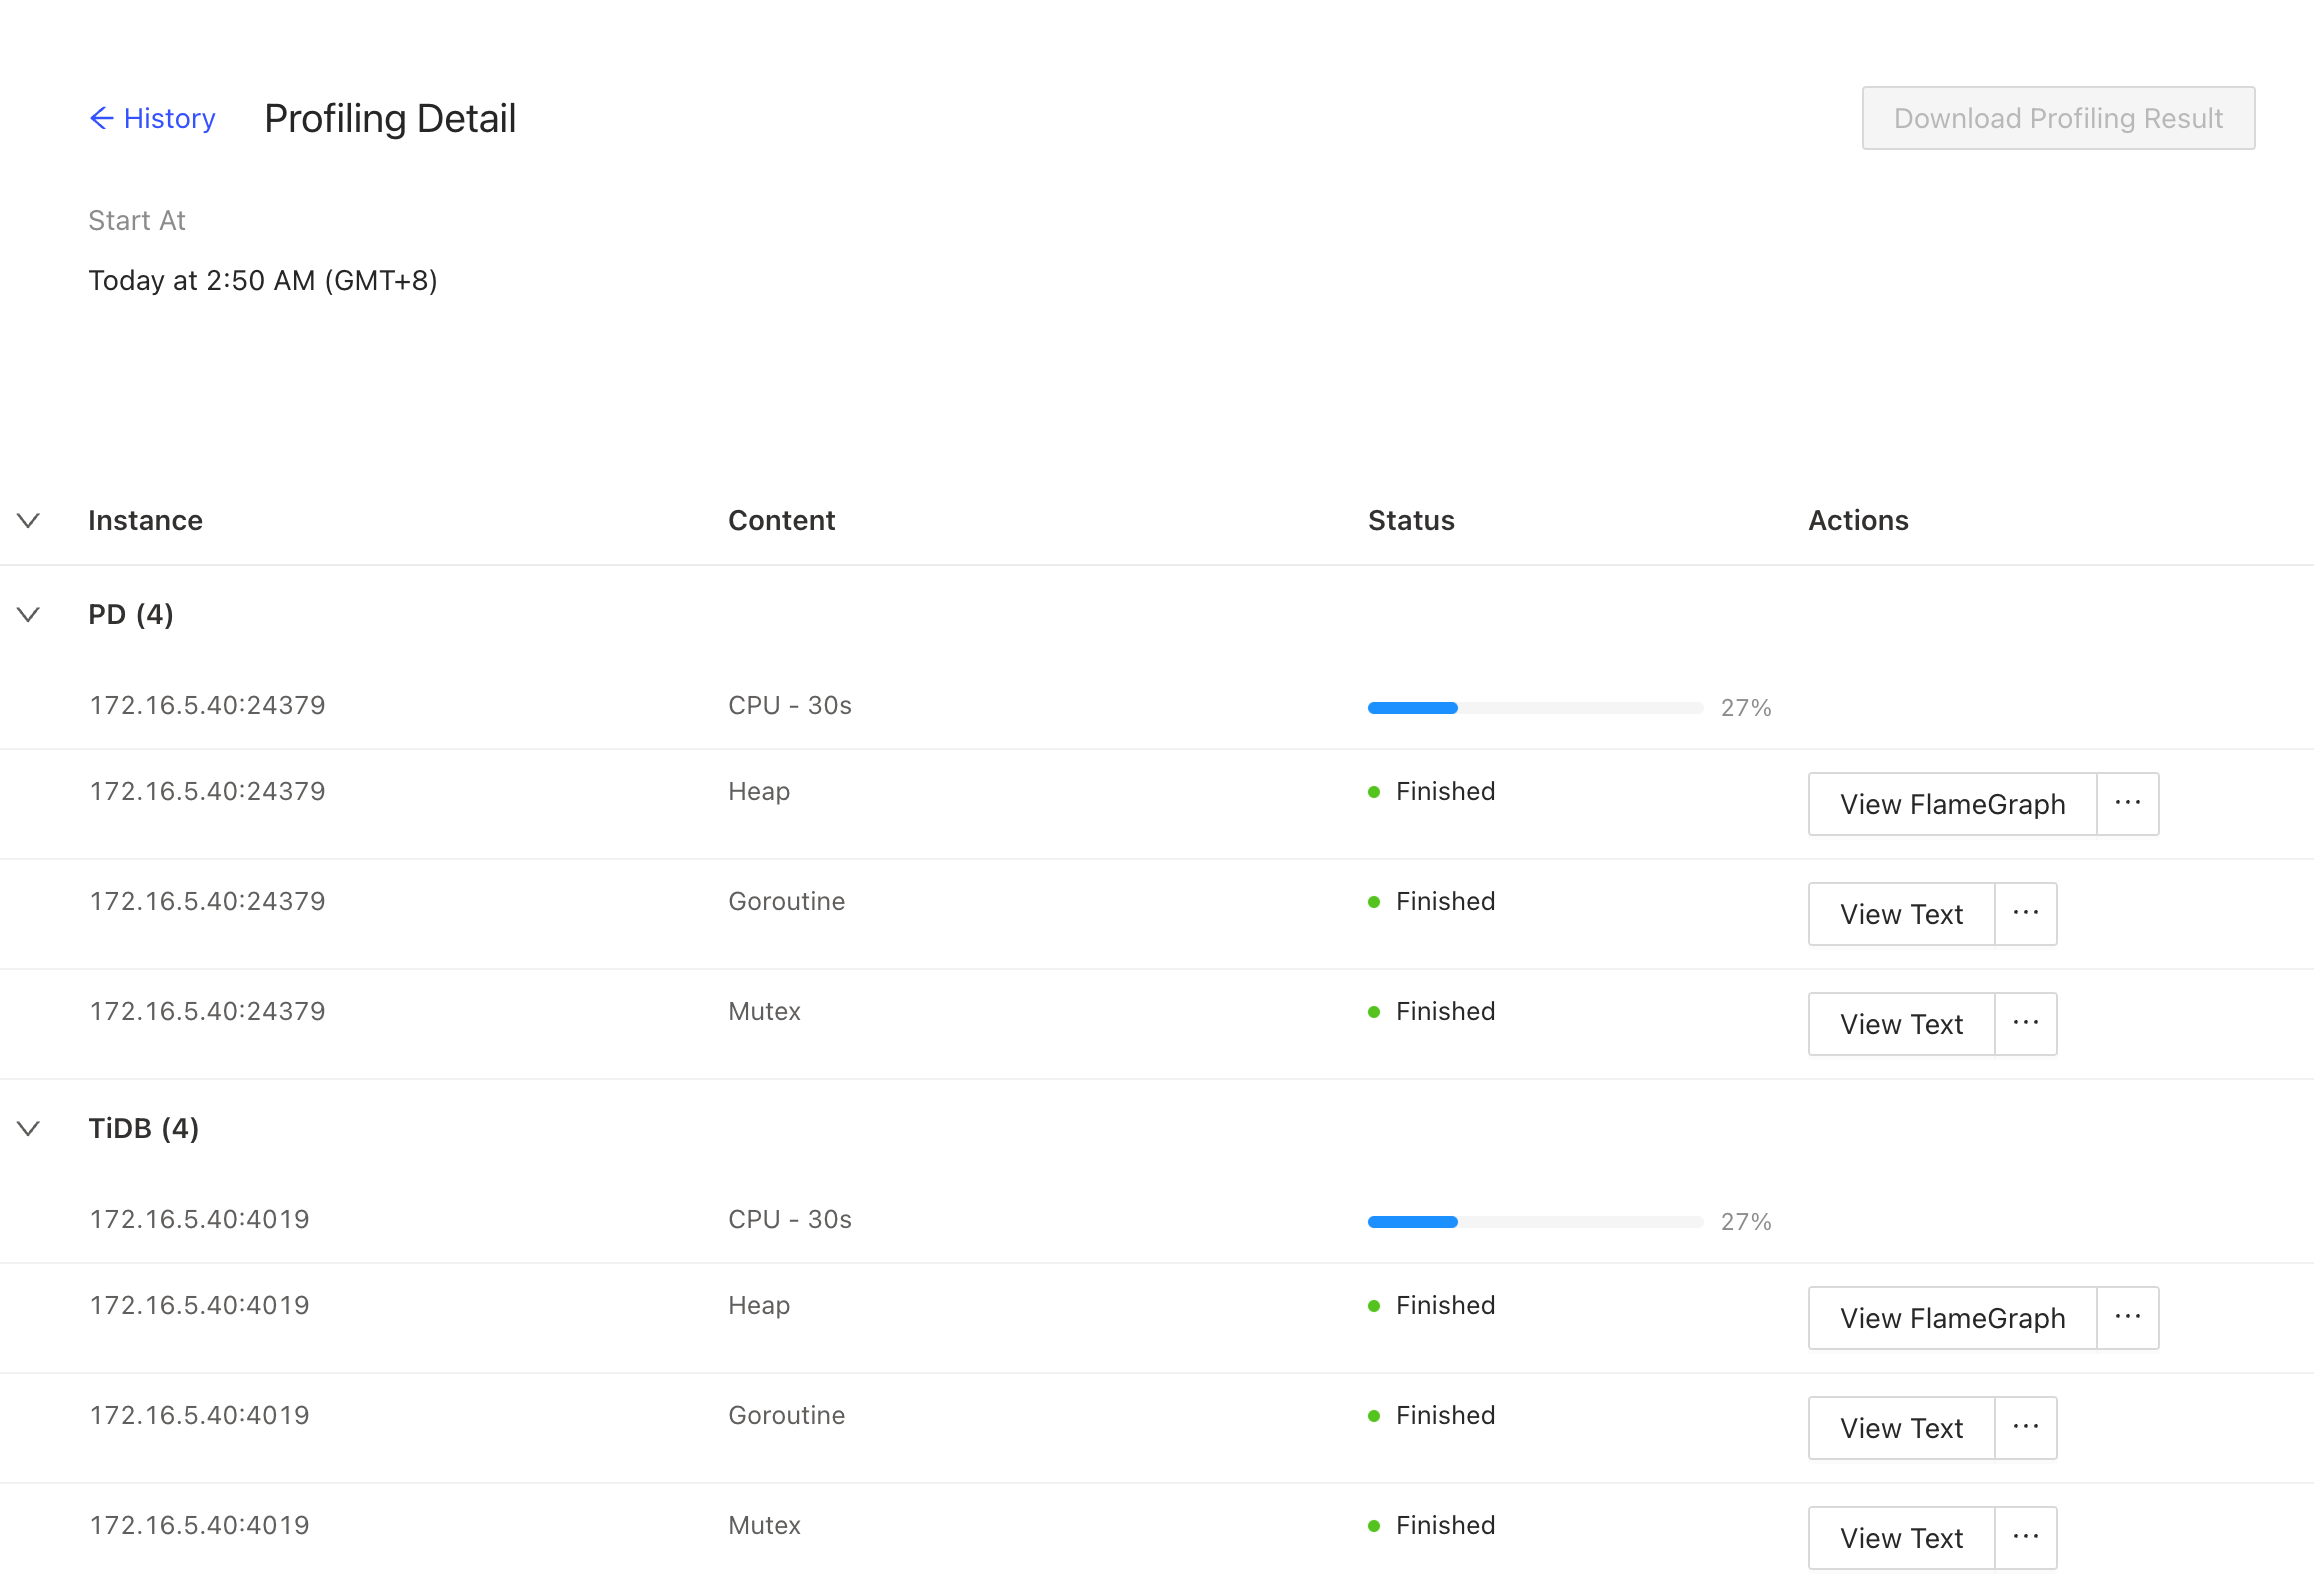
The profiling runs in the background. Refreshing or exiting the current page does not stop the profiling task that is running.
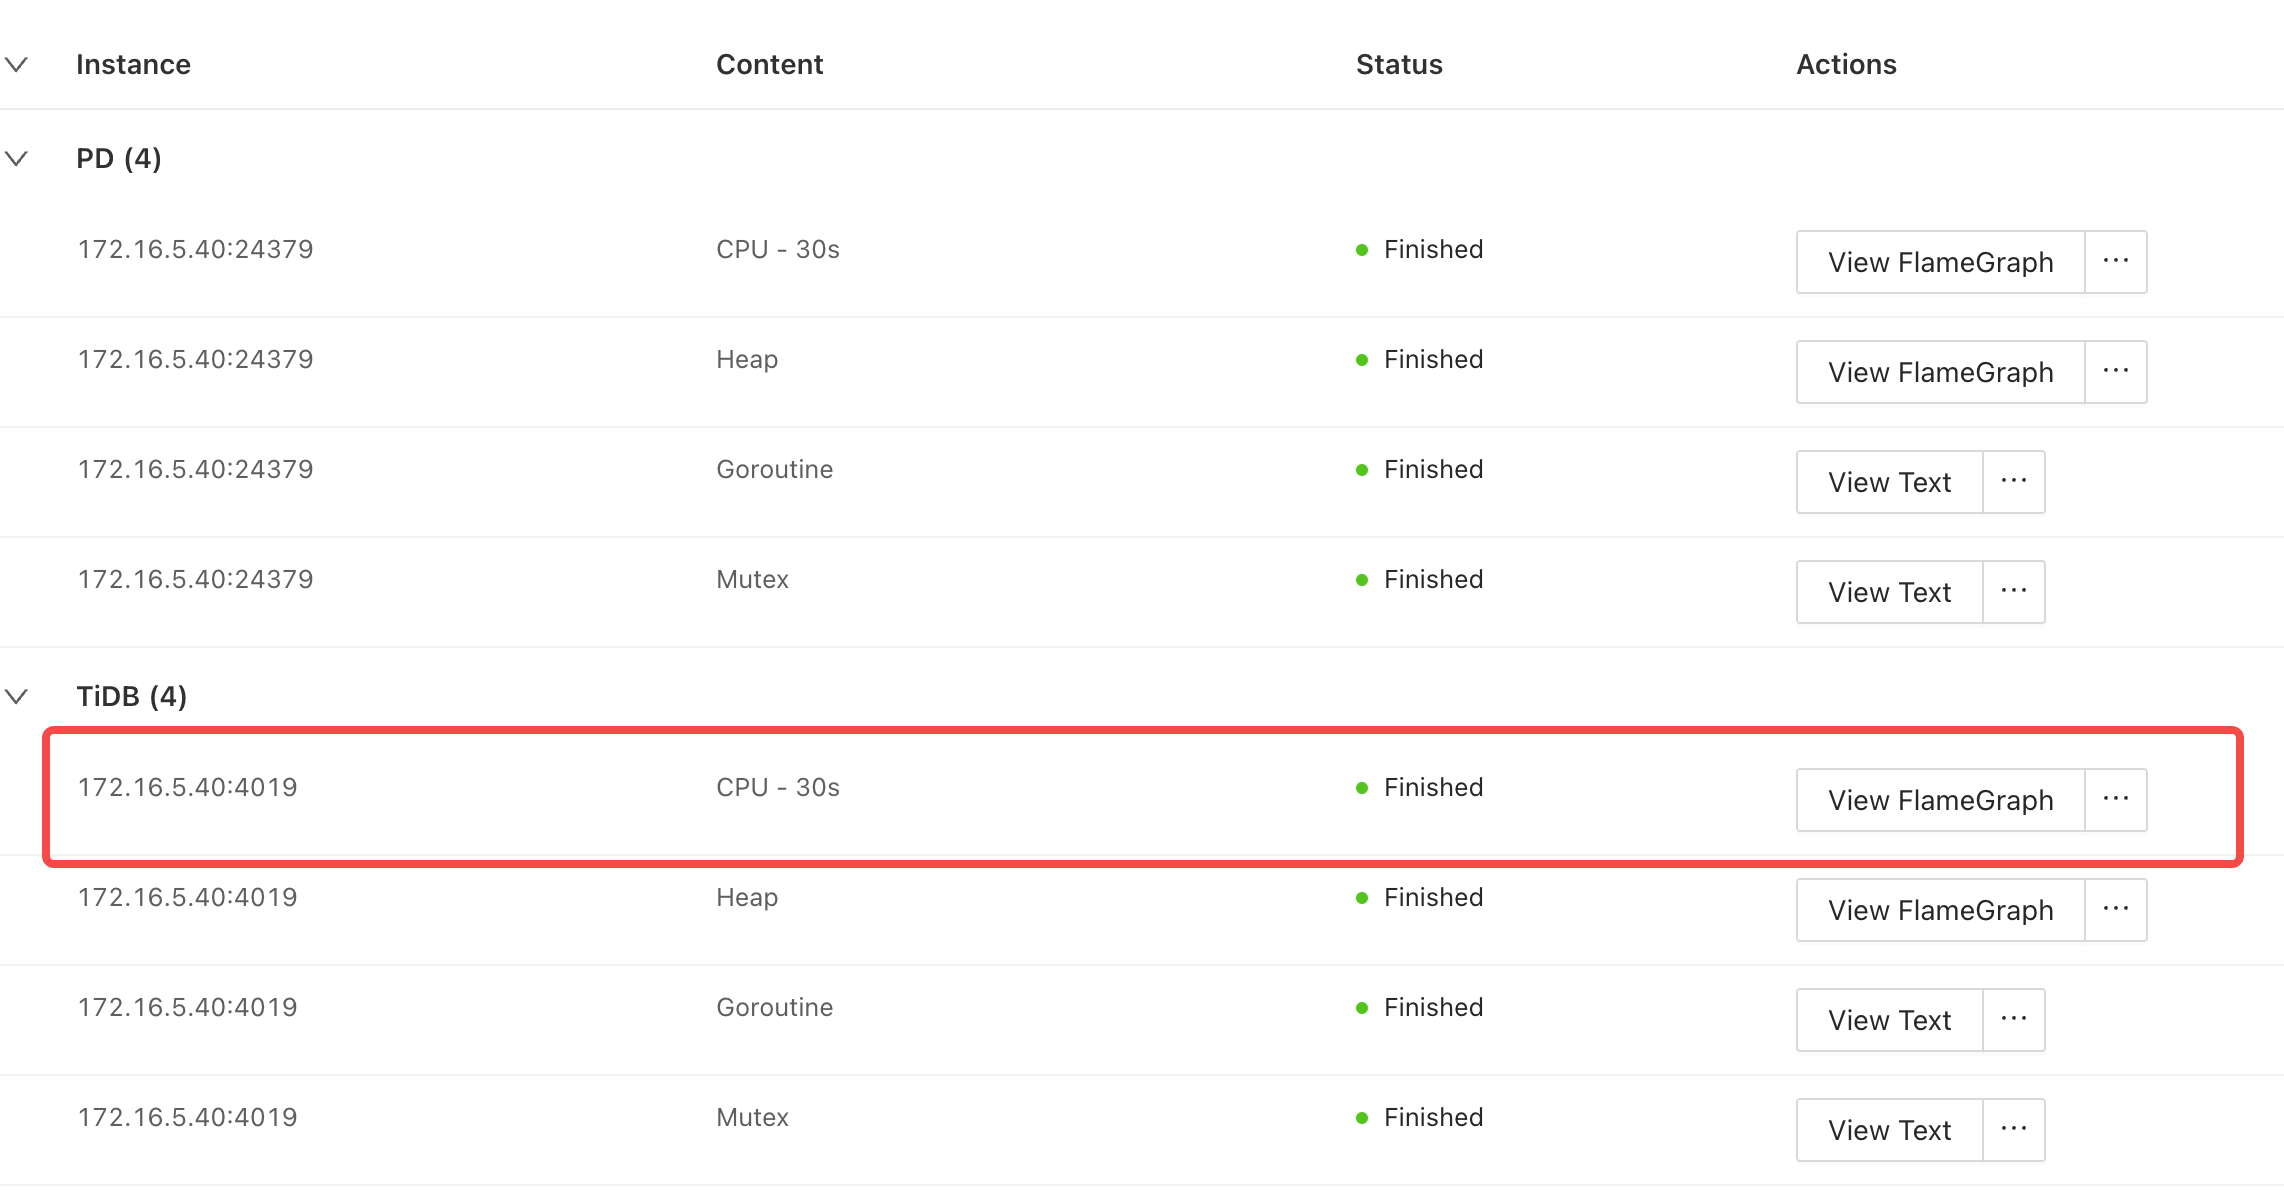
Download profiling result
After the profiling of all instances is completed, you can click Download Profiling Result in the upper right corner to download all profiling results.
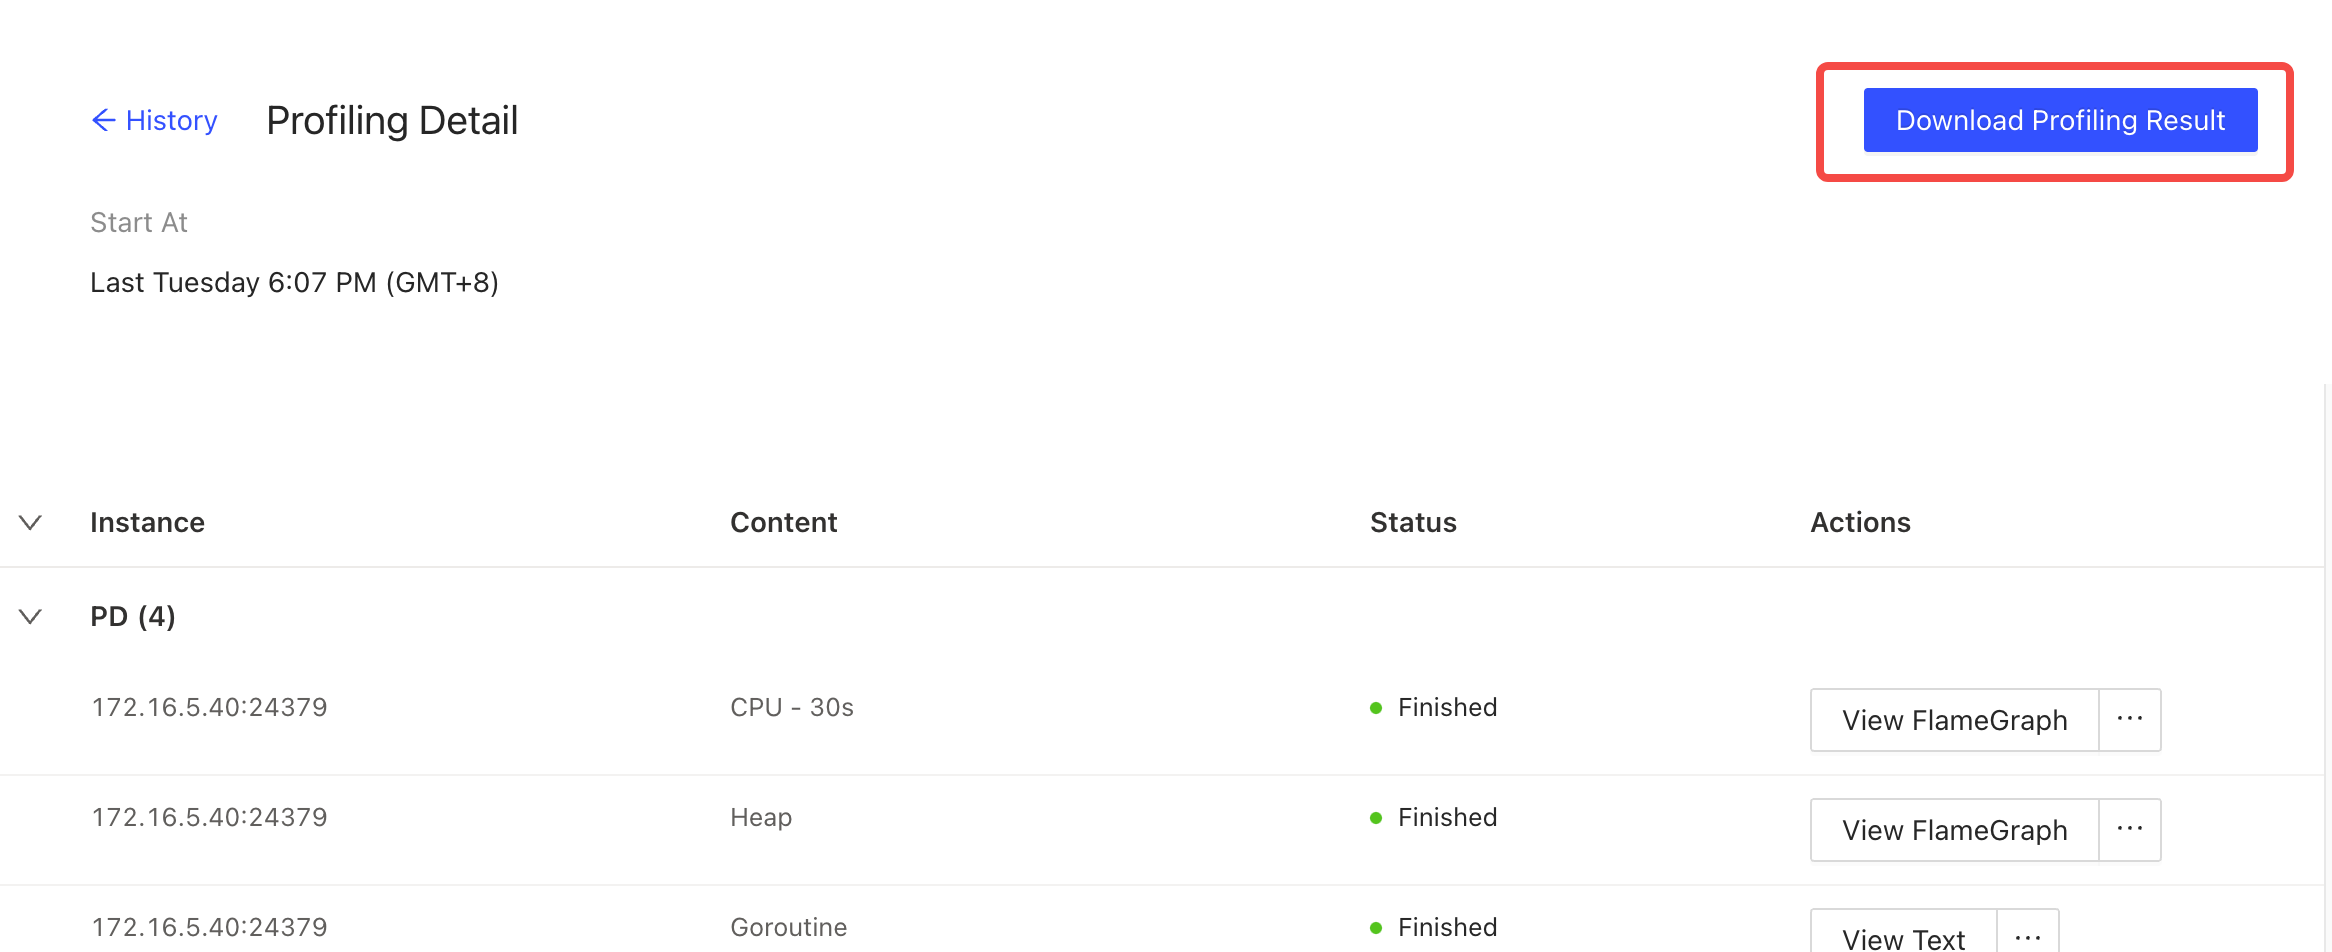
You can also click an individual instance in the table to view its profiling result (including flame charts, directed acyclic graphs, and texts). Alternatively, you can hover on ... to download raw data.
View profiling history
The profiling history is listed on the instance profiling page. Click one row of the list and you can view the status detail.
For detailed operations on the profiling status page, see View profiling status.