TiDB Dashboard Metrics Relation Graph
TiDB Dashboard metrics relation graph is a feature introduced in v4.0.7. This feature presents a relation graph of the monitoring data of each internal process's duration in a TiDB cluster. The aim is to help you quickly understand the duration of each process and their relations.
Access graph
Log into TiDB Dashboard, click Cluster Diagnostics on the left navigation menu, and you can see the page of generating the metrics relation graph.
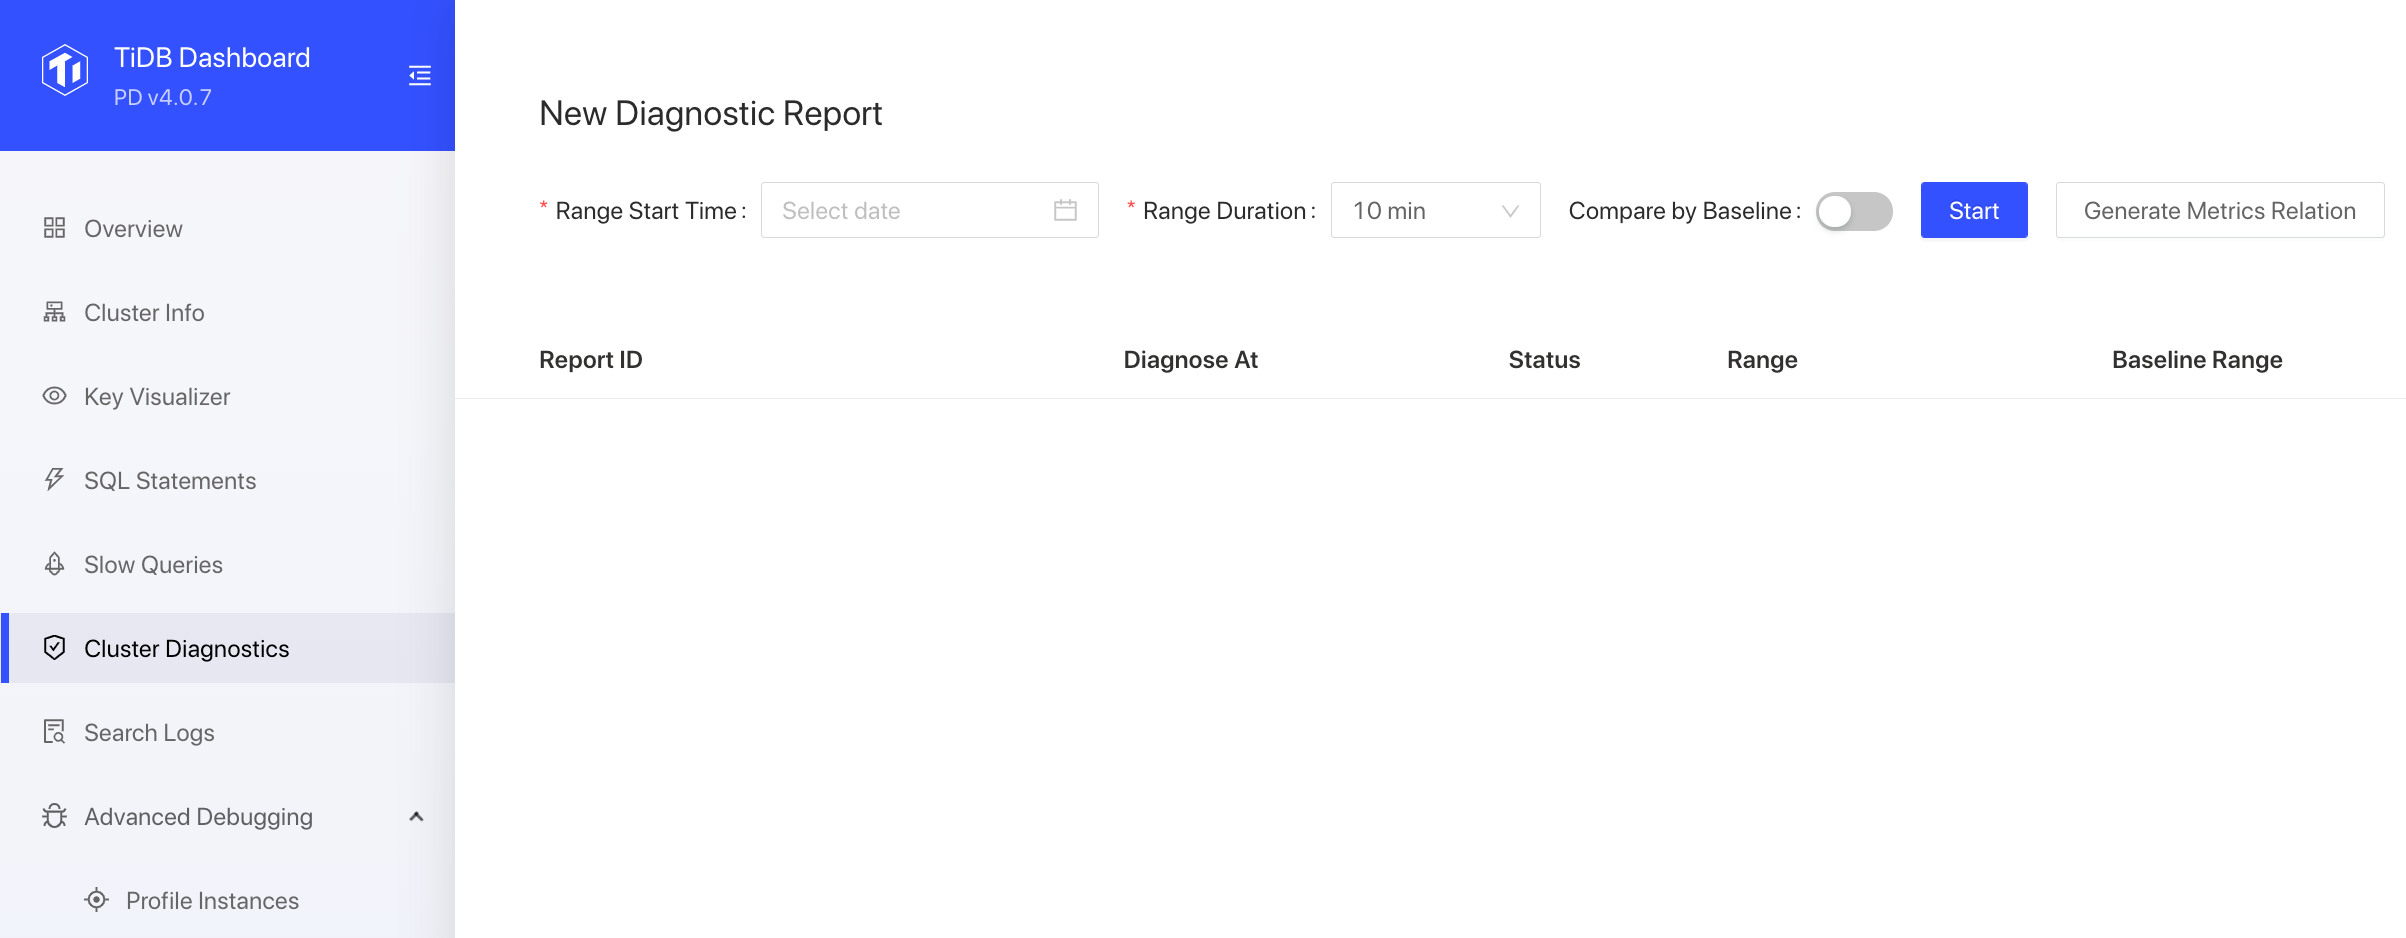
After setting Range Start Time and Range Duration, click the Generate Metrics Relation button and you will enter the page of metrics relation graph.
Understand graph
The following image is an example of the metrics relation graph. This graph illustrates the proportion of each monitoring metric's duration to the total query duration in a TiDB cluster within 5 minutes after 2020-07-29 16:36:00. The graph also illustrates the relations of each monitoring metric.
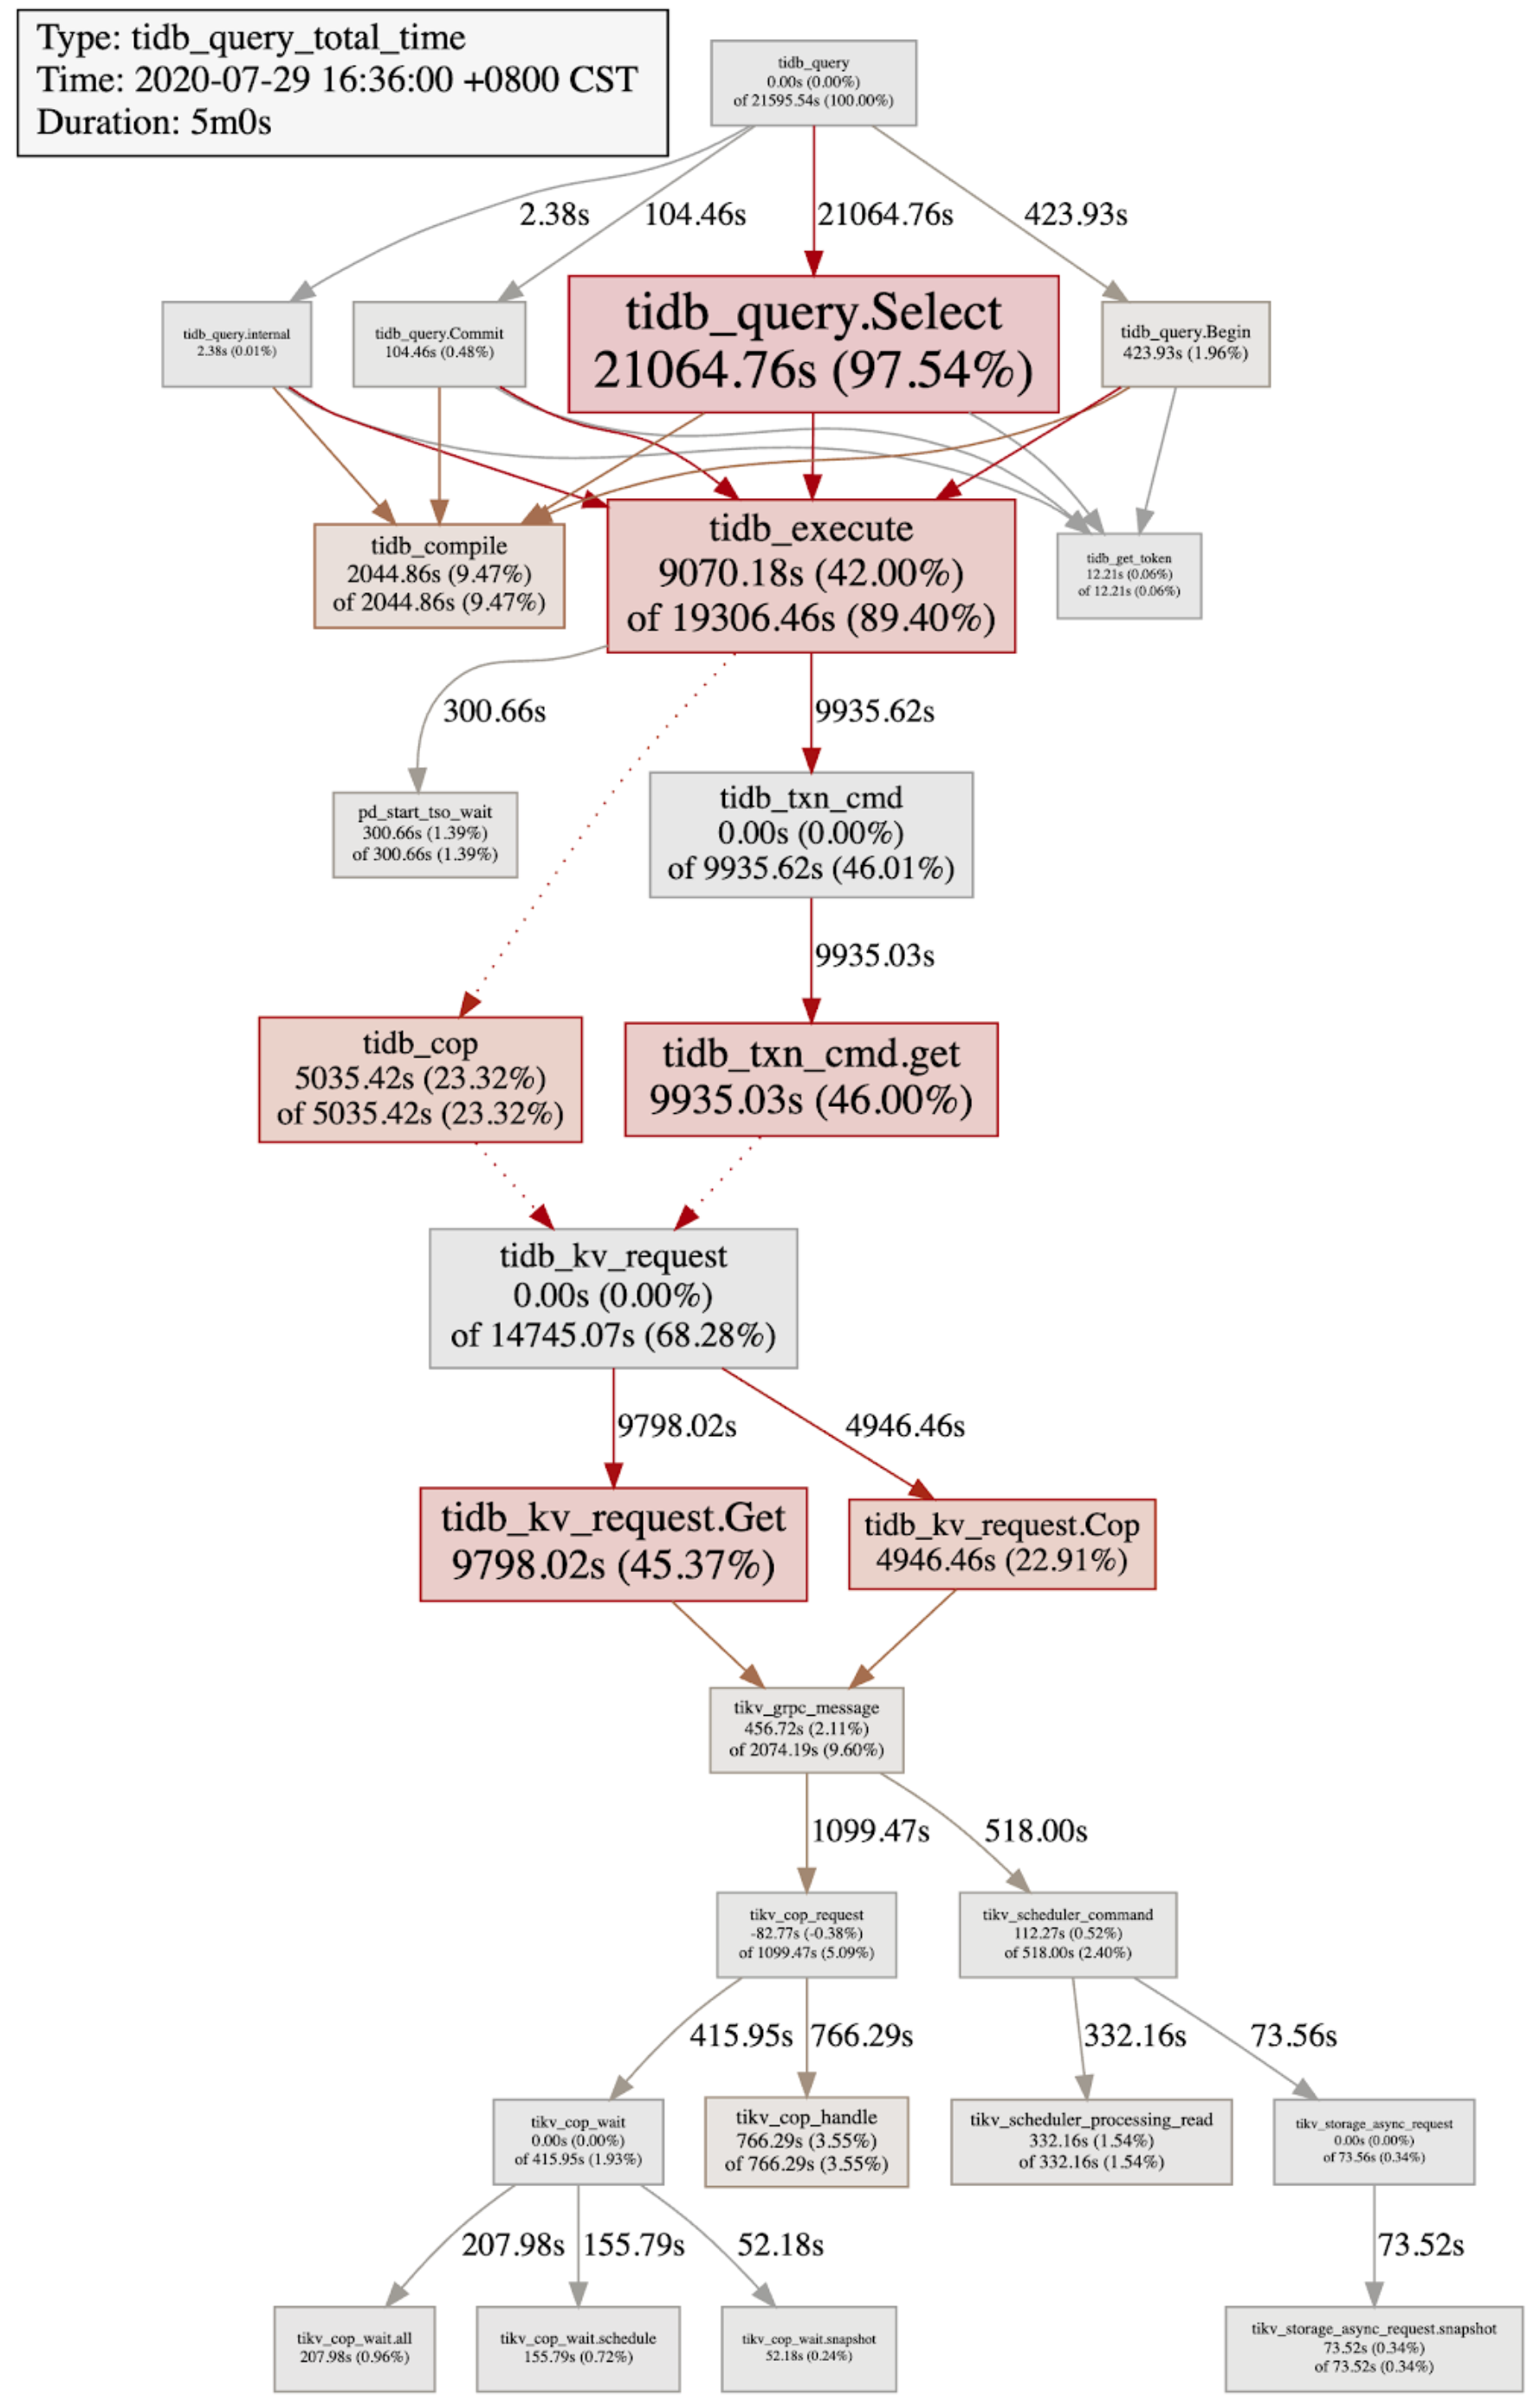
For example, the node meaning of the tidb_execute monitoring metric is as follows:
- The total duration of the
tidb_executemonitoring metric is 19306.46 seconds, which accounts for 89.4% of the total query duration. - The duration of the
tidb_executenode itself is 9070.18 seconds, which accounts for 42% of the total query duration. - Hover your mouse over the box area, and you can see the detailed information of the metric, including the total duration, the average duration, and the average P99 (99th percentile) duration.
Node information
Each box area represents a monitoring metric and provides the following information:
- The name of the monitoring metric
- The total duration of the monitoring metric
- The proportion of the metric's total duration to the total query duration
The total duration of the metric node = the duration of the metric node itself + the duration of its child nodes. Therefore, the metric graph of some nodes displays the proportion of the node itself's duration to the total duration, such as the graph of tidb_execute.
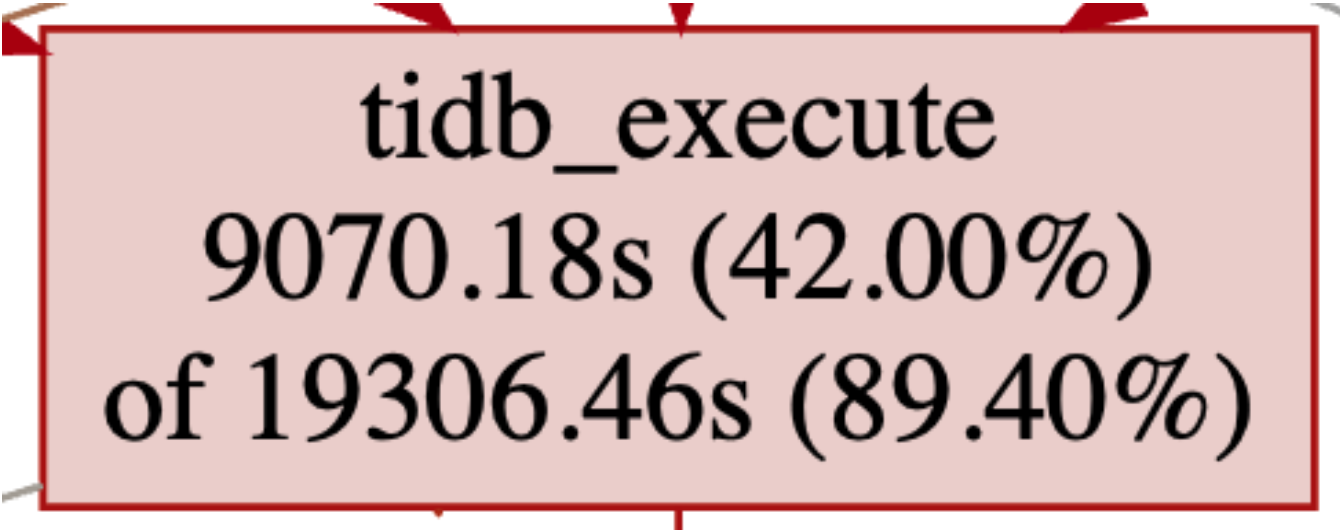
tidb_executeis the name of the monitoring metric, which represents the execution duration of a SQL query in the TiDB execution engine.19306.46srepresents that total duration of thetidb_executemetric is 19306.46 seconds.89.40%represents that 19306.46 seconds account for 89.40% of the total time consumed for all SQL queries (including user SQL queries and TiDB's internal SQL queries). The total query duration is the total duration oftidb_query.9070.18srepresents that the total execution duration of thetidb_executenode itself is 9070.18 seconds, and the rest is the time consumed by its child nodes.42.00%represents that 9070.18 seconds account for 42.00% of the total query duration of all queries.
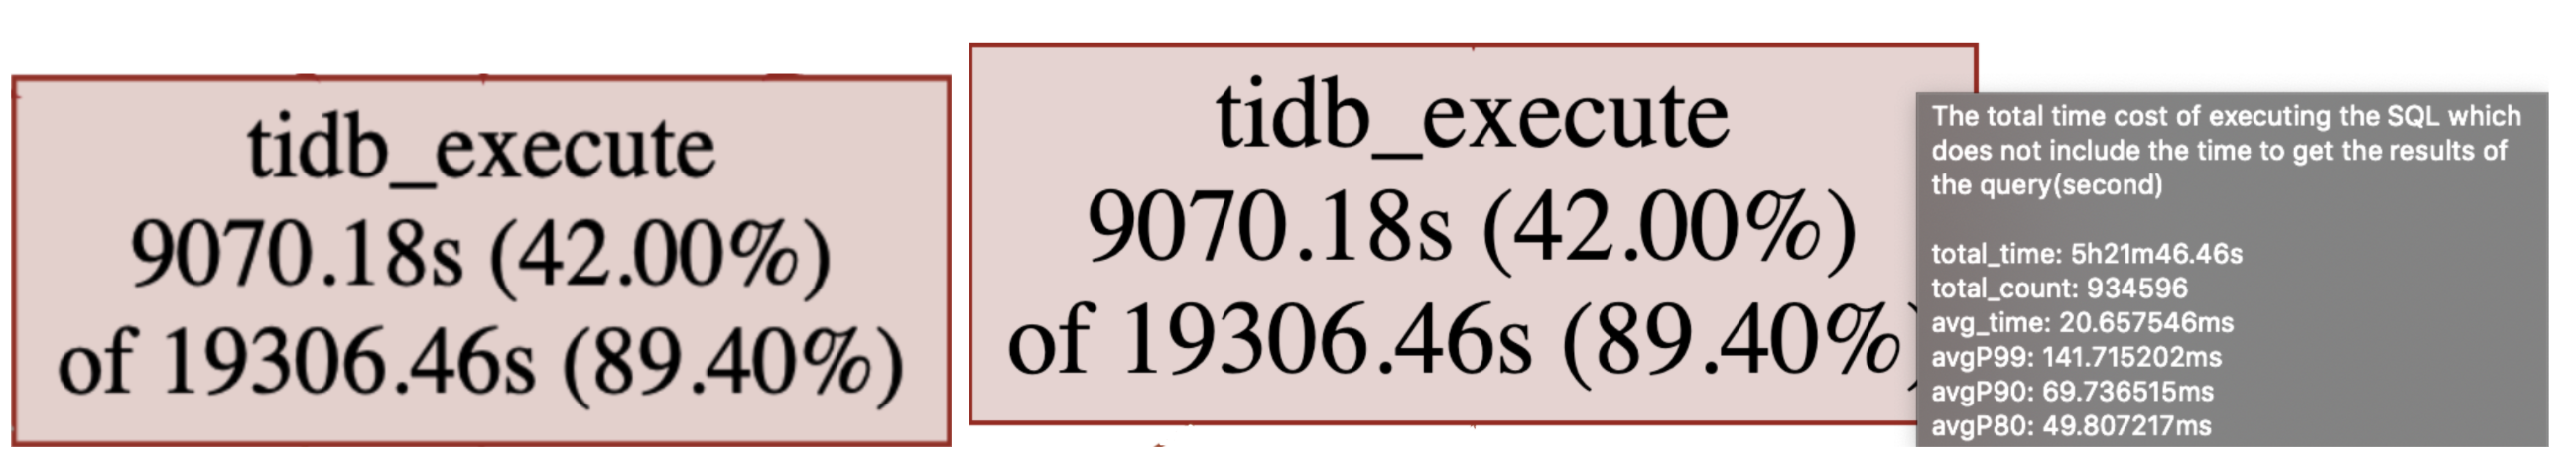
Hover your mouse over the box area and you can see more details of the tidb_execute metric node:
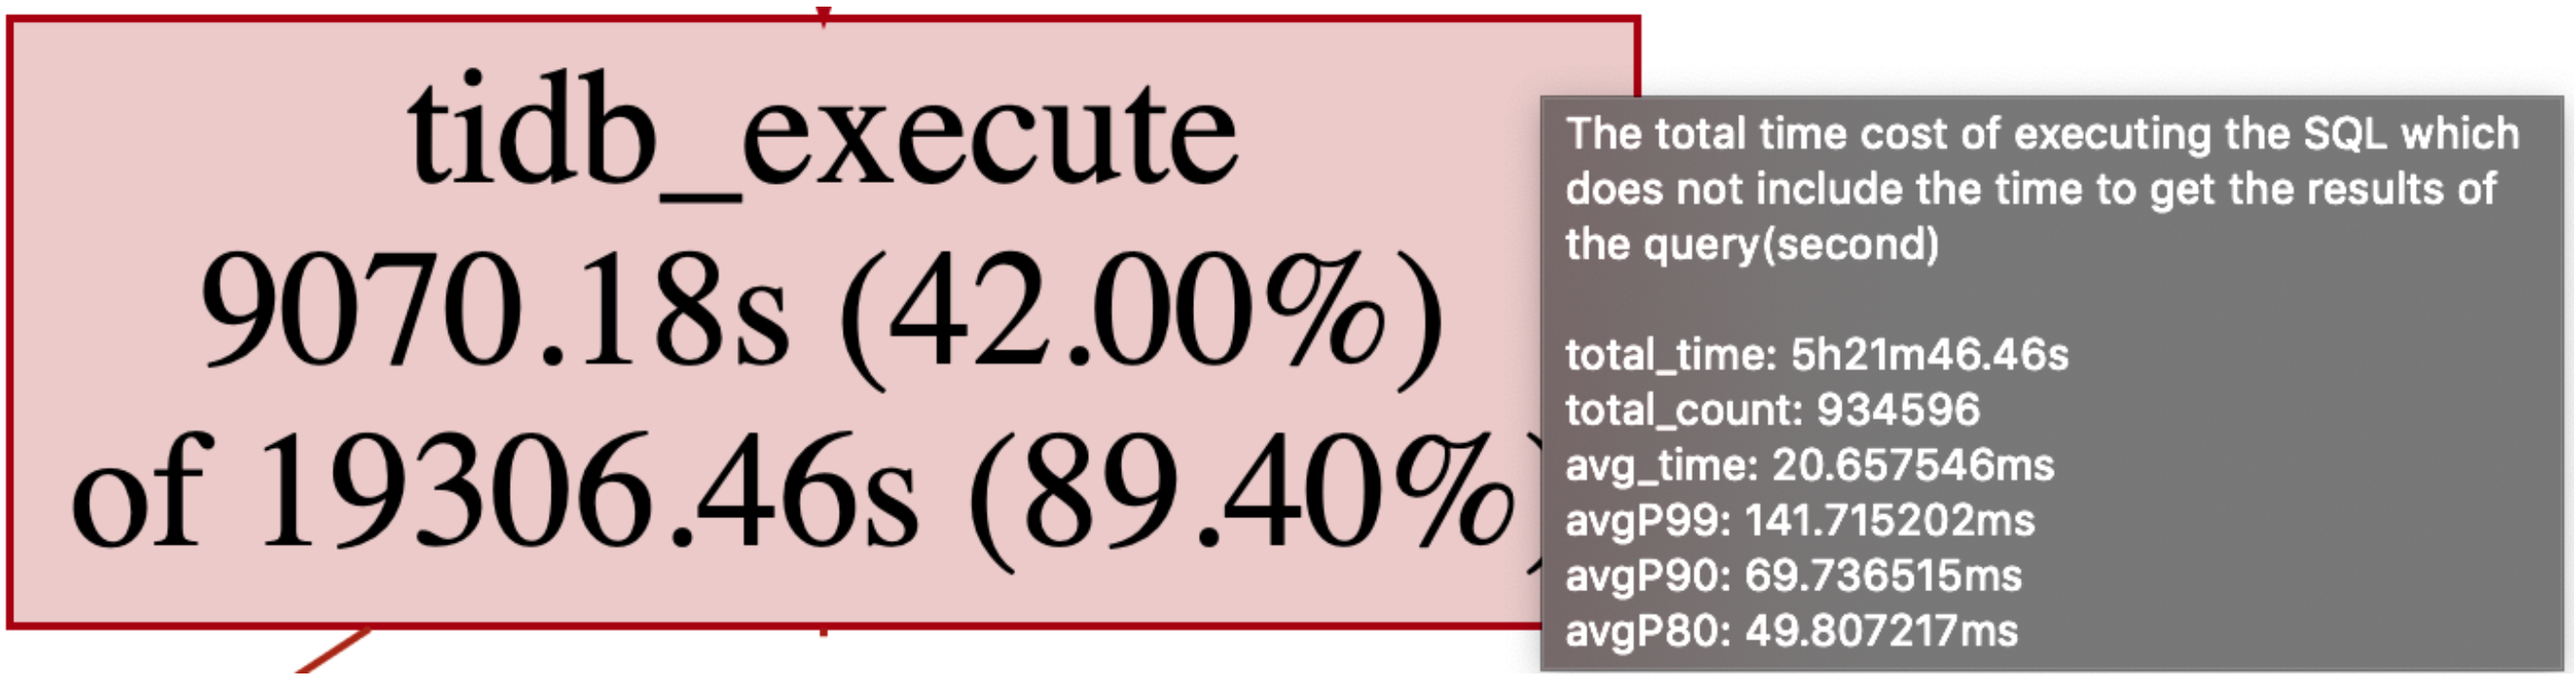
The text information displayed in the image above is the description of the metric node, including the total duration, the total times, the average duration, and the average duration P99, P90, and P80.
The parent-child relations between nodes
Taking the tidb_execute metric node as an example, this section introduces a metric's child nodes.
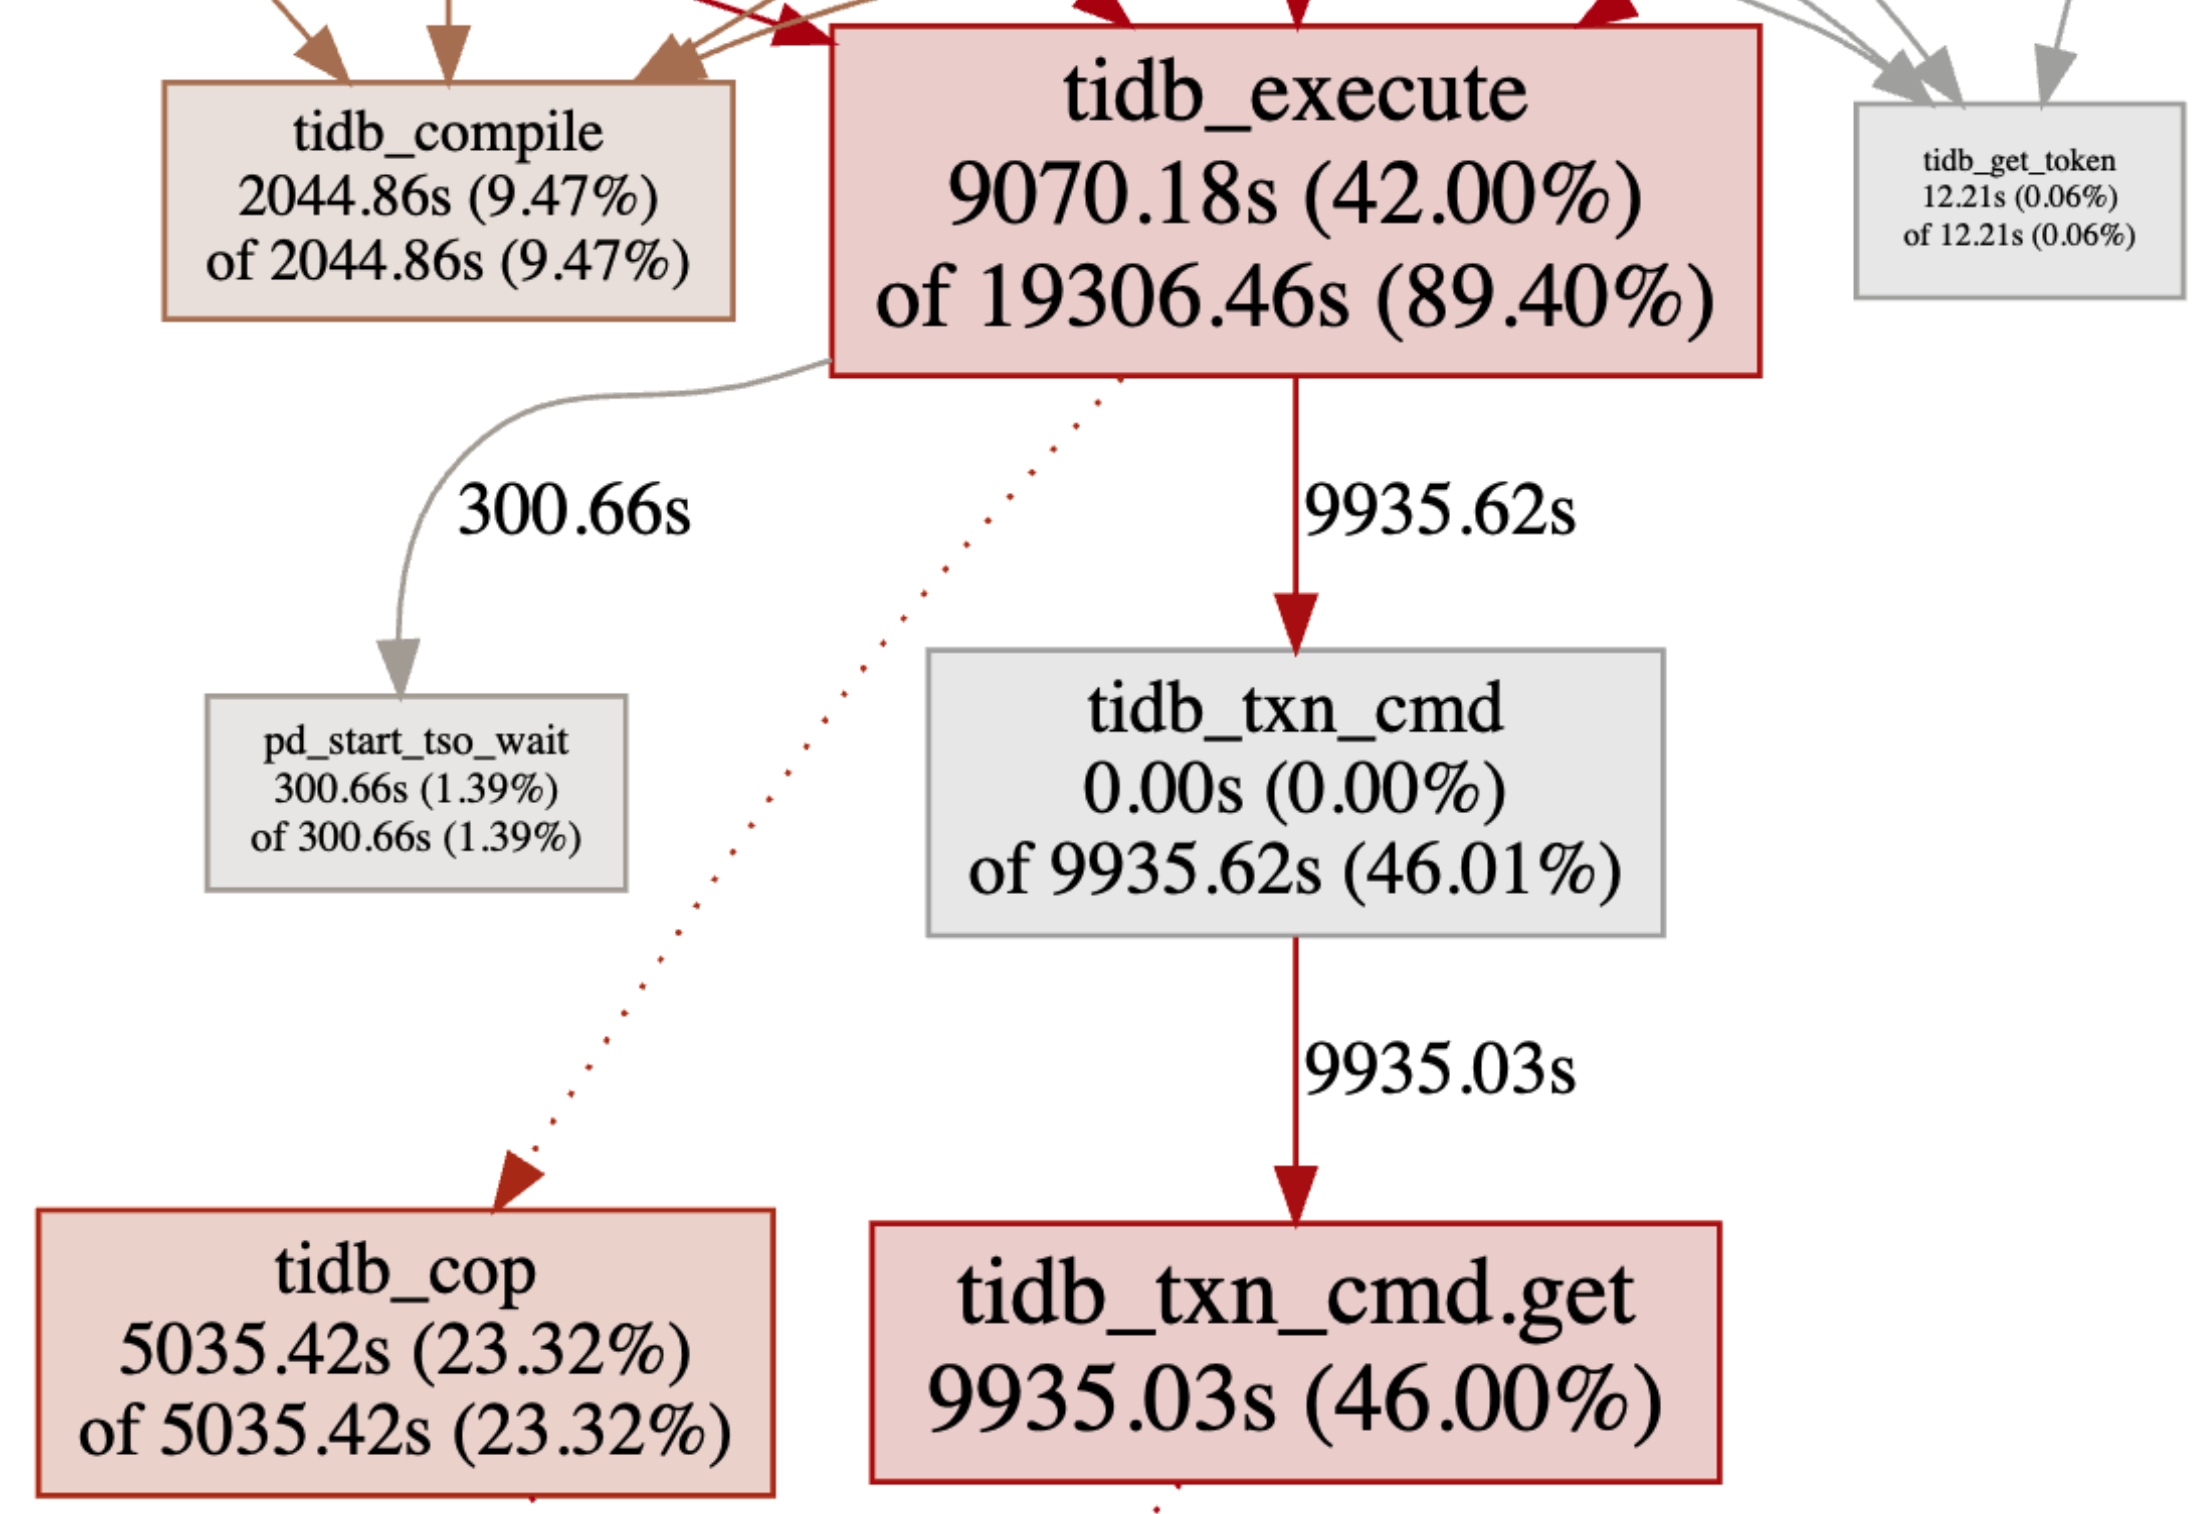
From the graph above, you can see the two child nodes of tidb_execute:
pd_start_tso_wait: The total duration of waiting for the transaction'sstart_tso, which is 300.66 seconds.tidb_txn_cmd: The total duration of TiDB executing the relevant transaction commands, which is 9935.62 seconds.
In addition, tidb_execute also has a dotted arrow pointing to the tidb_cop box area, which indicates as follows:
tidb_execute includes the duration of the tidb_cop metric, but cop requests might be executed concurrently. For example, the execute duration of performing join queries on two tables is 60 seconds, during which table scan requests are concurrently executed on the joined two tables. If the execution durations of cop requests are respectively 40 seconds and 30 seconds, the total duration of cop requests are 70 seconds. However, the execute duration is only 60 seconds. Therefore, if the duration of a parent node does not completely include the duration of a child node, the dotted arrow is used to point to the child node.
tidb_kv_request and its parent nodes
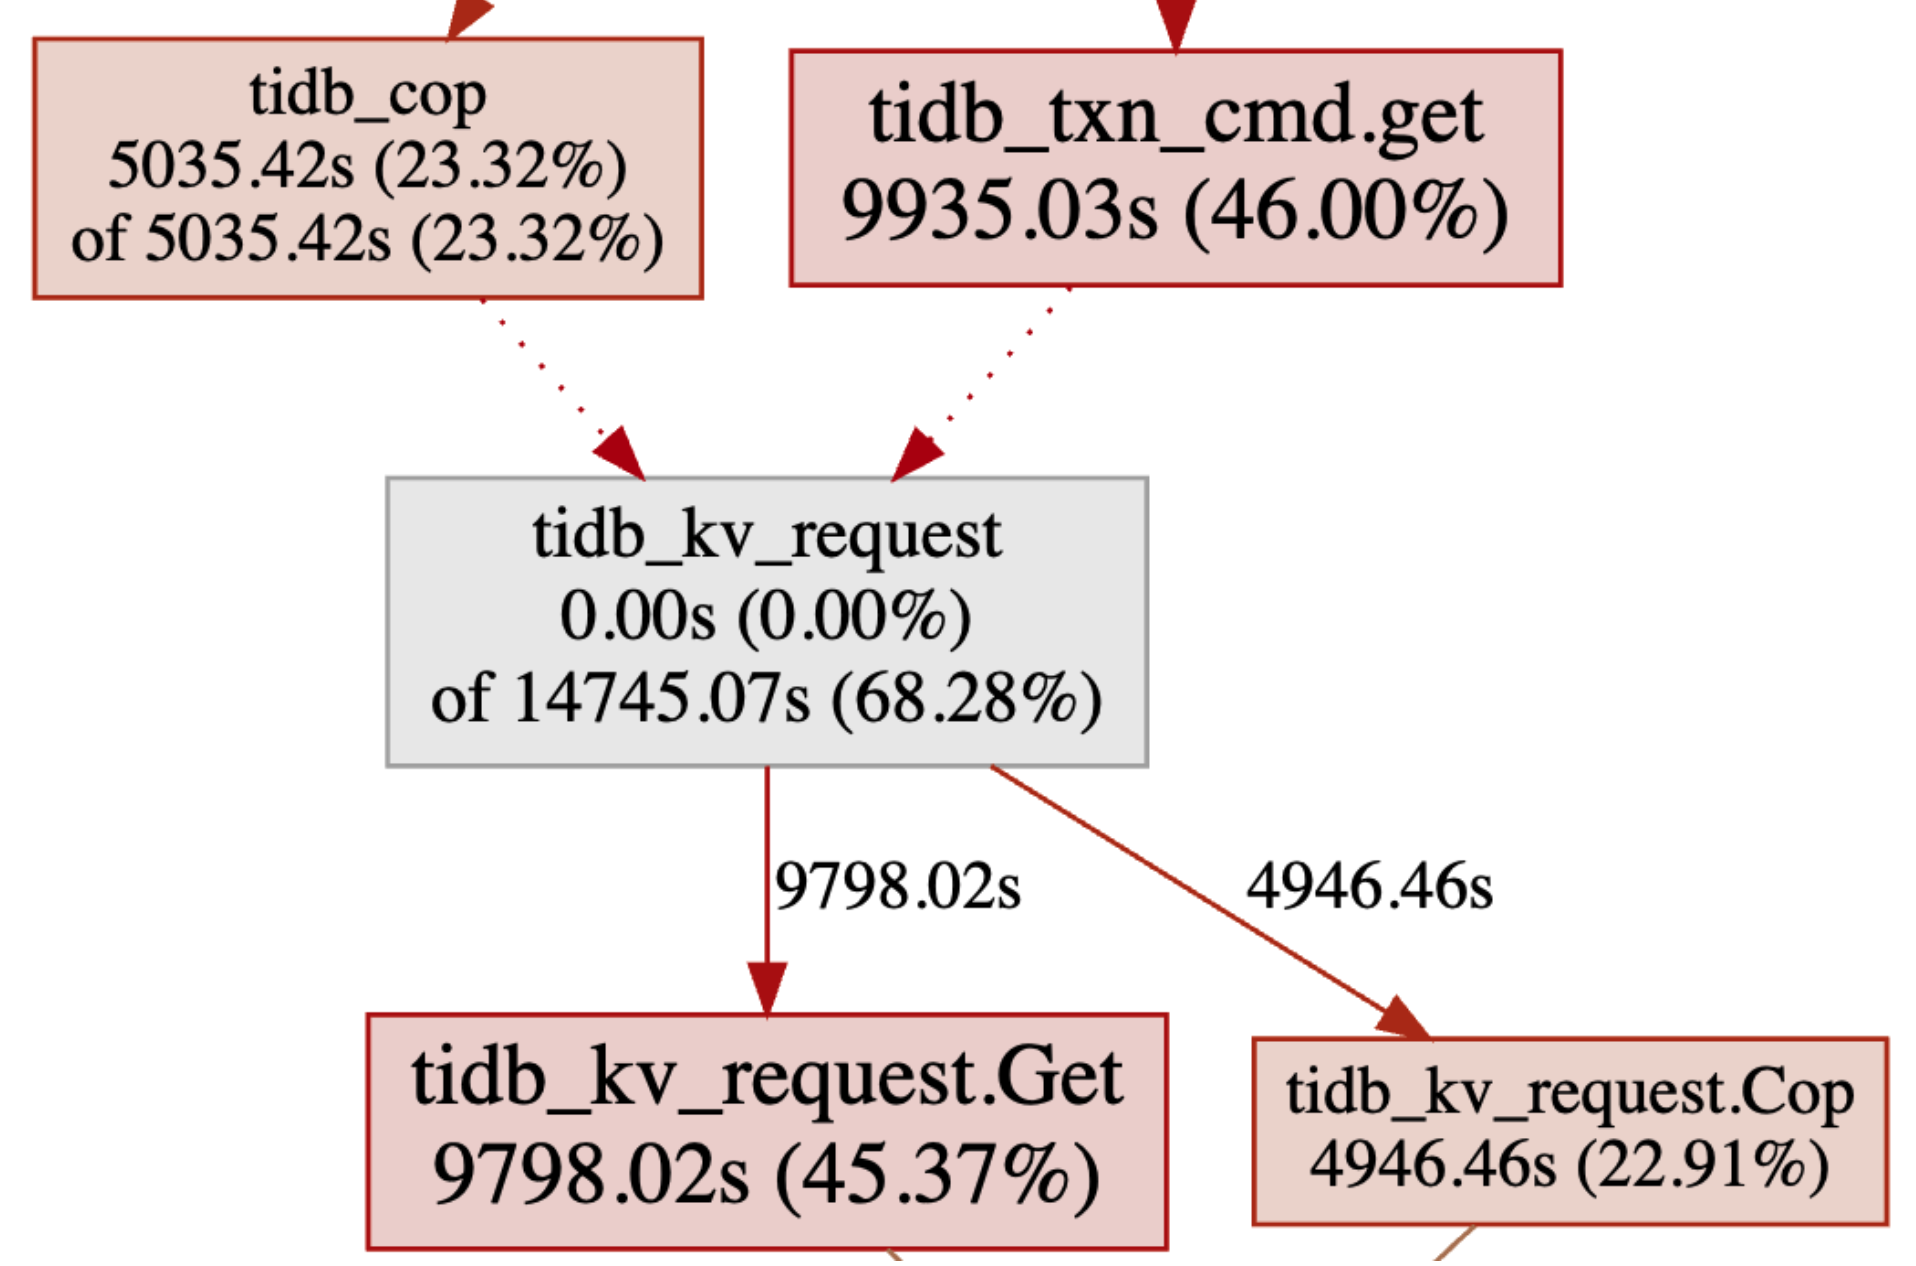
tidb_cop and tidb_txn_cmd.get, the parent nodes of tidb_kv_request, both have dotted arrows pointing to tidb_kv_request, which indicates as follows:
- The duration of
tidb_copincludes a part oftidb_kv_request's duration. - The duration of
tidb_txn_cmd.getalso includes a part oftidb_kv_request's duration.
However, it is hard to determine how much duration of tidb_kv_request is included in tidb_cop.
tidb_kv_request.Get: The duration of TiDB sending theGettype key-value requests.tidb_kv_request.Cop: The duration of TiDB sending theCoptype key-value requests.
tidb_kv_request does not include tidb_kv_request.Get and tidb_kv_request.Cop nodes as its child nodes, but consists of the latter two nodes. The name prefix of the child node is the name of the parent node plus .xxx, which means that the child node is the sub-class of the parent node. You can understand this case in the following way:
The total duration of TiDB sending key-value requests is 14745.07 seconds, during which the key-value requests for the Get and Cop types respectively consume 9798.02 seconds and 4946.46 seconds.