TiDB Dashboard Log Search Page
On the log search page of TiDB Dashboard, you can search logs of all nodes, preview the search result and download logs.
Access the page
After logging into TiDB Dashboard, you can click Search Logs to enter this log search homepage.
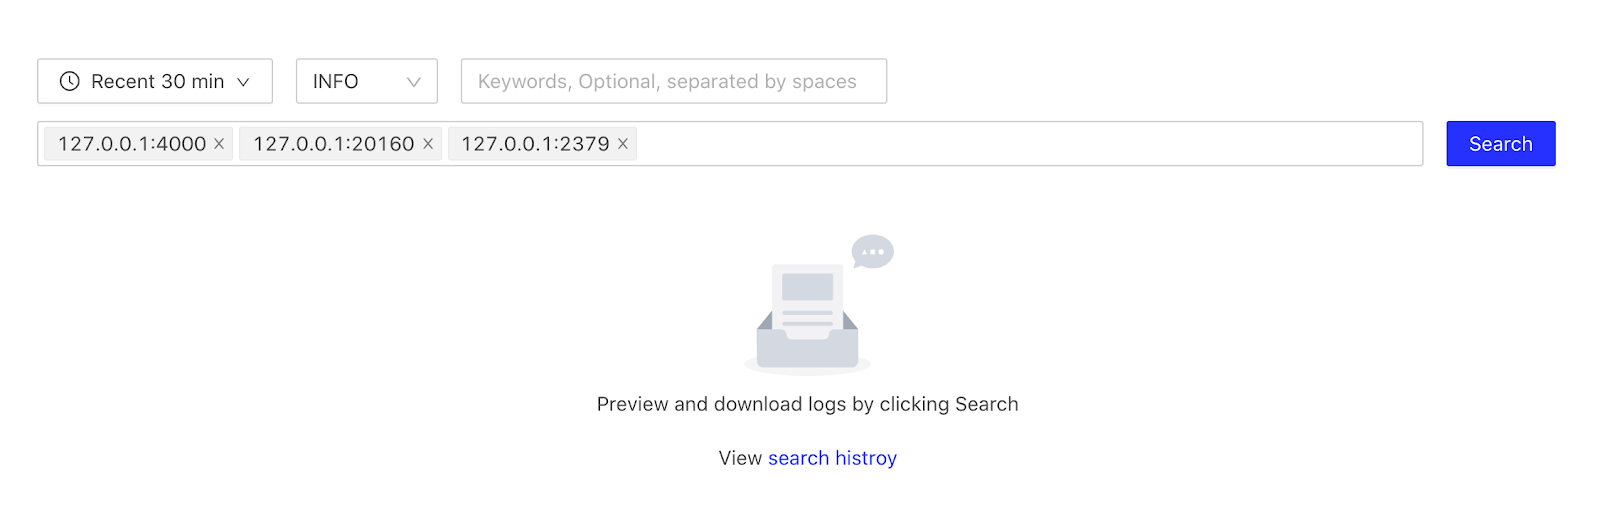
This page provides the following search parameters:
- Time range: Specifies the time range of logs to search. The default value is the recent 30 minutes.
- Log level: Specifies the minimum log level. All logs above this log level are searched. The default value is the
INFO. - Keywords: The parameter is optional and its value can be any legal string. Multiple keywords are separated by a space. Regular expressions are supported (case-insensitive).
- Components: Selects the cluster components to search, which are multi-select and non-empty. By default, all components are selected.
After clicking the Search button, you enter the detail page of the search results.
Page of search result
The following image shows the page of the search results.
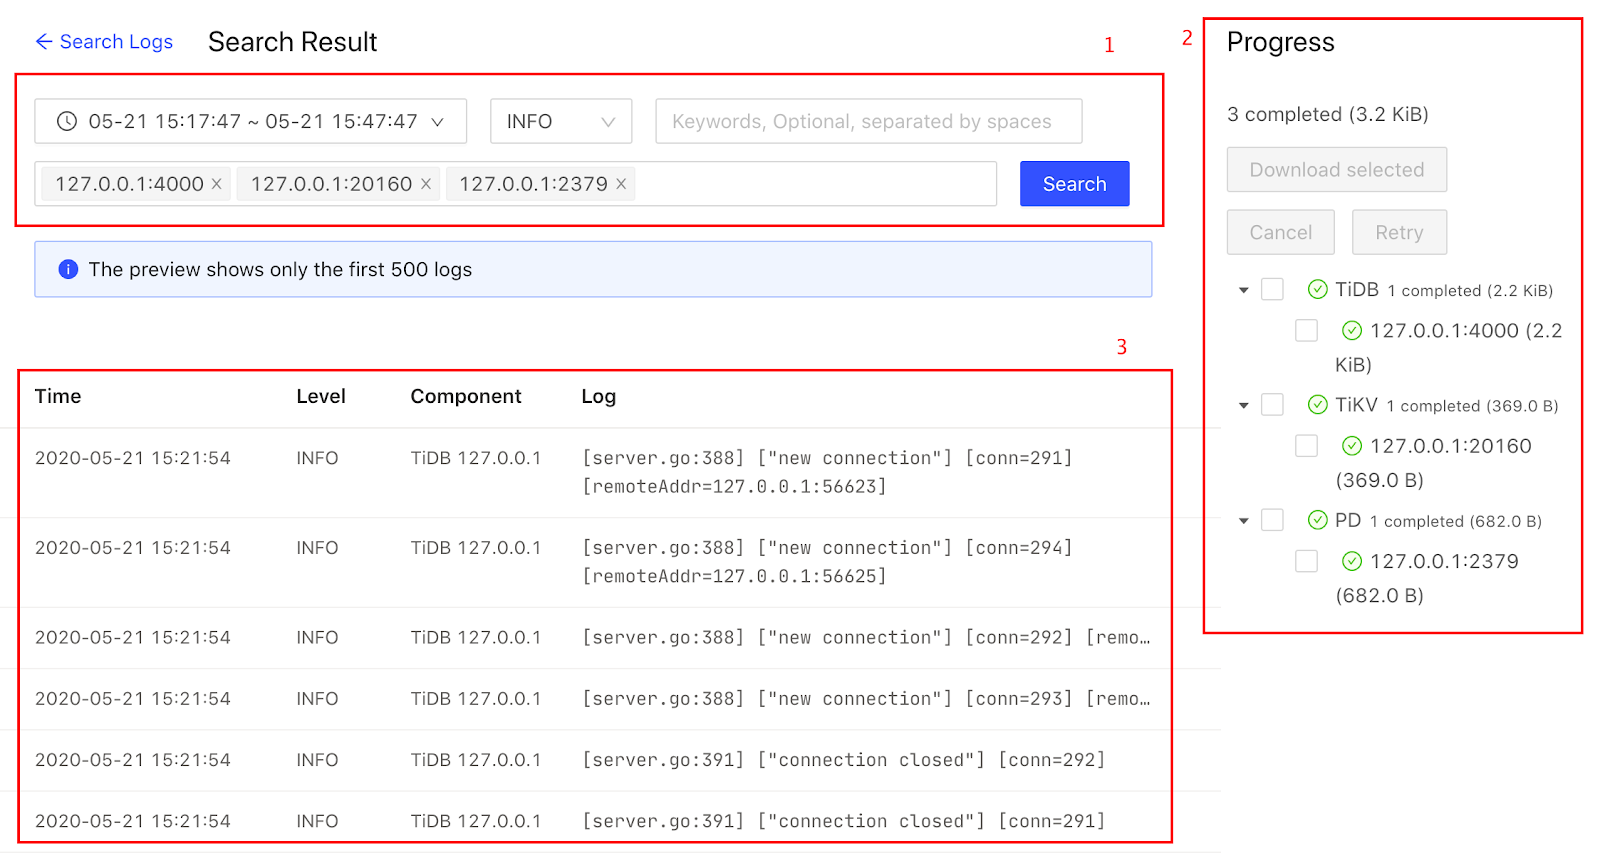
This page consists of the following three areas:
- Parameter options (area 1 in the image above): These options are the same as the parameter options on the search homepage. You can re-select the parameters in the boxes and start a new search.
- Progress (area 2 in the image above): The current search progress is shown on the right side of this page, including the log search status and statistics of each node.
- Search results (area 3 in the image above):
- Time: The time at which the log is generated. The time zone is the same as the time zone of the front-end user.
- Level: log level.
- Component: Shows the component name and its address.
- Log: The body part of each log record, excluding the log time and log level. Logs that are too long are automatically truncated. Click a row to expand the full content. The full log can show up to 512 characters.
Search progress
In the search progress area, a search on a node is called a search task. A search task might have the following statuses:
- Running: After starting the search, all tasks enter the Running status.
- Success: After the task is completed, it automatically enters the Success status. At this time, the logs have been cached in the local disk where the Dashboard backend is located, and can be provided to the frontend to download.
- Failed: When you cancel the search task, or the task exits with an error, the task enters the Failed status. When the task fails, the local temporary files are automatically cleaned.
The search progress area has the following three control buttons:
- Download Selected: Click this button to download logs of the selected components (only the completed ones can be selected), and you will get a tar file. Unzip this tar file to get one or more zip files (each component corresponds to a zip file). Unzip the zip file(s) to get the log text file.
- Cancel: Click this button to cancel all running tasks. You can click this button only when there are running tasks.
- Retry: Click this button to retry all failed tasks. You can click this button only when there are failed tasks and no running tasks.
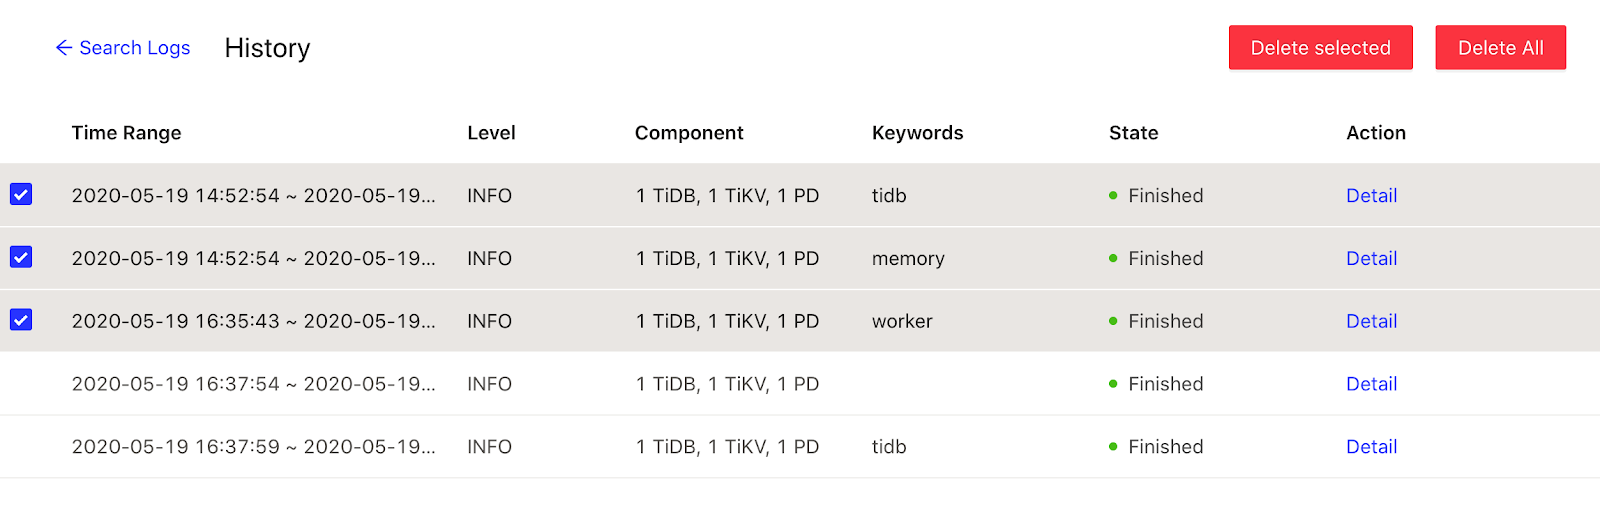
Search history list
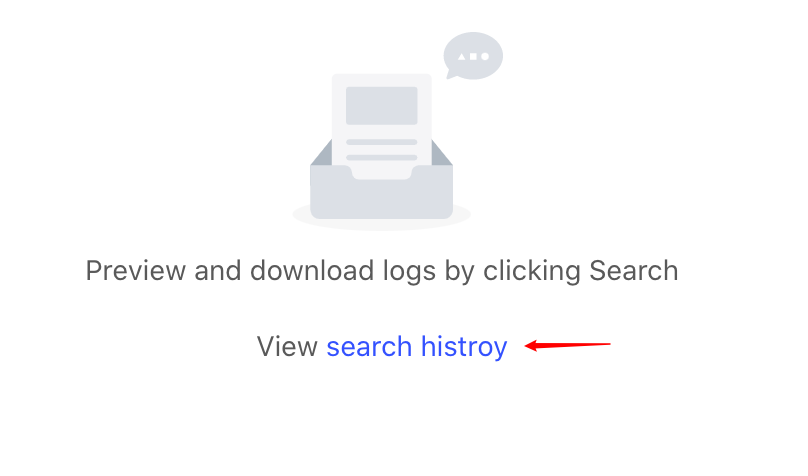
Click the View search history link on the log search homepage to enter page of search history list:
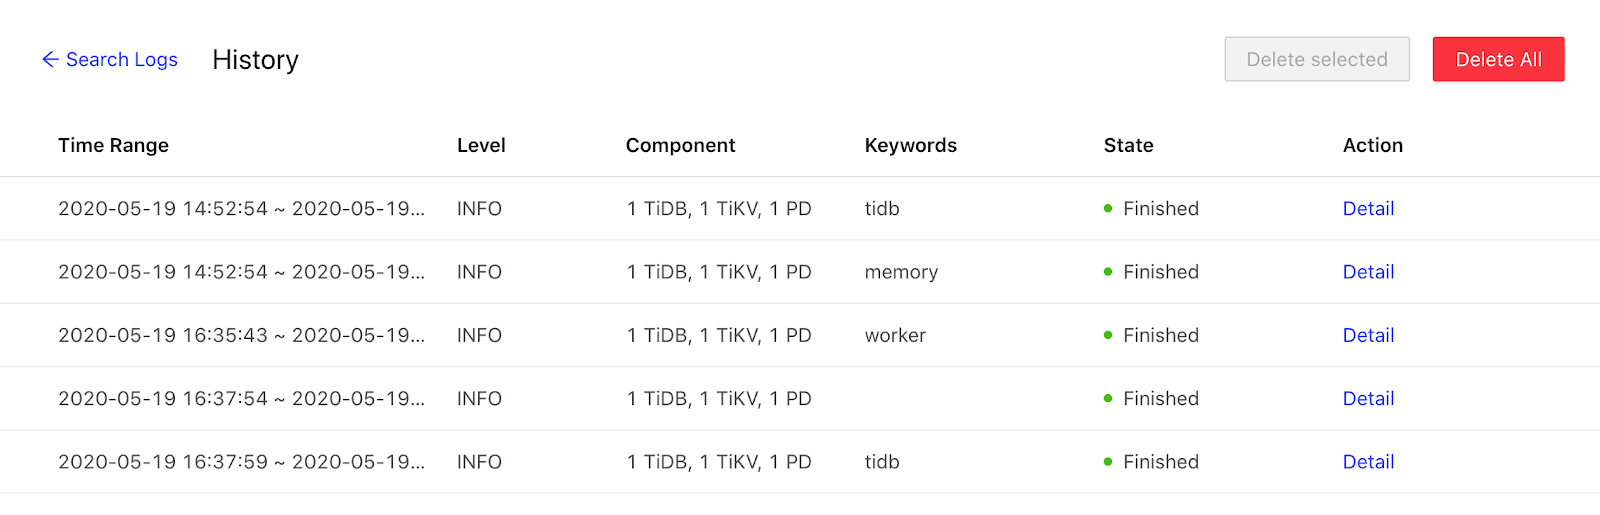
The history list shows the time range, log level, components, keywords, and search status of each search log. Click the Detail link in the Action column to see the search result details:
You can delete the search history that you no longer need. Click Delete All in the upper right corner, or select the rows to be deleted and then click Delete selected to delete the history: