TiDB Dashboard Instance Profiling - Continuous Profiling
Introduced in TiDB 5.3.0, Continuous Profiling is a way to observe resource overhead at the system call level. With the support of Continuous Profiling, TiDB provides performance insight as clear as directly looking into the database source code, and helps R&D and operation and maintenance personnel to locate the root cause of performance problems using a flame graph.
With less than 0.5% performance loss, this feature takes continuous snapshots (similar to CT scan) of the database internal operations, turning the database from a "black box" into a "white box" that is more observable. This feature runs automatically after being enabled by one click and keeps storage results generated within the retention period. Storage results beyond the retention period are recycled to release the storage space.
Restrictions
Before enabling the Continuous Profiling feature, pay attention to the following restrictions:
Under the x86 architecture, this feature supports TiDB, PD, TiKV, and TiFlash. This feature is not fully compatible with the ARM architecture and cannot be enabled under this architecture.
This feature is available for clusters deployed or upgraded using TiUP of v1.9.0 or later or TiDB Operator of v1.3.0 or later. This feature is unavailable for clusters deployed or upgraded by using binary packages.
Profiling content
With Continuous Profiling, you can collect continuous performance data of TiDB, PD, TiKV, and TiFlash instances, and have the nodes monitored day and night without restarting any of them. The data collected can be displayed in forms such as a flame graph or a directed acyclic graph. The data displayed visually shows what internal operations are performed on the instances during the performance profiling period and the corresponding proportions. With such data, you can quickly learn the CPU resource consumption of these instances.
Currently, Continuous Profiling can display the following performance data:
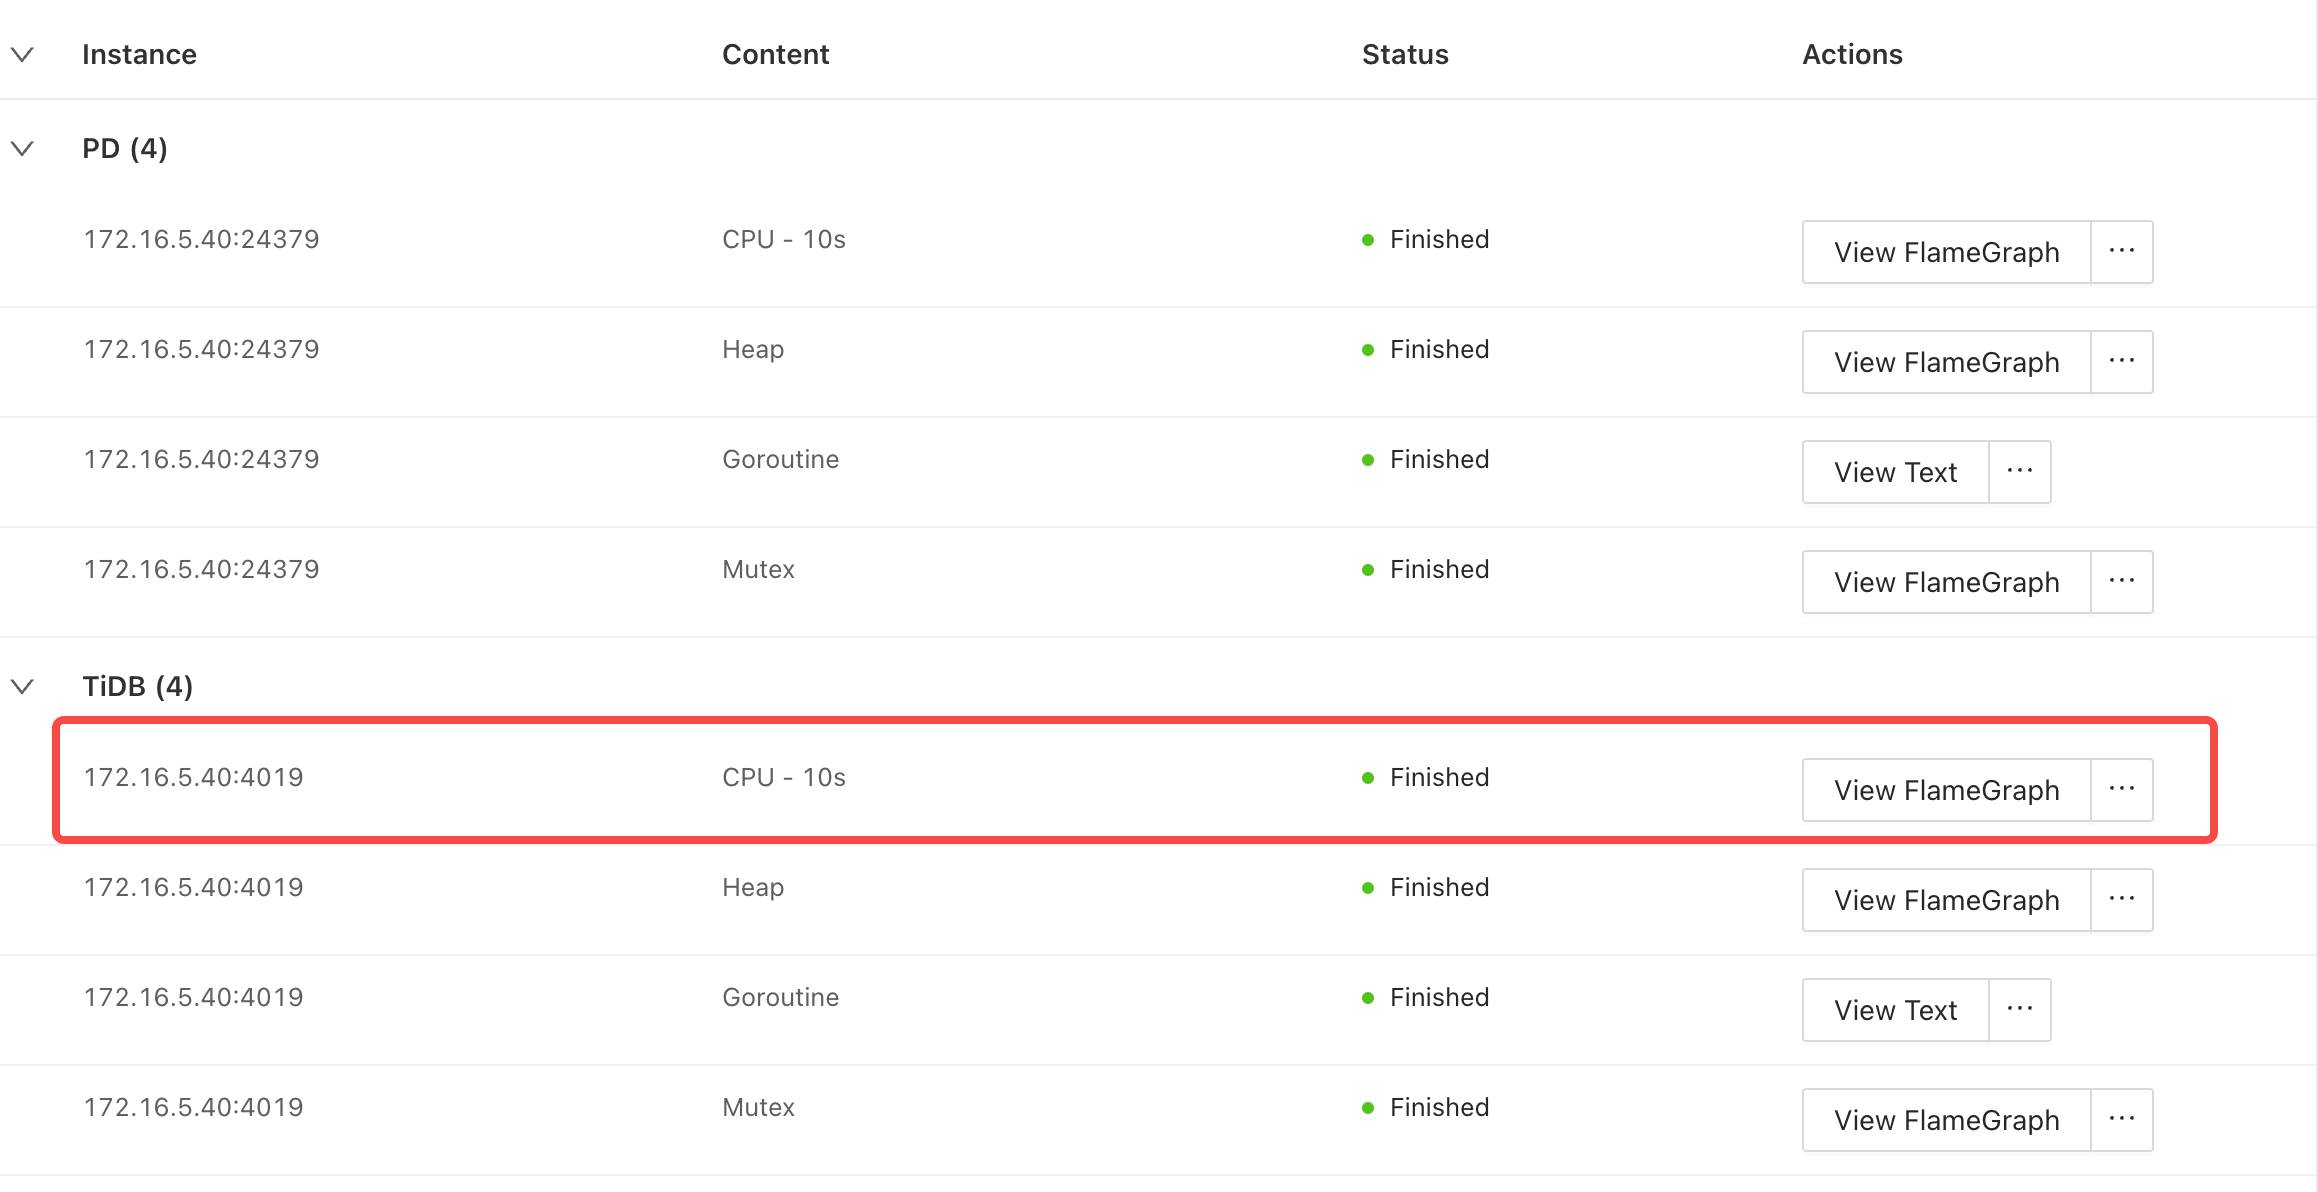
- TiDB/PD: CPU profile, Heap, Mutex, Goroutine (debug=2)
- TiKV/TiFlash: CPU profile
Enable Continuous Profiling
This section describes how to enable Continuous Profiling on TiDB clusters deployed using TiUP and TiDB Operator respectively.
Clusters deployed using TiUP
To enable Continuous Profiling on clusters deployed using TiUP, perform the following steps:
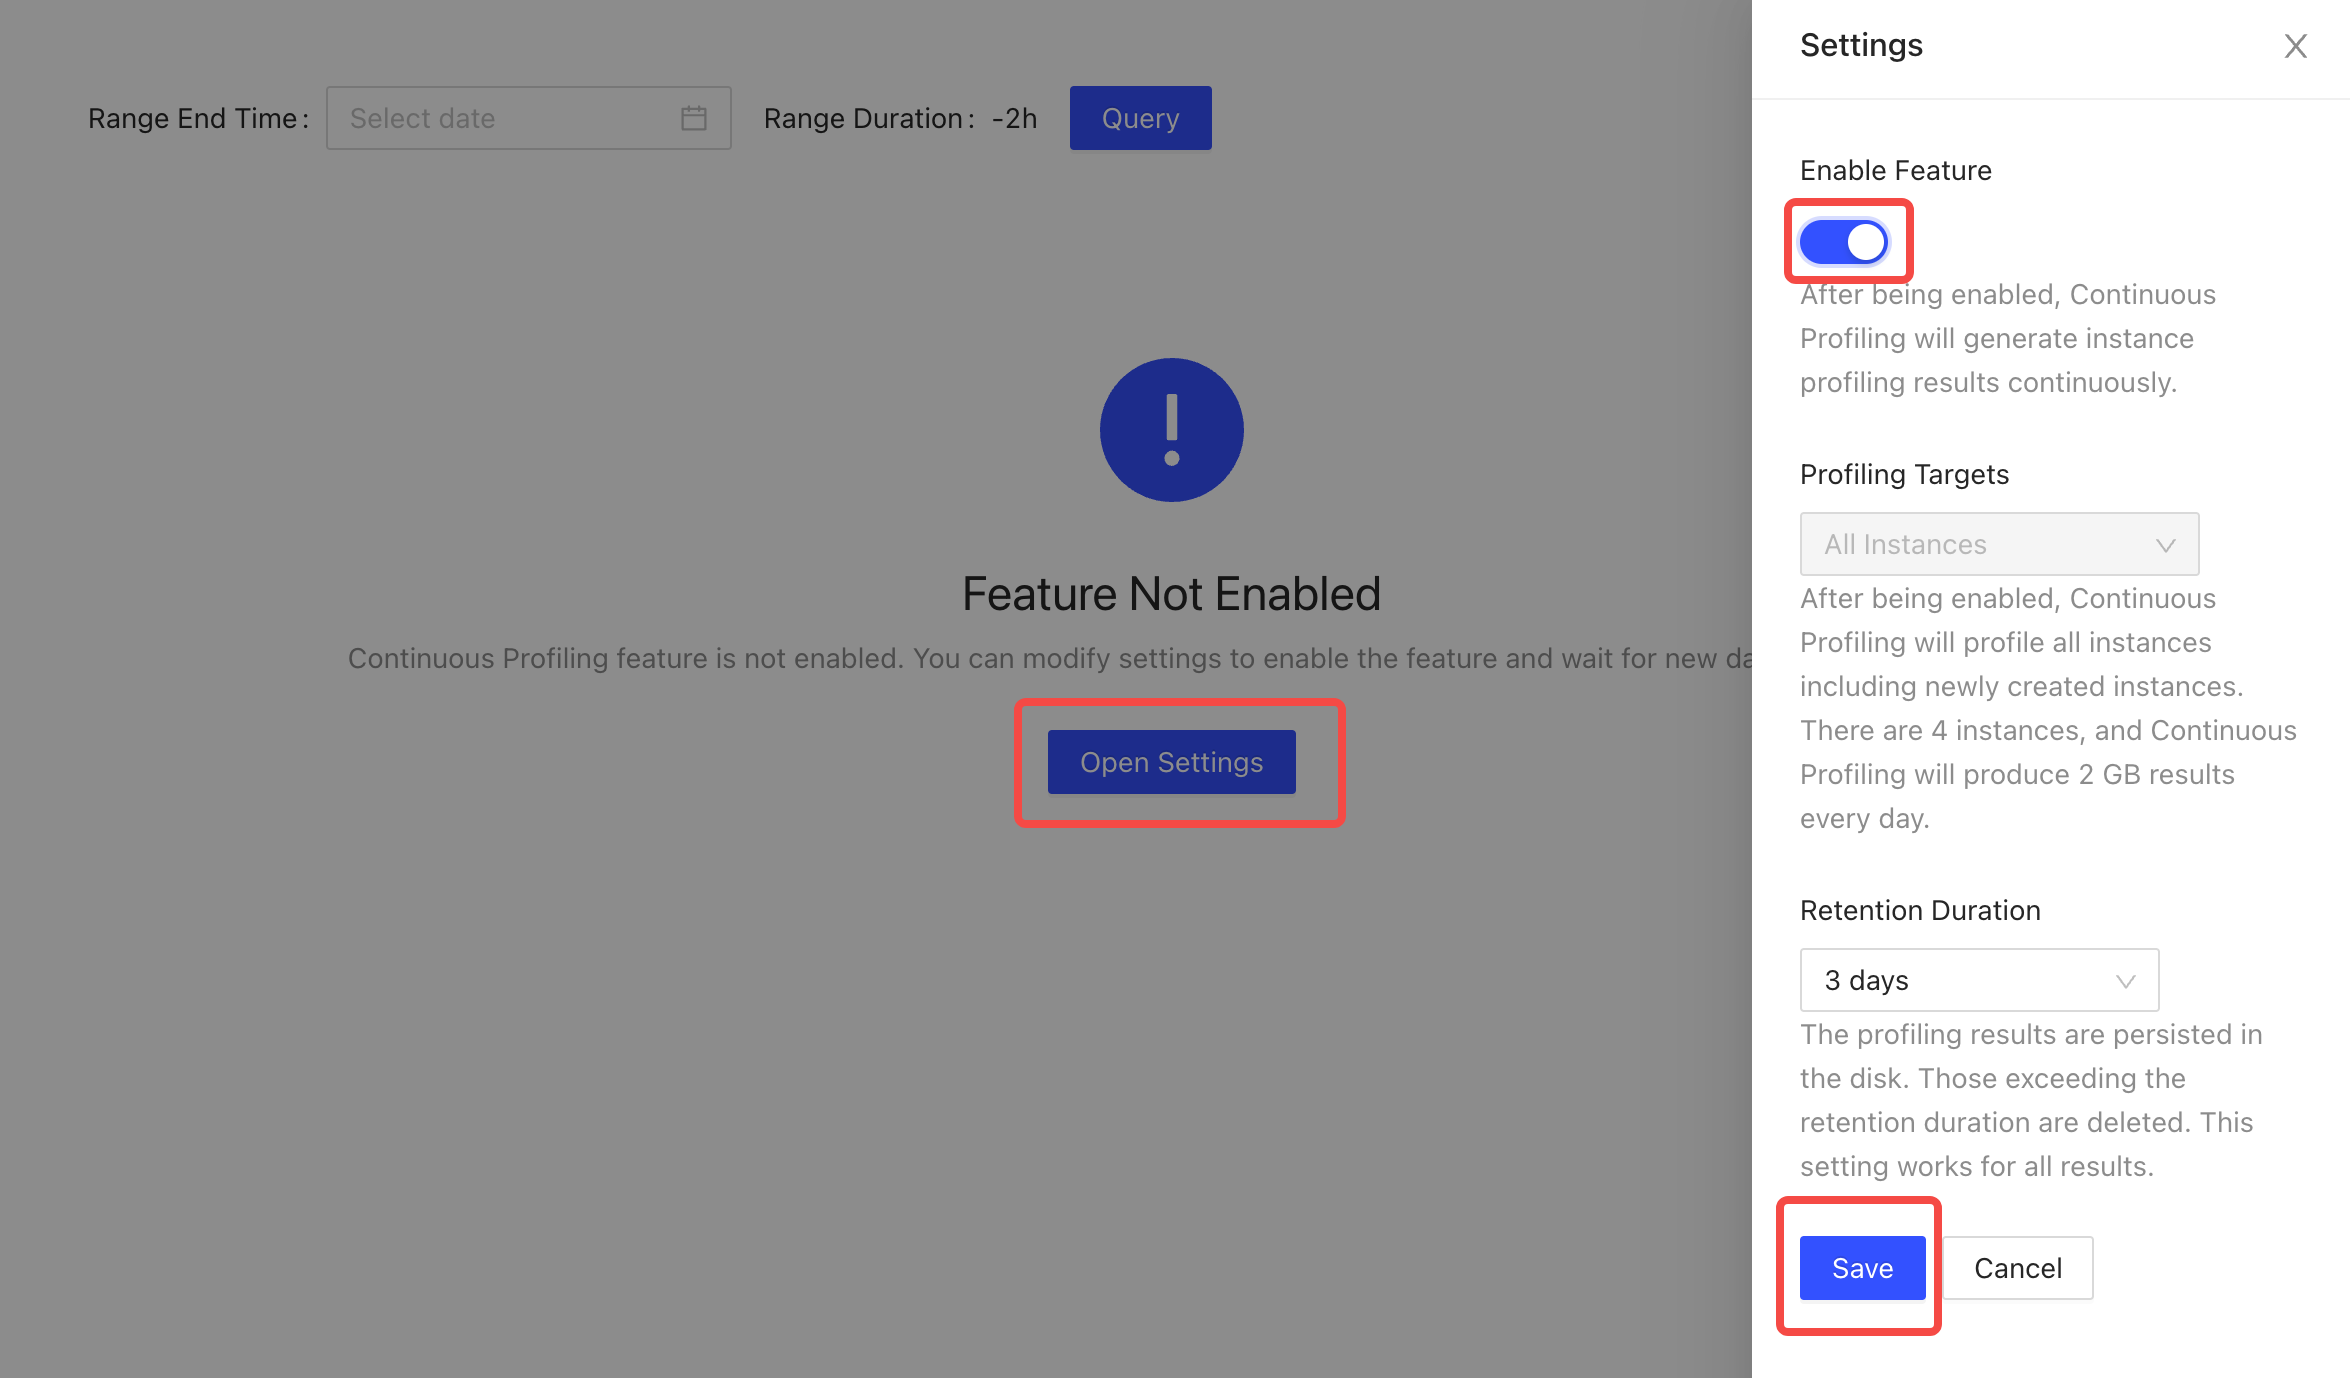
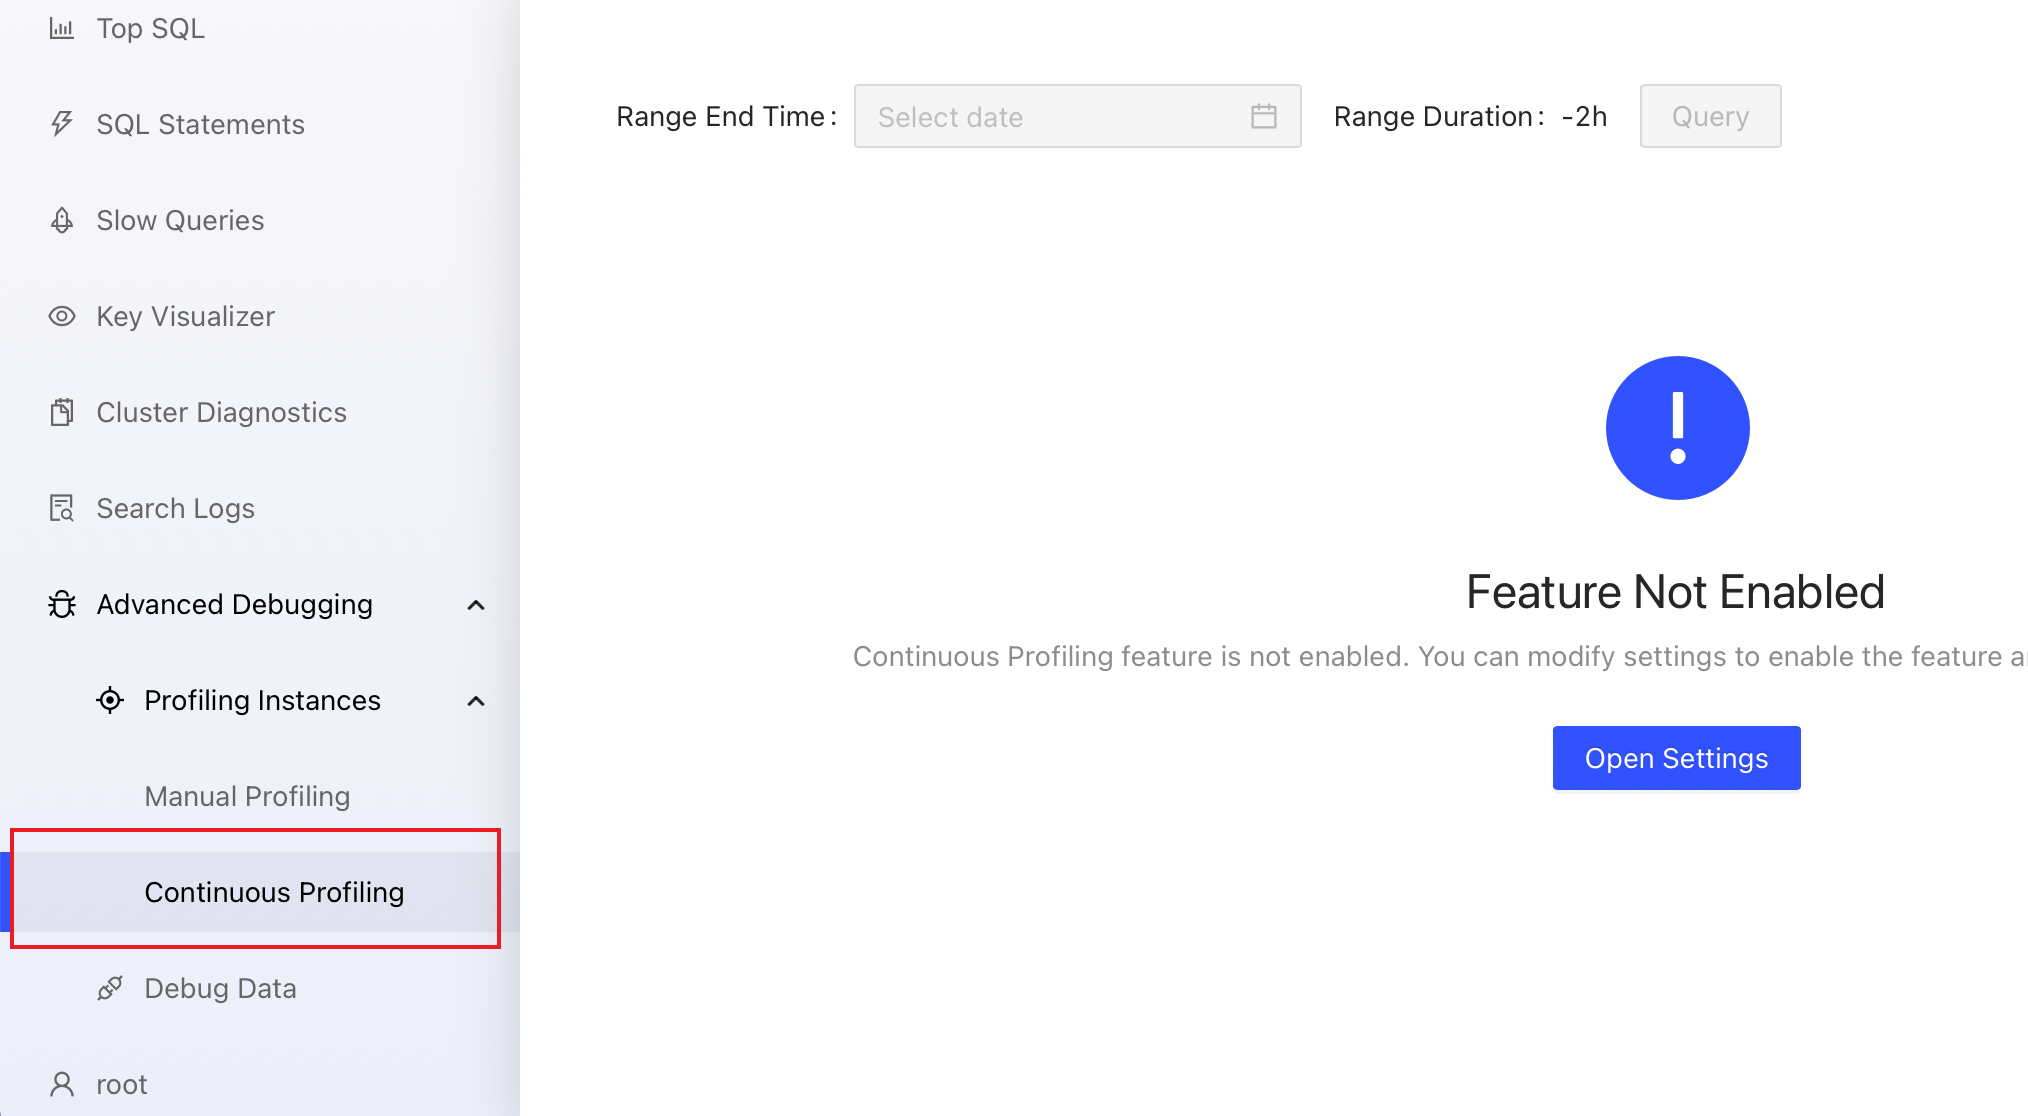
On TiDB Dashboard, click Advanced Debugging > Profiling Instances > Continuous Profiling.
In the displayed window, click Open Settings. In the Settings area on the right, switch Enable Feature on, and modify the default value of Retention Duration if necessary.
Click Save to enable this feature.
Clusters deployed using TiDB Operator
See Enable continuous profiling.
Access the page
You can access the continuous profiling page using either of the following methods:
After logging into TiDB Dashboard, click Advanced Debugging > Profiling Instances > Continuous Profiling on the left navigation bar.
Visit http://127.0.0.1:2379/dashboard/#/continuous_profiling via your browser. Replace
127.0.0.1:2379with the actual PD instance address and port.
View profiling history
After starting continuous profiling, you can view the profiling result on the instance profiling page.
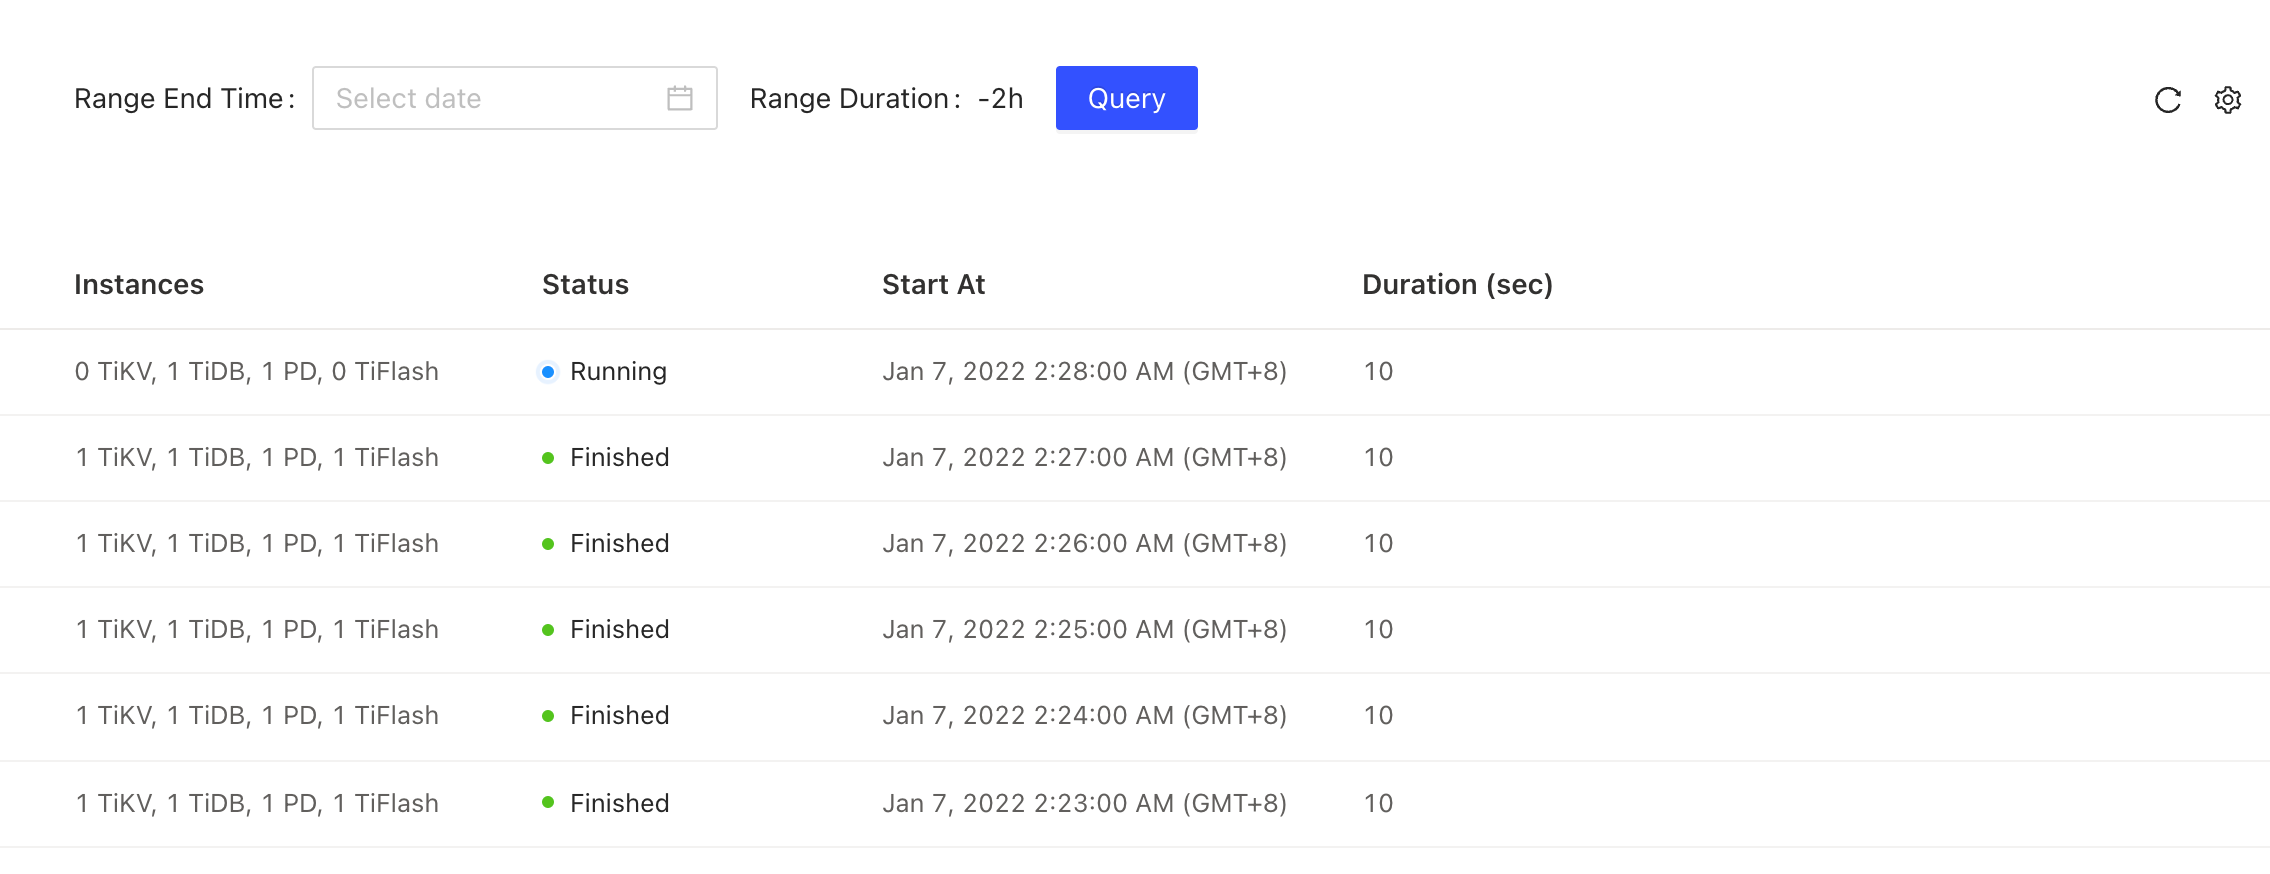
Performance profiling runs in the background. Refreshing or exiting the current page will not terminate a running performance profiling task.
Download profiling result
On the profiling result page, you can click Download Profiling Result in the upper-right corner to download all profiling results.
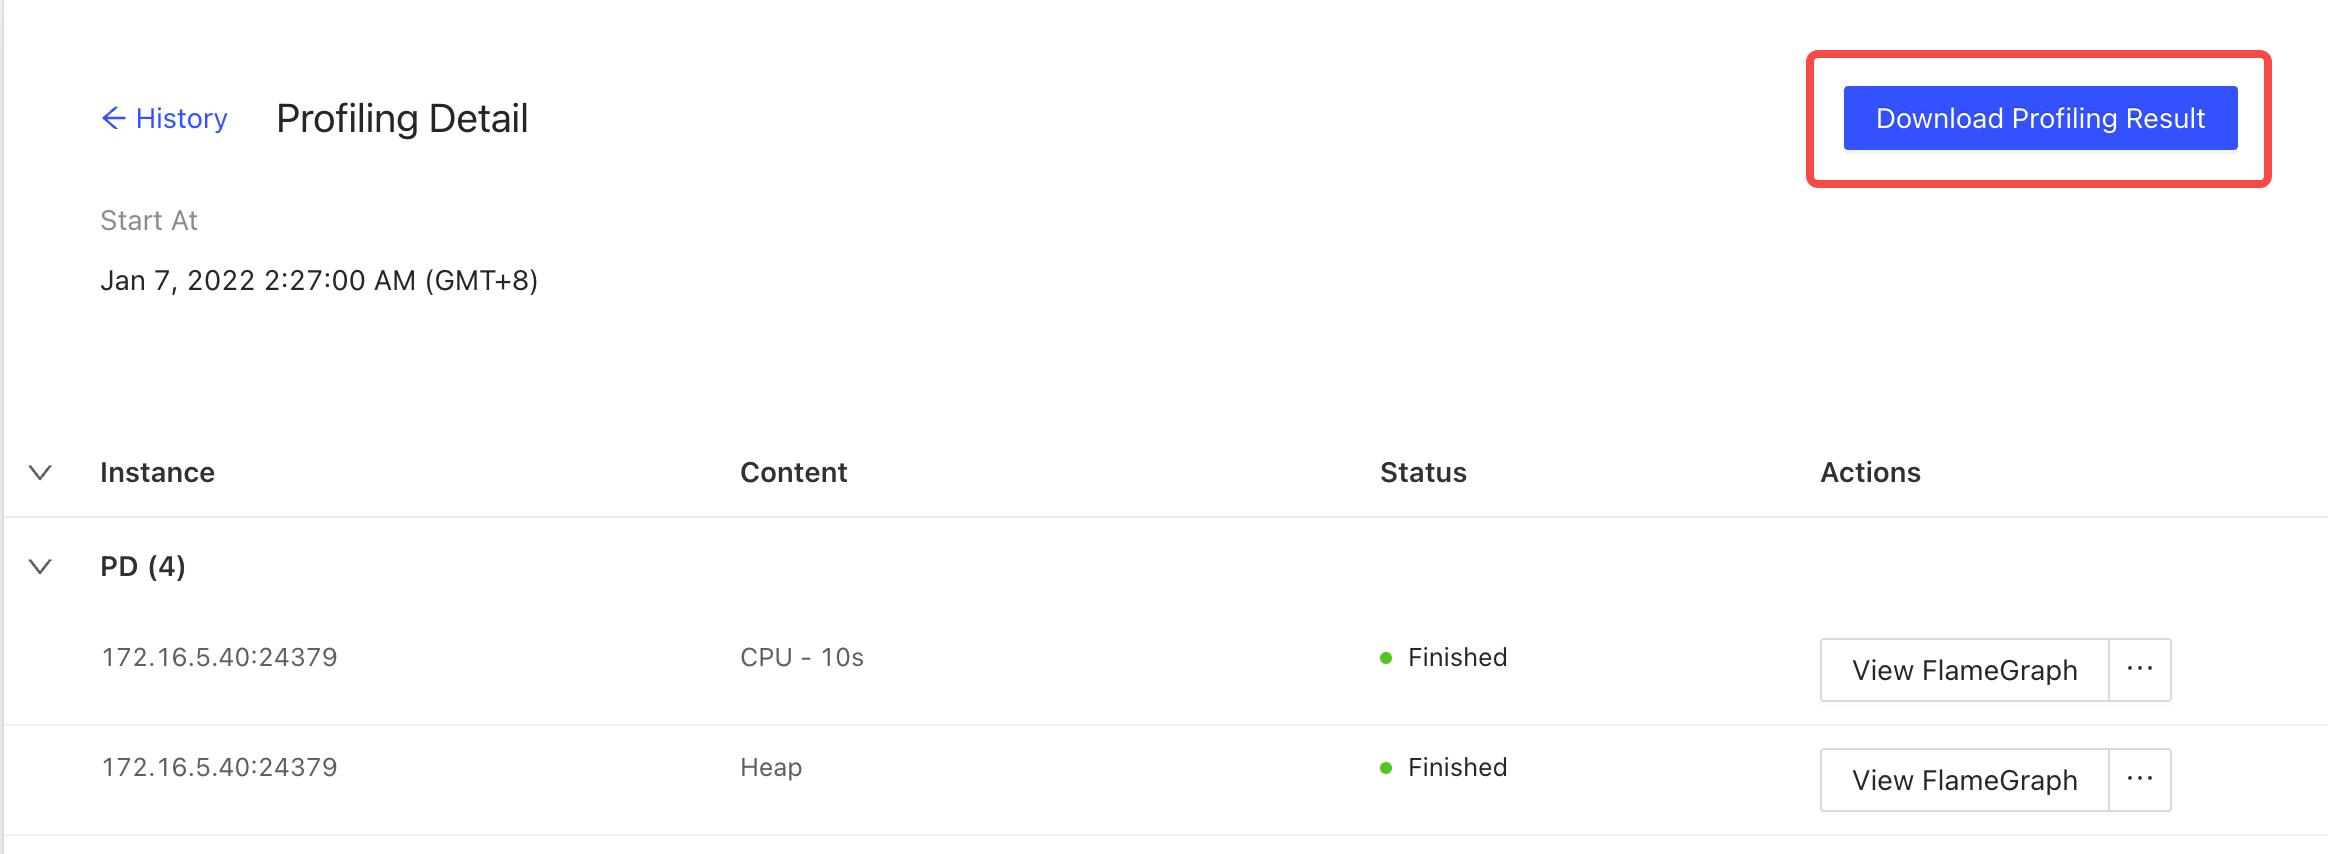
You can also click an individual instance in the table to view its profiling result (including flame charts, directed acyclic graphs, and texts). Alternatively, you can hover on ... to download raw data.
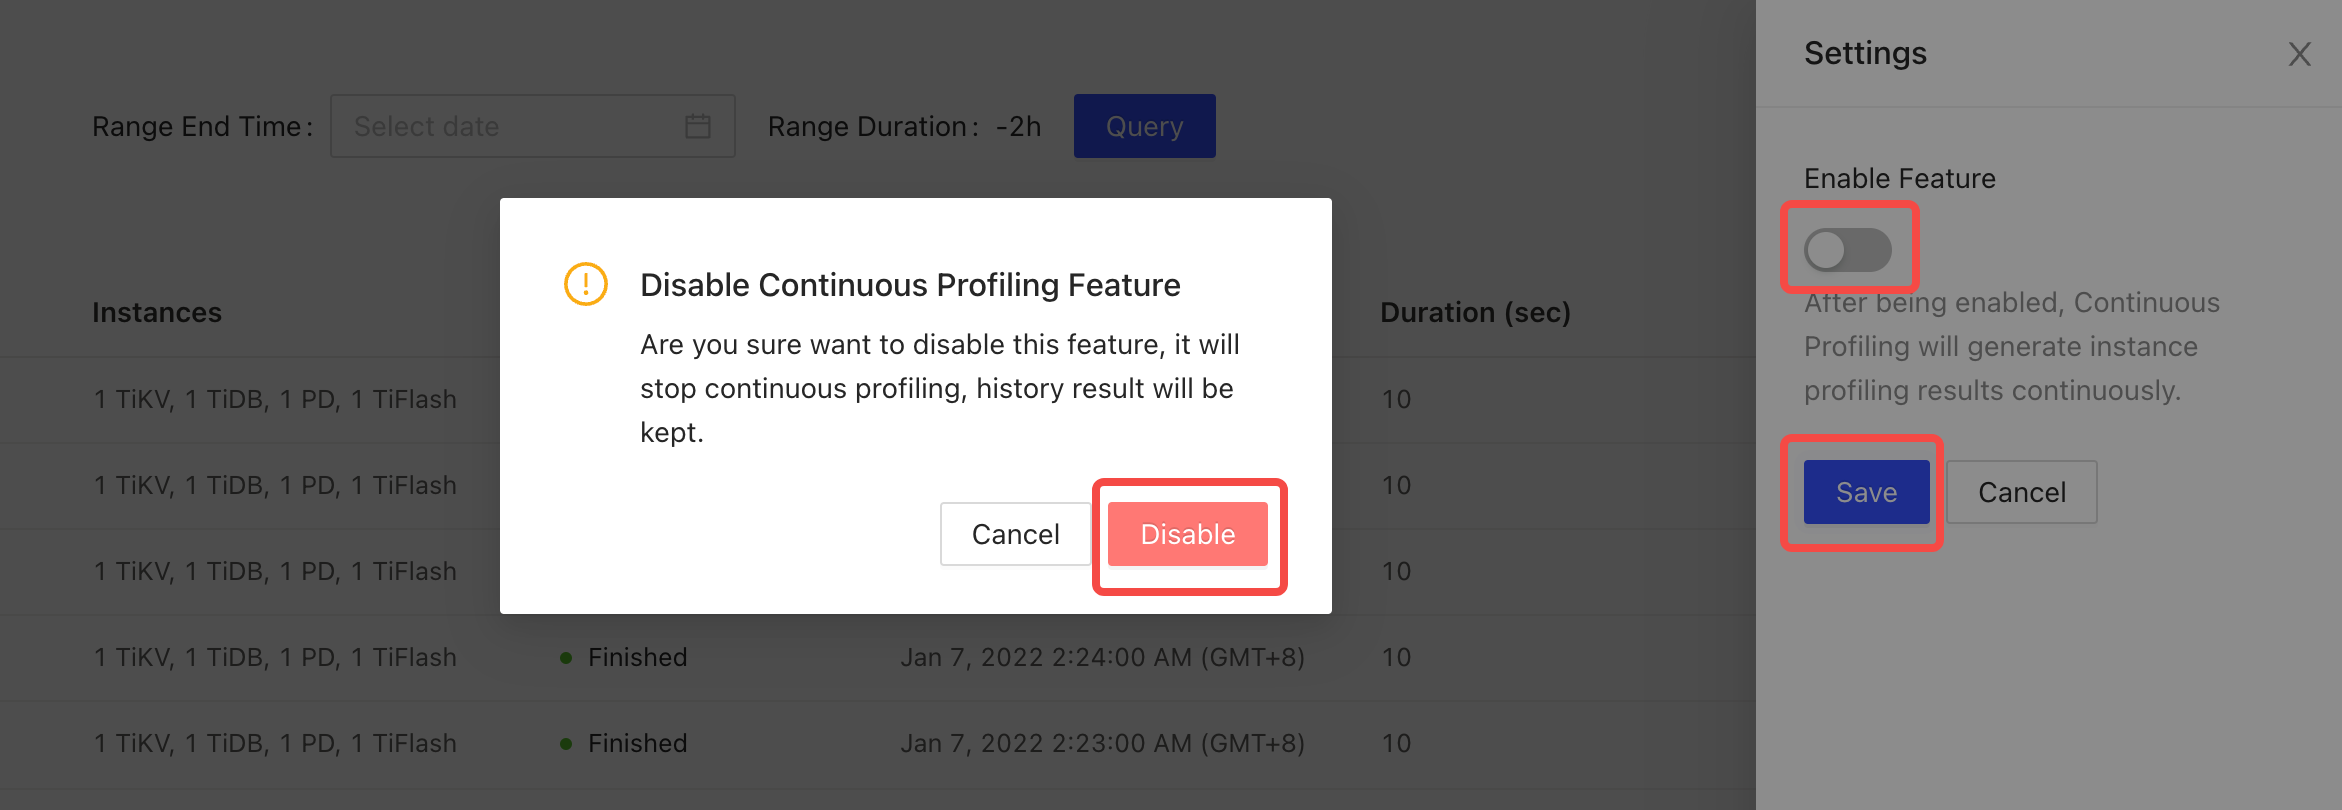
Disable Continuous Profiling
On TiDB Dashboard, click Advanced Debugging > Profiling Instances > Continuous Profiling on the left navigation bar. Click Settings.
In the popped-up window, switch off the button under Enable Feature.
In the dialog box of Disable Continuous Profiling Feature, click Disable.
Click Save.
In the popped-up window, click Disable.