- About TiDB
- Quick Start
- Deploy
- Software and Hardware Requirements
- Environment Configuration Checklist
- Plan Cluster Topology
- Install and Start
- Verify Cluster Status
- Test Cluster Performance
- Migrate
- Overview
- Migrate from MySQL
- Migrate from CSV Files
- Migrate from SQL Files
- Replicate Incremental Data between TiDB Clusters in Real Time
- Maintain
- Upgrade
- Scale
- Backup and Restore
- Use BR Tool (Recommended)
- Configure Time Zone
- Daily Checklist
- Maintain TiFlash
- Maintain TiDB Using TiUP
- Modify Configuration Online
- Monitor and Alert
- Troubleshoot
- TiDB Troubleshooting Map
- Identify Slow Queries
- Analyze Slow Queries
- SQL Diagnostics
- Identify Expensive Queries
- Statement Summary Tables
- Troubleshoot Hotspot Issues
- Troubleshoot Increased Read and Write Latency
- Troubleshoot Cluster Setup
- Troubleshoot High Disk I/O Usage
- Troubleshoot Lock Conflicts
- Troubleshoot TiFlash
- Troubleshoot Write Conflicts in Optimistic Transactions
- Performance Tuning
- System Tuning
- Software Tuning
- SQL Tuning
- Overview
- Understanding the Query Execution Plan
- SQL Optimization Process
- Overview
- Logic Optimization
- Physical Optimization
- Prepare Execution Plan Cache
- Control Execution Plans
- Tutorials
- Multiple Data Centers in One City Deployment
- Three Data Centers in Two Cities Deployment
- Two Data Centers in One City Deployment
- Read Historical Data
- Use Stale Read (Recommended)
- Use the
tidb_snapshot
System Variable
- Best Practices
- Use Placement Rules
- Use Load Base Split
- Use Store Limit
- TiDB Tools
- Overview
- Use Cases
- Download
- TiUP
- TiDB Operator
- Backup & Restore (BR)
- TiDB Binlog
- TiDB Lightning
- TiDB Data Migration
- TiCDC
- Dumpling
- sync-diff-inspector
- TiSpark
- Reference
- Cluster Architecture
- Key Monitoring Metrics
- Secure
- Privileges
- SQL
- SQL Language Structure and Syntax
- SQL Statements
ADD COLUMN
ADD INDEX
ADMIN
ADMIN CANCEL DDL
ADMIN CHECKSUM TABLE
ADMIN CHECK [TABLE|INDEX]
ADMIN SHOW DDL [JOBS|QUERIES]
ALTER DATABASE
ALTER INDEX
ALTER INSTANCE
ALTER TABLE
ALTER USER
ANALYZE TABLE
BACKUP
BEGIN
CHANGE COLUMN
COMMIT
CHANGE DRAINER
CHANGE PUMP
CREATE [GLOBAL|SESSION] BINDING
CREATE DATABASE
CREATE INDEX
CREATE ROLE
CREATE SEQUENCE
CREATE TABLE LIKE
CREATE TABLE
CREATE USER
CREATE VIEW
DEALLOCATE
DELETE
DESC
DESCRIBE
DO
DROP [GLOBAL|SESSION] BINDING
DROP COLUMN
DROP DATABASE
DROP INDEX
DROP ROLE
DROP SEQUENCE
DROP STATS
DROP TABLE
DROP USER
DROP VIEW
EXECUTE
EXPLAIN ANALYZE
EXPLAIN
FLASHBACK TABLE
FLUSH PRIVILEGES
FLUSH STATUS
FLUSH TABLES
GRANT <privileges>
GRANT <role>
INSERT
KILL [TIDB]
LOAD DATA
LOAD STATS
MODIFY COLUMN
PREPARE
RECOVER TABLE
RENAME INDEX
RENAME TABLE
REPLACE
RESTORE
REVOKE <privileges>
REVOKE <role>
ROLLBACK
SELECT
SET DEFAULT ROLE
SET [NAMES|CHARACTER SET]
SET PASSWORD
SET ROLE
SET TRANSACTION
SET [GLOBAL|SESSION] <variable>
SHOW ANALYZE STATUS
SHOW [BACKUPS|RESTORES]
SHOW [GLOBAL|SESSION] BINDINGS
SHOW BUILTINS
SHOW CHARACTER SET
SHOW COLLATION
SHOW [FULL] COLUMNS FROM
SHOW CONFIG
SHOW CREATE SEQUENCE
SHOW CREATE TABLE
SHOW CREATE USER
SHOW DATABASES
SHOW DRAINER STATUS
SHOW ENGINES
SHOW ERRORS
SHOW [FULL] FIELDS FROM
SHOW GRANTS
SHOW INDEX [FROM|IN]
SHOW INDEXES [FROM|IN]
SHOW KEYS [FROM|IN]
SHOW MASTER STATUS
SHOW PLUGINS
SHOW PRIVILEGES
SHOW [FULL] PROCESSSLIST
SHOW PROFILES
SHOW PUMP STATUS
SHOW SCHEMAS
SHOW STATS_HEALTHY
SHOW STATS_HISTOGRAMS
SHOW STATS_META
SHOW STATUS
SHOW TABLE NEXT_ROW_ID
SHOW TABLE REGIONS
SHOW TABLE STATUS
SHOW [FULL] TABLES
SHOW [GLOBAL|SESSION] VARIABLES
SHOW WARNINGS
SHUTDOWN
SPLIT REGION
START TRANSACTION
TABLE
TRACE
TRUNCATE
UPDATE
USE
WITH
- Data Types
- Functions and Operators
- Overview
- Type Conversion in Expression Evaluation
- Operators
- Control Flow Functions
- String Functions
- Numeric Functions and Operators
- Date and Time Functions
- Bit Functions and Operators
- Cast Functions and Operators
- Encryption and Compression Functions
- Information Functions
- JSON Functions
- Aggregate (GROUP BY) Functions
- Window Functions
- Miscellaneous Functions
- Precision Math
- Set Operations
- List of Expressions for Pushdown
- TiDB Specific Functions
- Clustered Indexes
- Constraints
- Generated Columns
- SQL Mode
- Transactions
- Garbage Collection (GC)
- Views
- Partitioning
- Character Set and Collation
- System Tables
mysql
- INFORMATION_SCHEMA
- Overview
ANALYZE_STATUS
CLIENT_ERRORS_SUMMARY_BY_HOST
CLIENT_ERRORS_SUMMARY_BY_USER
CLIENT_ERRORS_SUMMARY_GLOBAL
CHARACTER_SETS
CLUSTER_CONFIG
CLUSTER_HARDWARE
CLUSTER_INFO
CLUSTER_LOAD
CLUSTER_LOG
CLUSTER_SYSTEMINFO
COLLATIONS
COLLATION_CHARACTER_SET_APPLICABILITY
COLUMNS
DATA_LOCK_WAITS
DDL_JOBS
DEADLOCKS
ENGINES
INSPECTION_RESULT
INSPECTION_RULES
INSPECTION_SUMMARY
KEY_COLUMN_USAGE
METRICS_SUMMARY
METRICS_TABLES
PARTITIONS
PROCESSLIST
SCHEMATA
SEQUENCES
SESSION_VARIABLES
SLOW_QUERY
STATISTICS
TABLES
TABLE_CONSTRAINTS
TABLE_STORAGE_STATS
TIDB_HOT_REGIONS
TIDB_INDEXES
TIDB_SERVERS_INFO
TIDB_TRX
TIFLASH_REPLICA
TIKV_REGION_PEERS
TIKV_REGION_STATUS
TIKV_STORE_STATUS
USER_PRIVILEGES
VIEWS
METRICS_SCHEMA
- UI
- TiDB Dashboard
- Overview
- Maintain
- Access
- Overview Page
- Cluster Info Page
- Key Visualizer Page
- Metrics Relation Graph
- SQL Statements Analysis
- Slow Queries Page
- Cluster Diagnostics
- Search Logs Page
- Profile Instances Page
- Session Management and Configuration
- FAQ
- CLI
- Command Line Flags
- Configuration File Parameters
- System Variables
- Storage Engines
- Telemetry
- Errors Codes
- Table Filter
- Schedule Replicas by Topology Labels
- FAQs
- Release Notes
- All Releases
- Release Timeline
- v5.2
- v5.1
- v5.0
- v4.0
- v3.1
- v3.0
- v2.1
- v2.0
- v1.0
- Glossary
TiDB TPC-H Performance Test Report -- v4.0 vs. v3.0
Test purpose
This test aims to compare the TPC-H performance of TiDB 4.0 and TiDB 3.0 in the online analytical processing (OLAP) scenario.
Because TiFlash is introduced in TiDB v4.0, which enhances TiDB's Hybrid Transactional and Analytical Processing (HTAP) capabilities, test objects in this report are as follows:
- TiDB v3.0 that reads data only from TiKV.
- TiDB v4.0 that reads data only from TiKV.
- TiDB v4.0 that reads data from TiKV and TiFlash automatically based on intelligent choice.
Test environment (AWS EC2)
Hardware configuration
Service type | EC2 type | Instance count |
---|---|---|
PD | m5.xlarge | 3 |
TiDB | c5.4xlarge | 2 |
TiKV & TiFlash | i3.4xlarge | 3 |
TPC-H | m5.xlarge | 1 |
Software version
Service type | Software version |
---|---|
PD | 3.0 and 4.0 |
TiDB | 3.0 and 4.0 |
TiKV | 3.0 and 4.0 |
TiFlash | 4.0 |
tiup-bench | 0.2 |
Parameter configuration
v3.0
For v3.0, TiDB, TiKV, and PD use the default parameter configuration.
Variable configuration
set global tidb_distsql_scan_concurrency = 30;
set global tidb_projection_concurrency = 16;
set global tidb_hashagg_partial_concurrency = 16;
set global tidb_hashagg_final_concurrency = 16;
set global tidb_hash_join_concurrency = 16;
set global tidb_index_lookup_concurrency = 16;
set global tidb_index_lookup_join_concurrency = 16;
v4.0
For v4.0, TiDB uses the default parameter configuration.
TiKV configuration
readpool.storage.use-unified-pool: false
readpool.coprocessor.use-unified-pool: true
PD configuration
replication.enable-placement-rules: true
TiFlash configuration
logger.level: "info"
learner_config.log-level: "info"
Variable configuration
There might be session variable(s). It is recommended that all queries are executed in the current session.
set global tidb_allow_batch_cop = 1;
set session tidb_opt_distinct_agg_push_down = 1;
set global tidb_distsql_scan_concurrency = 30;
set global tidb_projection_concurrency = 16;
set global tidb_hashagg_partial_concurrency = 16;
set global tidb_hashagg_final_concurrency = 16;
set global tidb_hash_join_concurrency = 16;
set global tidb_index_lookup_concurrency = 16;
set global tidb_index_lookup_join_concurrency = 16;
Test plan
Hardware prerequisite
To avoid TiKV and TiFlash racing for disk and I/O resources, mount the two NVMe SSD disks configured on EC2 to /data1
and /data2
. Deploy TiKV on /data1
and deploy TiFlash on /data2
.
Test process
Deploy TiDB v4.0 and v3.0 using TiUP.
Use the bench tool of TiUP to import the TPC-H data with the scale factor 10.
Execute the following command to import data into v3.0:
tiup bench tpch prepare \ --host ${tidb_v3_host} --port ${tidb_v3_port} --db tpch_10 \ --sf 10 \ --analyze --tidb_build_stats_concurrency 8 --tidb_distsql_scan_concurrency 30
Execute the following command to import data into v4.0:
tiup bench tpch prepare \ --host ${tidb_v4_host} --port ${tidb_v4_port} --db tpch_10 --password ${password} \ --sf 10 \ --tiflash \ --analyze --tidb_build_stats_concurrency 8 --tidb_distsql_scan_concurrency 30
Execute the TPC-H queries.
Download the TPC-H SQL query file:
git clone https://github.com/pingcap/tidb-bench.git && cd tpch/queries
Execute TPC-H queries and record the executing time of each query.
- For TiDB v3.0, use the MySQL client to connect to TiDB, execute the queries, and record the execution time of each query.
- For TiDB v4.0, use the MySQL client to connect to TiDB, and choose one of the following operations based on where data is read from:
- If data is read only from TiKV, set
set @@session.tidb_isolation_read_engines = 'tikv,tidb';
, execute the queries, and record the execution time of each query. - If data is read from TiKV and TiFlash automatically based on cost-based intelligent choice, set
set @@session.tidb_isolation_read_engines = 'tikv,tiflash,tidb';
, execute the query, and record the execution time of each query.
- If data is read only from TiKV, set
Extract and organize the data of query execution time.
Test result
The tables on which SQL statements are executed in this test only have primary keys and do not have secondary indexes. Therefore, the test result below is not influenced by indexes.
Query ID | v3.0 | v4.0 TiKV Only | v4.0 TiKV/TiFlash Automatically |
---|---|---|---|
1 | 7.78 s | 7.45 s | 2.09 s |
2 | 3.15 s | 1.71 s | 1.71 s |
3 | 6.61 s | 4.10 s | 4.05 s |
4 | 2.98 s | 2.56 s | 1.87 s |
5 | 20.35 s | 5.71 s | 8.53 s |
6 | 4.75 s | 2.44 s | 0.39 s |
7 | 7.97 s | 3.72 s | 3.59 s |
8 | 5.89 s | 3.22 s | 8.59 s |
9 | 34.08 s | 11.87 s | 15.41 s |
10 | 4.83 s | 2.75 s | 3.35 s |
11 | 3.98 s | 1.60 s | 1.59 s |
12 | 5.63 s | 3.40 s | 1.03 s |
13 | 5.41 s | 4.56 s | 4.02 s |
14 | 5.19 s | 3.10 s | 0.78 s |
15 | 10.25 s | 1.82 s | 1.26 s |
16 | 2.46 s | 1.51 s | 1.58 s |
17 | 23.76 s | 12.38 s | 8.52 s |
18 | 17.14 s | 16.38 s | 16.06 s |
19 | 5.70 s | 4.59 s | 3.20 s |
20 | 4.98 s | 1.89 s | 1.29 s |
21 | 11.12 s | 6.23 s | 6.26 s |
22 | 4.49 s | 3.05 s | 2.31 s |
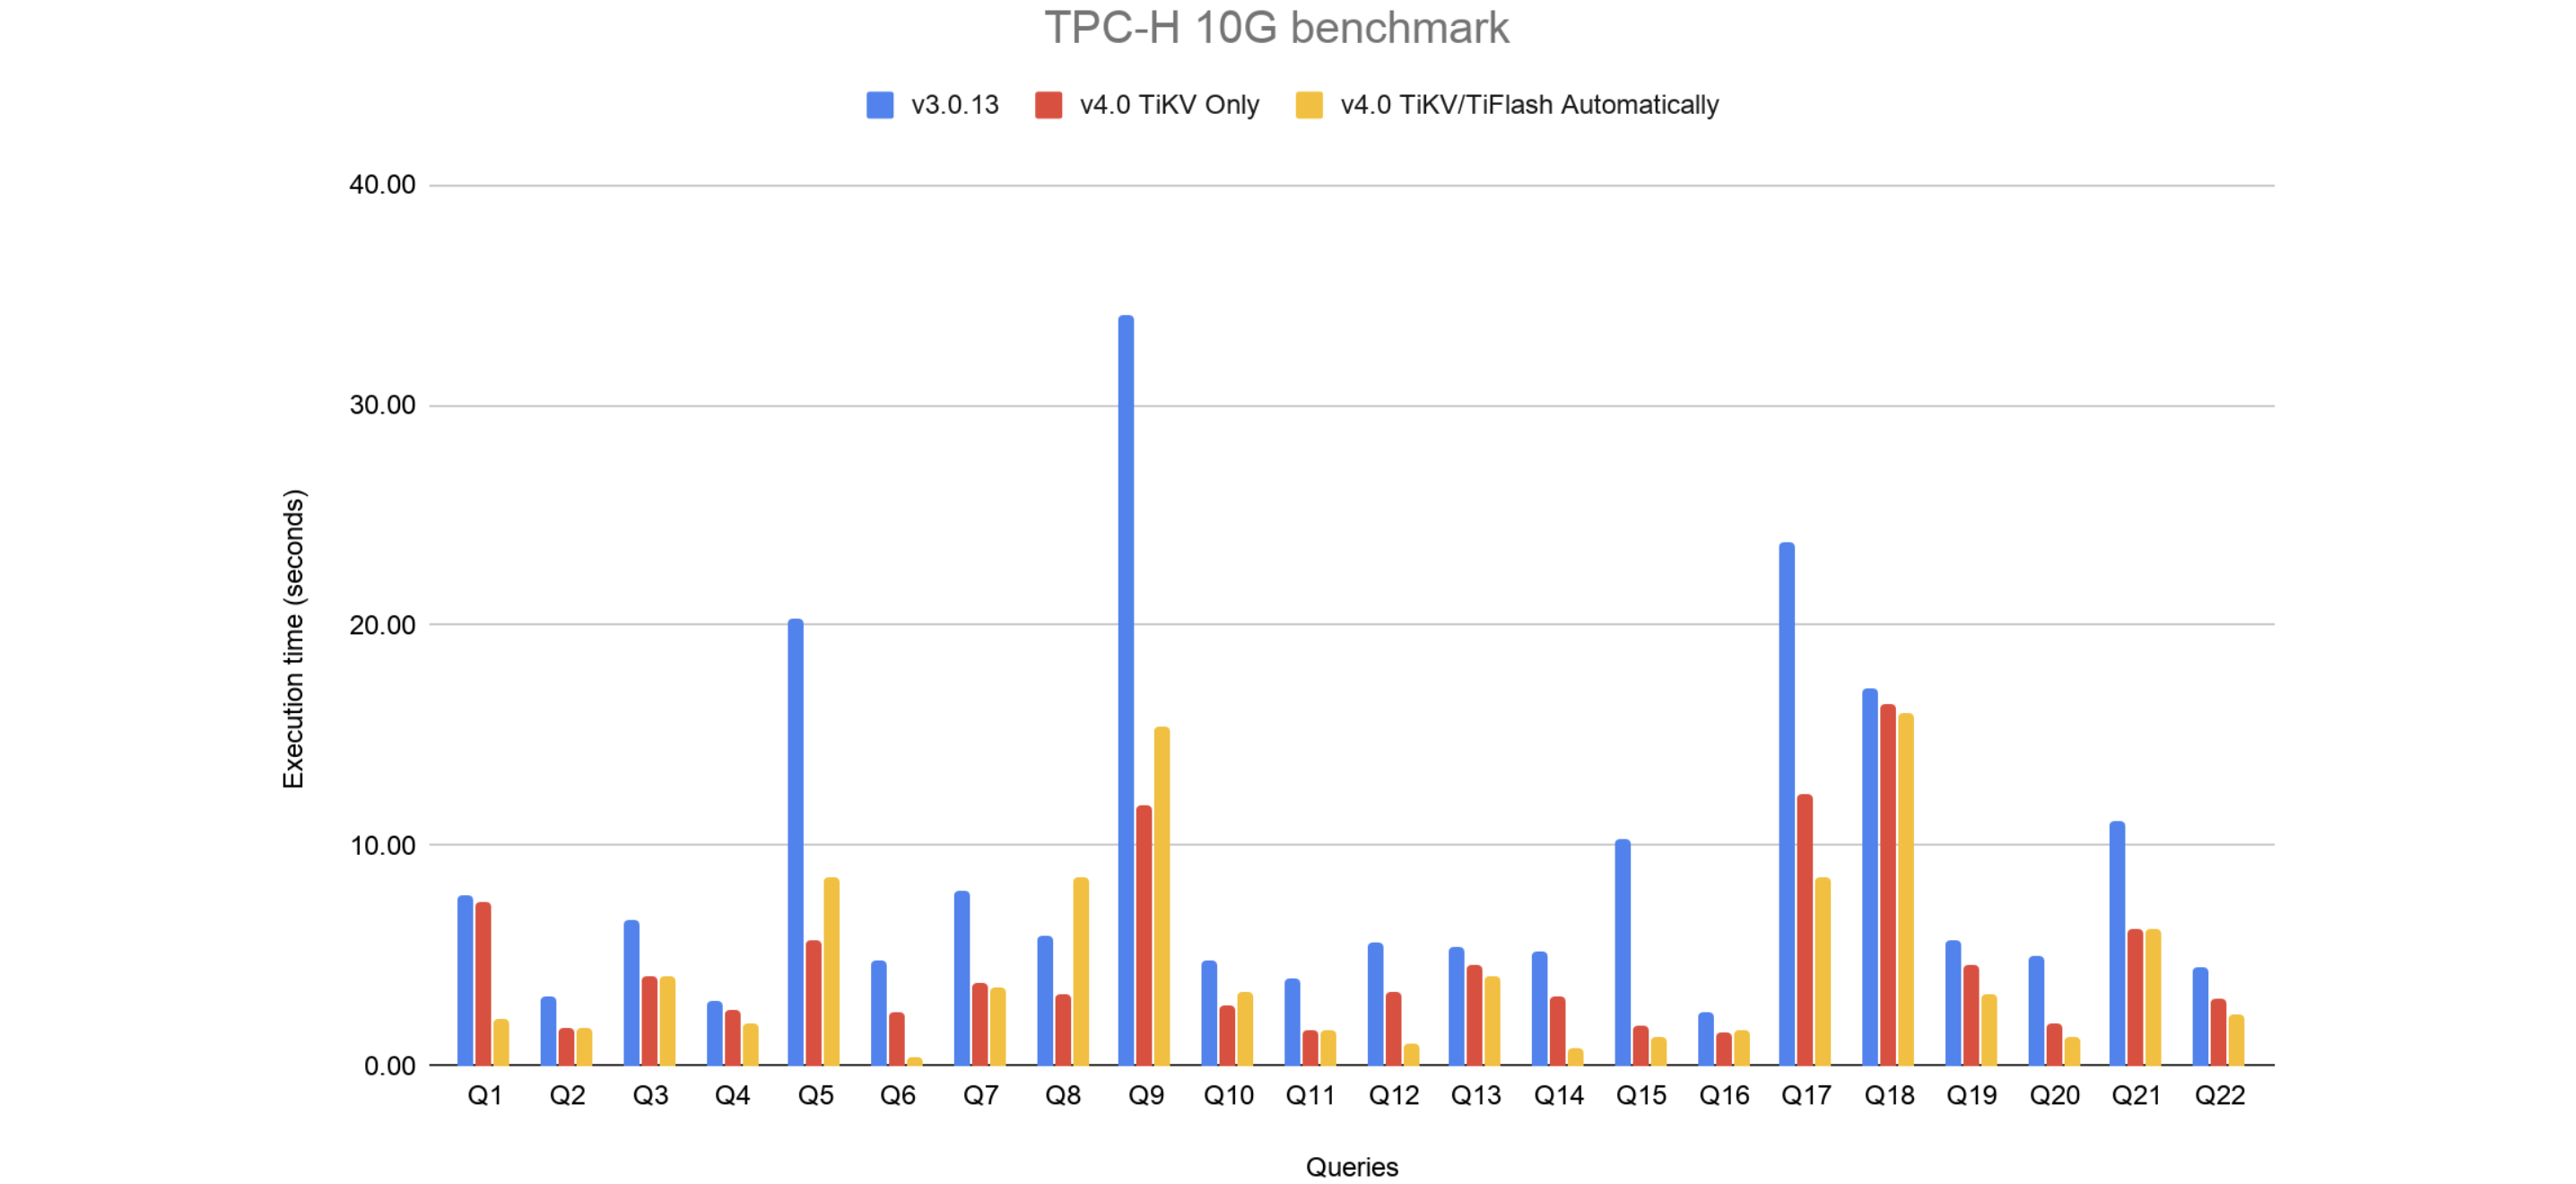
In the performance diagram above:
- Blue lines represent v3.0;
- Red lines represent v4.0 (data read only from TiKV);
- Yellow lines represent v4.0 (data read from TiKV and TiFlash automatically based on intelligent choice).
- The y-axis represents the execution time of the query. The less the time, the better the performance.
Result description:
- v4.0 TiKV Only means that TiDB reads data only from TiKV. The result shows that the TPC-H performance increased after TiDB and TiKV are upgraded to v4.0.
- v4.0 TiKV/TiFlash Automatically means that the TiDB optimizer automatically determines whether to read data from the TiFlash replica according to the cost estimation. The result shows that the TPC-H performance increased in the full HTAP form of v4.0.
From the diagram above, you can see that TPC-H performance increases by about 100% on average over a set of 22 queries.