Troubleshoot Lock Conflicts
TiDB supports complete distributed transactions. Starting from v3.0, TiDB provides optimistic transaction mode and pessimistic transaction mode. This document introduces how to troubleshoot and resolve lock conflicts in TiDB.
Optimistic transaction mode
Transactions in TiDB use two-phase commit (2PC) that includes the Prewrite phase and the Commit phase. The procedure is as follows:
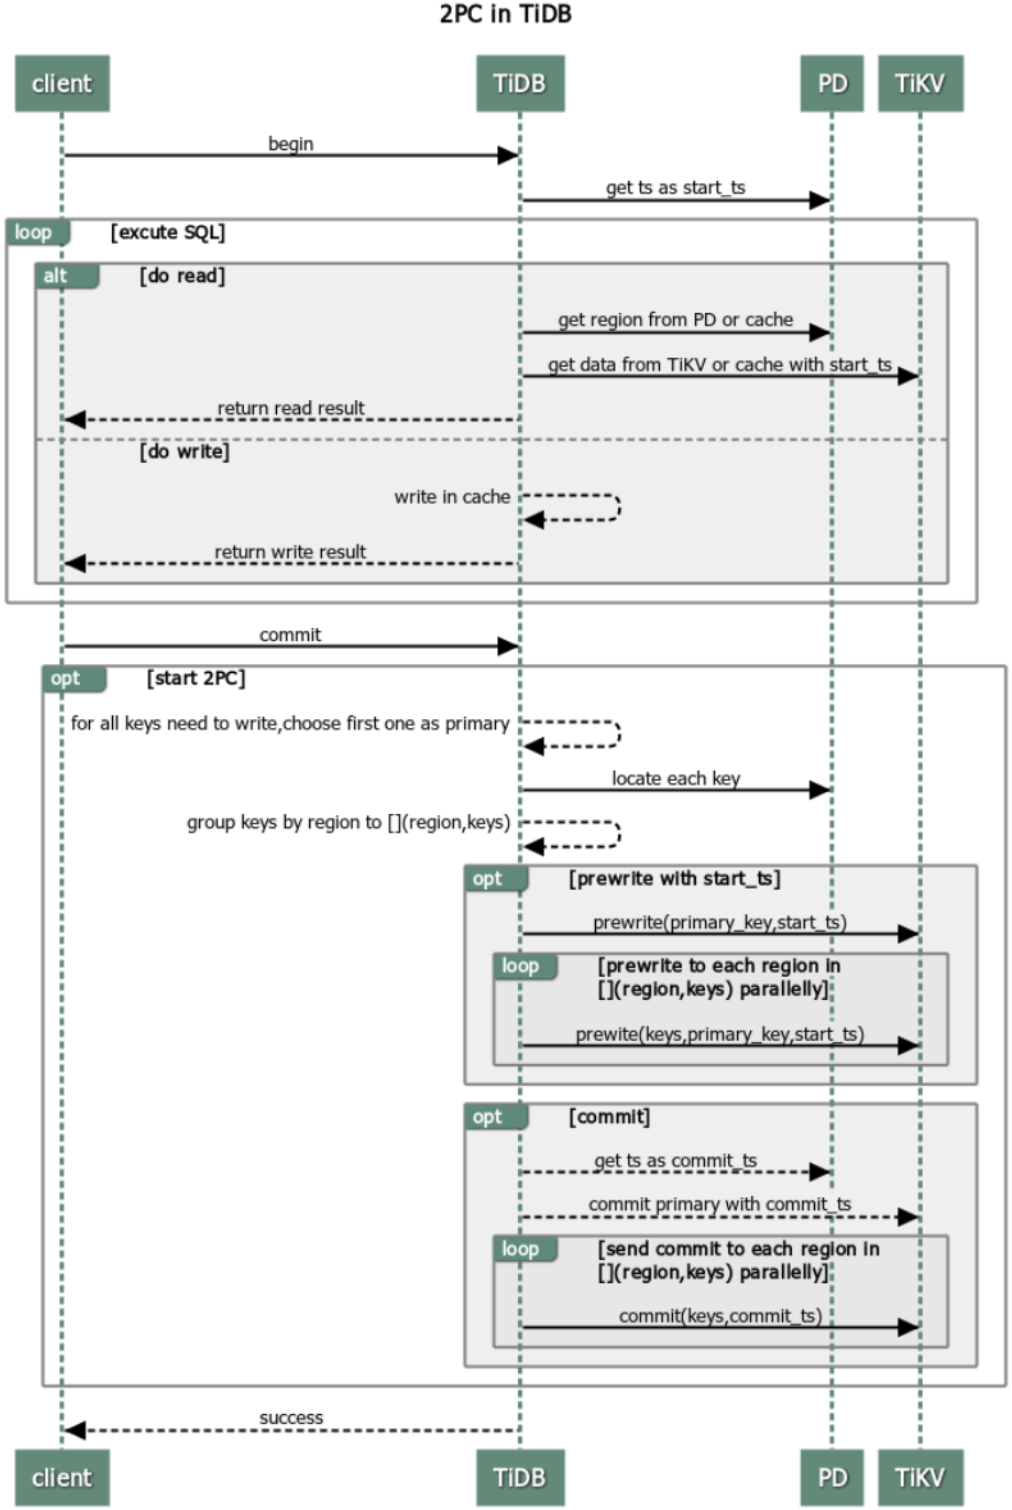
For details of Percolator and TiDB's algorithm of the transactions, see Google's Percolator.
Prewrite phase (optimistic)
In the Prewrite phase, TiDB adds a primary lock and a secondary lock to target keys. If there are lots of requests for adding locks to the same target key, TiDB prints an error such as write conflict or keyislocked to the log and reports it to the client. Specifically, the following errors related to locks might occur in the Prewrite phase.
Read-write conflict (optimistic)
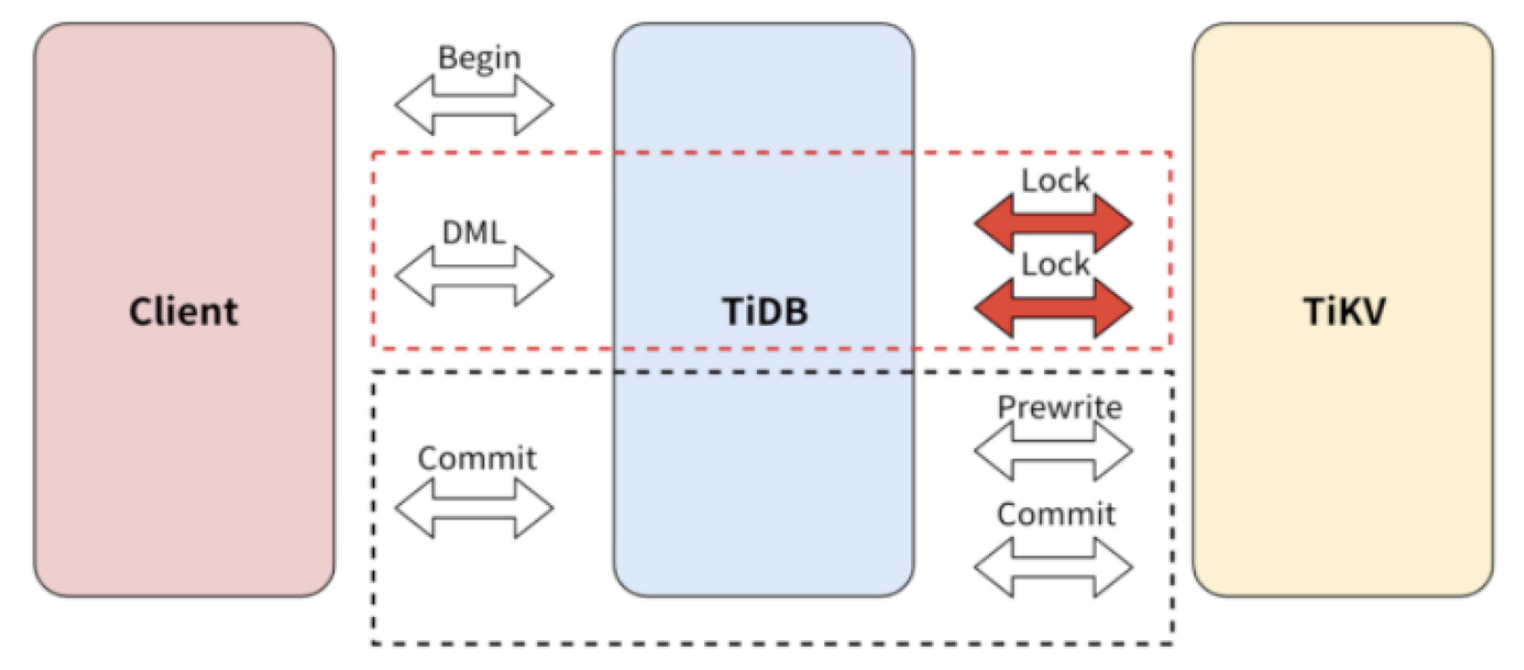
As the TiDB server receives a read request from a client, it gets a globally unique and increasing timestamp at the physical time as the start_ts of the current transaction. The transaction needs to read the latest data before start_ts, that is, the target key of the latest commit_ts that is smaller than start_ts. When the transaction finds that the target key is locked by another transaction, and it cannot know which phase the other transaction is in, a read-write conflict happens. The diagram is as follows:
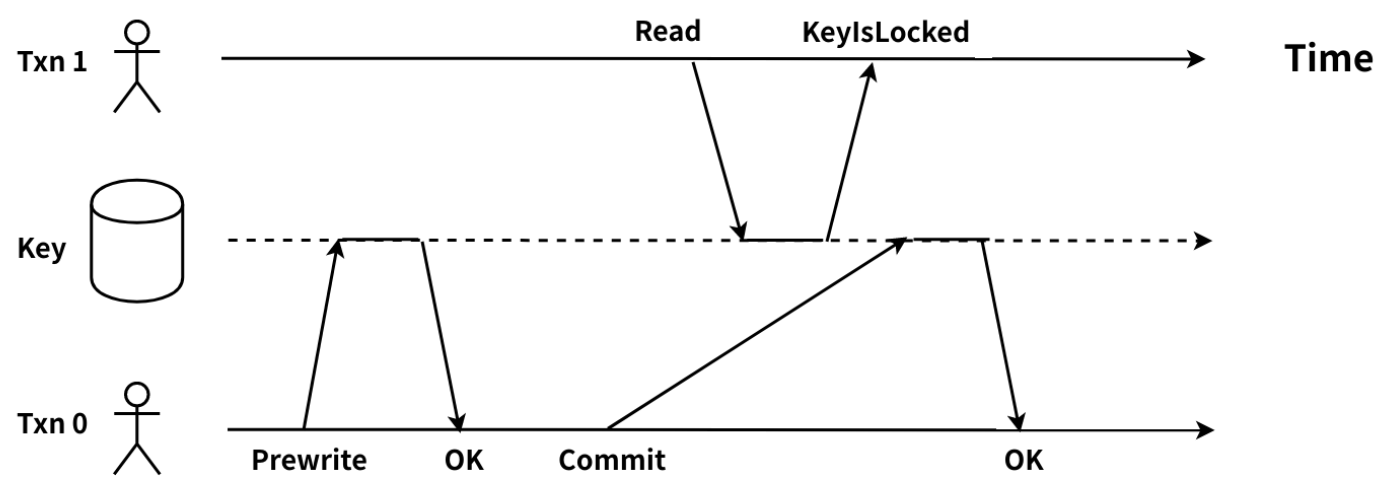
Txn0 completes the Prewrite phase and enters the Commit phase. At this time, Txn1 requests to read the same target key. Txn1 needs to read the target key of the latest commit_ts that is smaller than its start_ts. Because Txn1’s start_ts is larger than Txn0's lock_ts, Txn1 must wait for the target key's lock to be cleared, but it hasn’t been done. As a result, Txn1 cannot confirm whether Txn0 has been committed or not. Thus, a read-write conflict between Txn1 and Txn0 happens.
You can detect the read-write conflict in your TiDB cluster by the following ways:
Monitoring metrics and logs of the TiDB server
Monitoring data through Grafana
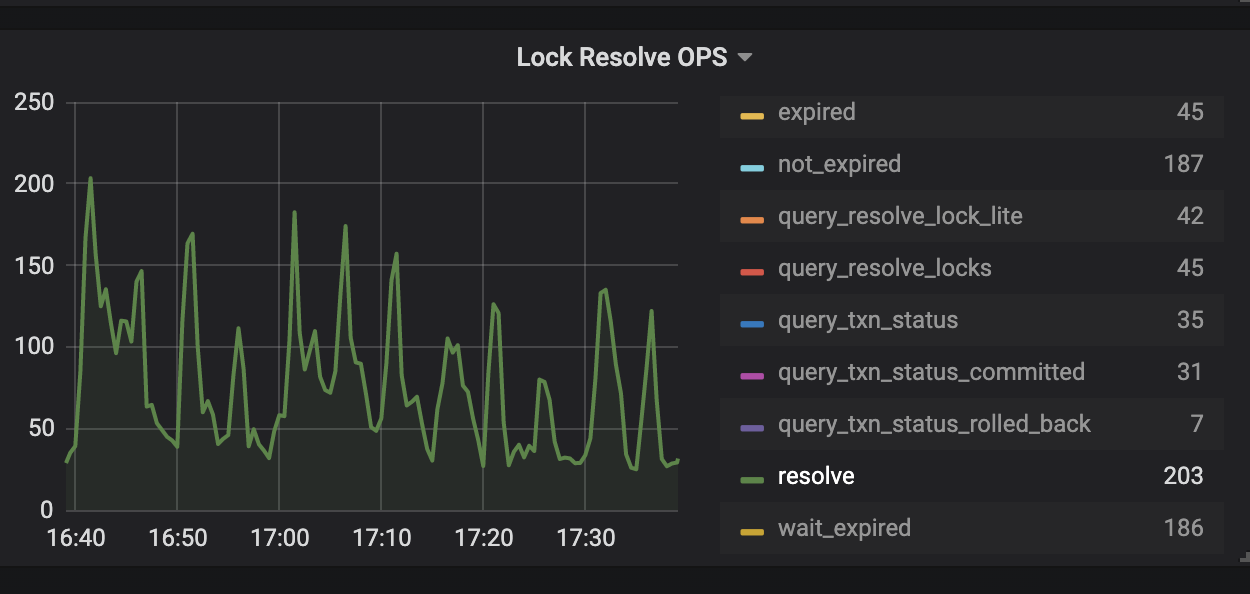
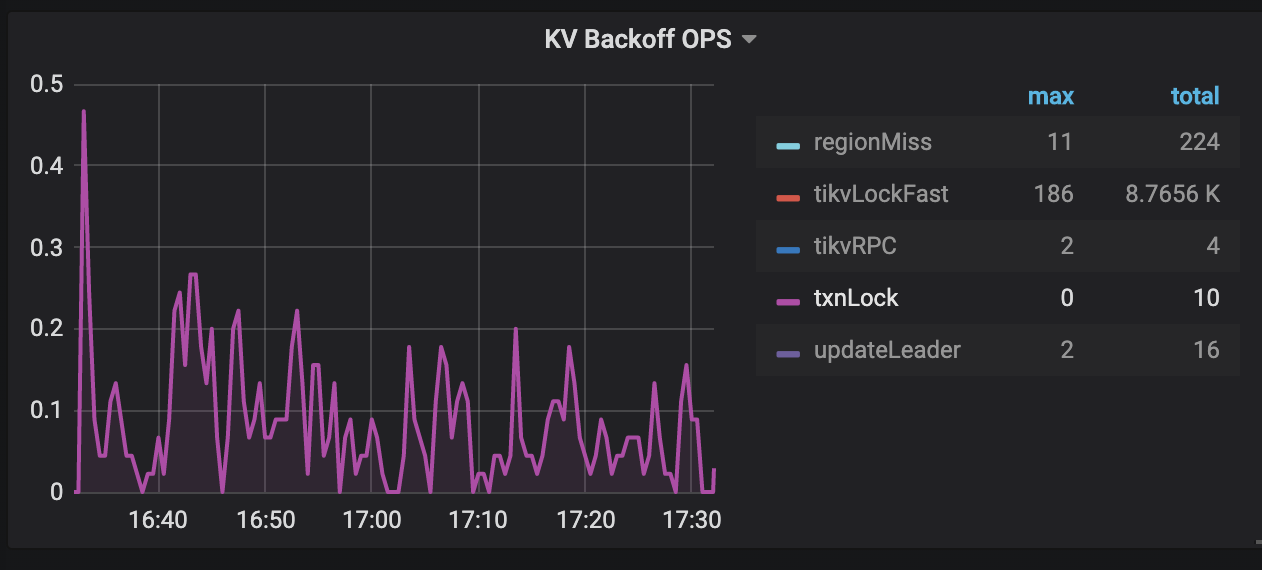
On the
KV Errorspanel in the TiDB dashboard, there are two monitoring metricsLock Resolve OPSandKV Backoff OPSwhich can be used to check read-write conflicts in the transactions. If the values of bothnot_expiredandresolveunderLock Resolve OPSincrease, there might be many read-write conflicts. Thenot_expireditem means that the transaction's lock has not timed out. Theresolveitem means that the other transaction tries to clean up the locks. If the value of anothertxnLockFastitem underKV Backoff OPSincreases, there might also be read-write conflicts.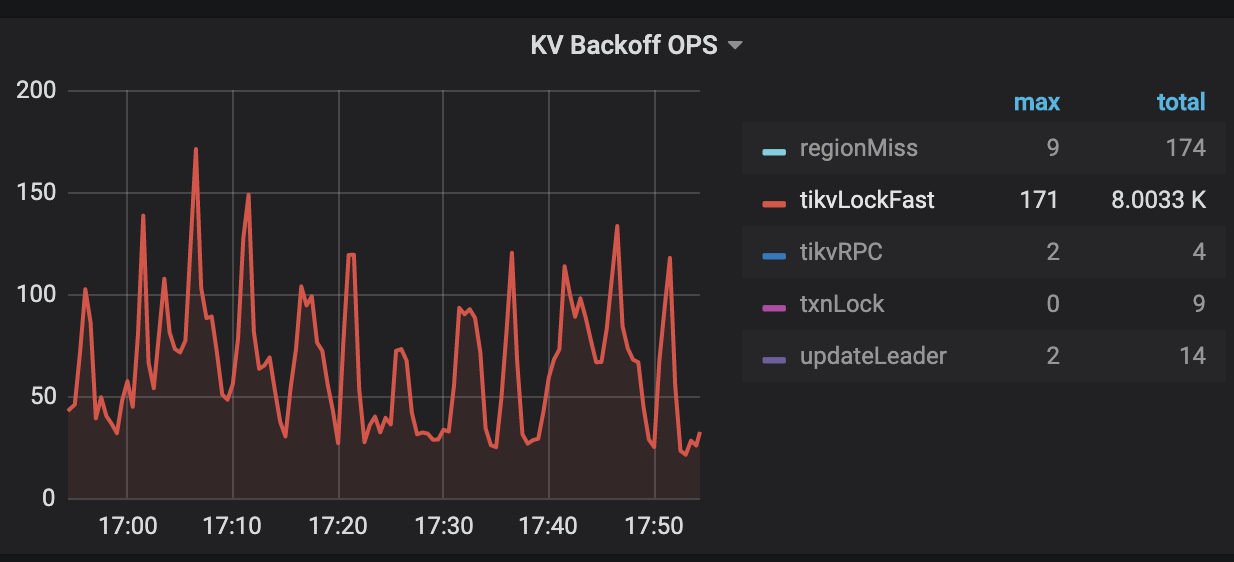
Logs of the TiDB server
If there is any read-write conflict, you can see the following message in the TiDB log:
[INFO] [coprocessor.go:743] ["[TIME_COP_PROCESS] resp_time:406.038899ms txnStartTS:416643508703592451 region_id:8297 store_addr:10.8.1.208:20160 backoff_ms:255 backoff_types:[txnLockFast,txnLockFast] kv_process_ms:333 scan_total_write:0 scan_processed_write:0 scan_total_data:0 scan_processed_data:0 scan_total_lock:0 scan_processed_lock:0"]- txnStartTS: The start_ts of the transaction that is sending the read request. In the above log,
416643508703592451is the start_ts. - backoff_types: If a read-write conflict happens, and the read request performs backoff and retry, the type of retry is
TxnLockFast. - backoff_ms: The time that the read request spends in the backoff and retry, and the unit is milliseconds. In the above log, the read request spends 255 milliseconds in the backoff and retry.
- region_id: Region ID corresponding to the target key of the read request.
- txnStartTS: The start_ts of the transaction that is sending the read request. In the above log,
Logs of the TiKV server
If there is any read-write conflict, you can see the following message in the TiKV log:
[ERROR] [endpoint.rs:454] [error-response] [err=""locked primary_lock:7480000000000004D35F6980000000000000010380000000004C788E0380000000004C0748 lock_version: 411402933858205712 key: 7480000000000004D35F7280000000004C0748 lock_ttl: 3008 txn_size: 1""]This message indicates that a read-write conflict occurs in TiDB. The target key of the read request has been locked by another transaction. The locks are from the uncommitted optimistic transaction and the uncommitted pessimistic transaction after the prewrite phase.
- primary_lock:Indicates that the target key is locked by the primary lock.
- lock_version:The start_ts of the transaction that owns the lock.
- key:The target key that is locked.
- lock_ttl: The lock’s TTL (Time To Live)
- txn_size:The number of keys that are in the Region of the transaction that owns the lock.
Solutions:
A read-write conflict triggers an automatic backoff and retry. As in the above example, Txn1 has a backoff and retry. The first time of the retry is 100 ms, the longest retry is 3000 ms, and the total time is 20000 ms at maximum.
You can use the sub-command
decoderof TiDB Control to view the table id and rowid of the row corresponding to the specified key:./tidb-ctl decoder -f table_row -k "t\x00\x00\x00\x00\x00\x00\x00\x1c_r\x00\x00\x00\x00\x00\x00\x00\xfa" table_id: -9223372036854775780 row_id: -9223372036854775558
KeyIsLocked error
In the Prewrite phase of a transaction, TiDB checks whether there is any write-write conflict, and then checks whether the target key has been locked by another transaction. If the key is locked, the TiKV server outputs a "KeyIsLocked" error. At present, the error message is not printed in the logs of TiDB and TiKV. Same as read-write conflicts, when "KeyIsLocked" occurs, TiDB automatically performs backoff and retry for the transaction.
You can check whether there's any "KeyIsLocked" error in the TiDB monitoring on Grafana:
The KV Errors panel in the TiDB dashboard has two monitoring metrics Lock Resolve OPS and KV Backoff OPS which can be used to check write-write conflicts caused by a transaction. If the resolve item under Lock Resolve OPS and the txnLock item under KV Backoff OPS have a clear upward trend, a "KeyIsLocked" error occurs. resolve refers to the operation that attempts to clear the lock, and txnLock represents a write conflict.
Solutions:
- If there is a small amount of txnLock in the monitoring, no need to pay too much attention. The backoff and retry is automatically performed in the background. The first time of the retry is 200 ms and the maximum time is 3000 ms for a single retry.
- If there are too many “txnLock” operations in the
KV Backoff OPS, it is recommended that you analyze the reasons to the write conflicts from the application side. - If your application is a write-write conflict scenario, it is strongly recommended to use the pessimistic transaction mode.
Commit phase (optimistic)
After the Prewrite phase completes, the client obtains commit_ts, and then the transaction is going to the next phase of 2PC - the Commit phase.
LockNotFound error
The error log of "TxnLockNotFound" means that transaction commit time is longer than the the TTL time, and when the transaction is going to commit, its lock has been rolled back by other transactions. If the TiDB server enables transaction commit retry, this transaction is re-executed according to tidb_retry_limit. (Note about the difference between explicit and implicit transactions.)
You can check whether there is any "LockNotFound" error in the following ways:
View the logs of the TiDB server
If a "TxnLockNotFound" error occurs, the TiDB log message is like this:
[WARN] [session.go:446] ["commit failed"] [conn=149370] ["finished txn"="Txn{state=invalid}"] [error="[kv:6]Error: KV error safe to retry tikv restarts txn: Txn(Mvcc(TxnLockNotFound{ start_ts: 412720515987275779, commit_ts: 412720519984971777, key: [116, 128, 0, 0, 0, 0, 1, 111, 16, 95, 114, 128, 0, 0, 0, 0, 0, 0, 2] })) [try again later]"]- start_ts: The start_ts of the transaction that outputs the
TxnLockNotFounderror because its lock has been rolled back by other transactions. In the above log,412720515987275779is the start_ts. - commit_ts: The commit_ts of the transaction that outputs the
TxnLockNotFounderror. In the above log,412720519984971777is the commit_ts.
- start_ts: The start_ts of the transaction that outputs the
View the logs of the TiKV server
If a "TxnLockNotFound" error occurs, the TiKV log message is like this:
Error: KV error safe to retry restarts txn: Txn(Mvcc(TxnLockNotFound)) [ERROR [Kv.rs:708] ["KvService::batch_raft send response fail"] [err=RemoteStoped]
Solutions:
By checking the time interval between start_ts and commit_ts, you can confirm whether the commit time exceeds the TTL time.
Checking the time interval using the PD control tool:
./pd-ctl tso [start_ts]
./pd-ctl tso [commit_ts]
It is recommended to check whether the write performance is slow, which might cause that the efficiency of transaction commit is poor, and thus the lock is cleared.
In the case of disabling the TiDB transaction retry, you need to catch the exception on the application side and try again.
Pessimistic transaction mode
Before v3.0.8, TiDB uses the optimistic transaction mode by default. In this mode, if there is a transaction conflict, the latest transaction will fail to commit. Therefore, the application needs to support retrying transactions. The pessimistic transaction mode resolves this issue, and the application does not need to modify any logic for the workaround.
The commit phase of the pessimistic transaction mode and the optimistic transaction mode in TiDB has the same logic, and both commits are in the 2PC mode. The important adaptation of pessimistic transactions is DML execution.
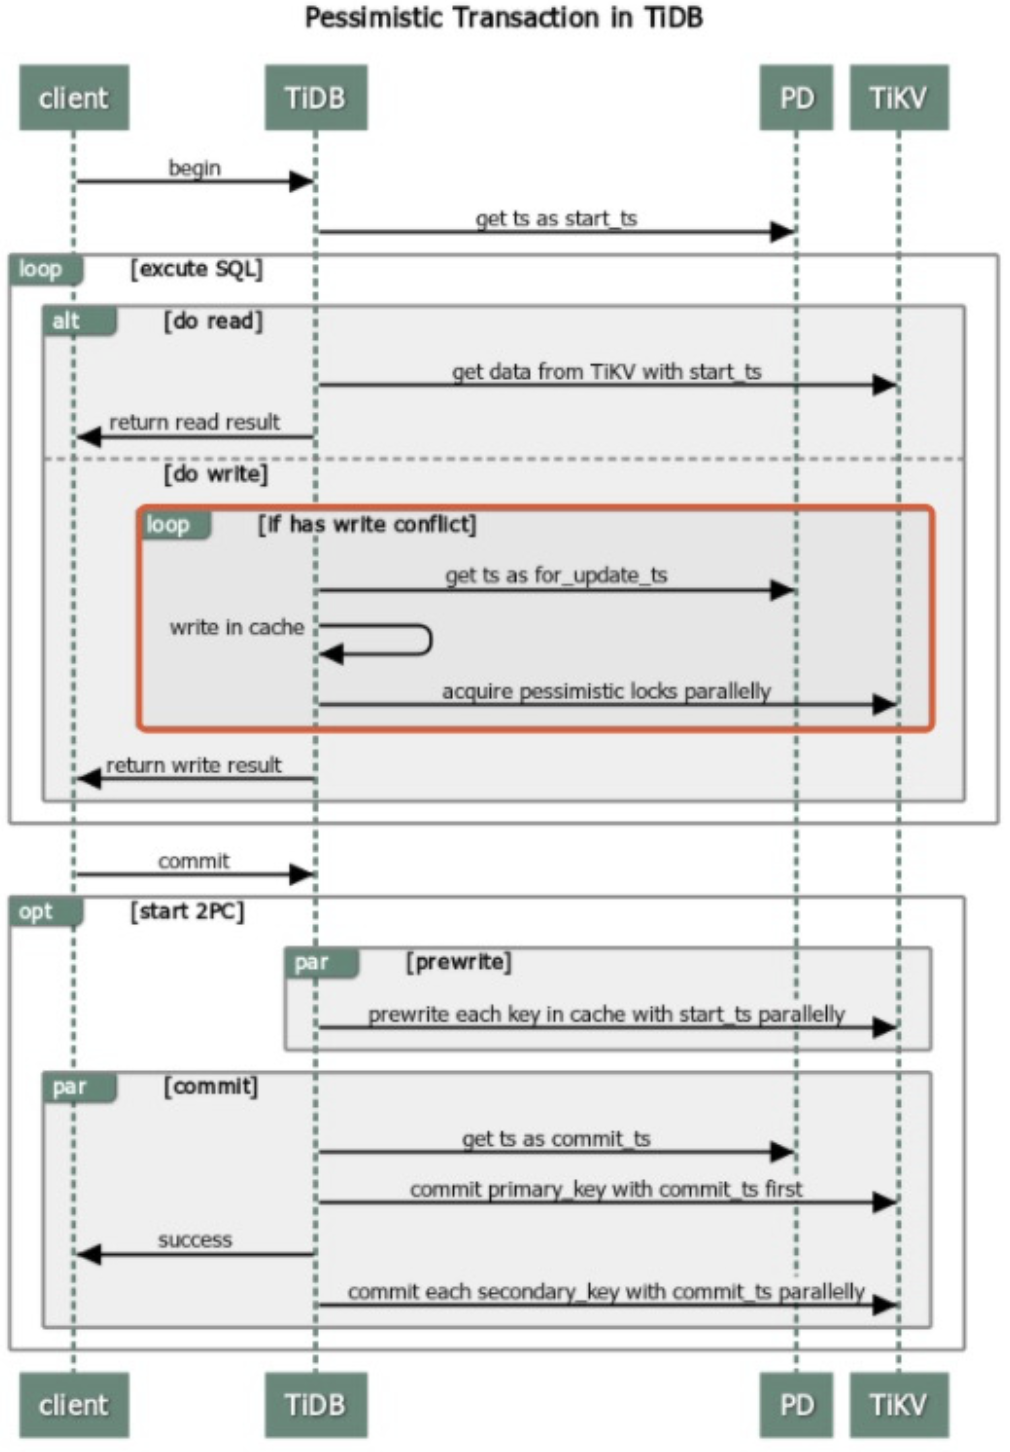
The pessimistic transaction adds an Acquire Pessimistic Lock phase before 2PC. This phase includes the following steps:
- (same as the optimistic transaction mode) Receive the
beginrequest from the client, and the current timestamp is this transaction’s start_ts. - When the TiDB server receives an
updaterequest from the client, the TiDB server initiates a pessimistic lock request to the TiKV server, and the lock is persisted to the TiKV server. - (same as the optimistic transaction mode) When the client sends the commit request, TiDB starts to perform the 2PC similar to the optimistic transaction mode.
For details, see Pessimistic transaction mode.
Prewrite phase (pessimistic)
In the transaction pessimistic mode, the commit phase is the same as the 2PC. Therefore, the read-write conflict also exists as in the optimistic transaction mode.
Read-write conflict (pessimistic)
Same as Read-write conflict (optimistic).
Commit phase (pessimistic)
In the pessimistic transaction mode, there will be no TxnLockNotFound error. Instead, the pessimistic lock will automatically update the TTL of the transaction through txnheartbeat to ensure that the second transaction does not clear the lock of the first transaction.
Other errors related to locks
Pessimistic lock retry limit reached
When the transaction conflict is very serious or a write conflict occurs, the optimistic transaction will be terminated directly, and the pessimistic transaction will retry the statement with the latest data from storage until there is no write conflict.
Because TiDB's locking operation is a write operation, and the process of the operation is to read first and then write, there are two RPC requests. If a write conflict occurs in the middle of a transaction, TiDB will try again to lock the target keys, and each retry will be printed to the TiDB log. The number of retries is determined by pessimistic-txn.max-retry-count.
In the pessimistic transaction mode, if a write conflict occurs and the number of retries reaches the upper limit, an error message containing the following keywords appears in the TiDB log:
err="pessimistic lock retry limit reached"
Solutions:
- If the above error occurs frequently, it is recommended to adjust from the application side.
Lock wait timeout exceeded
In the pessimistic transaction mode, transactions wait for locks of each other. The timeout for waiting a lock is defined by the innodb_lock_wait_timeout parameter of TiDB. This is the maximum wait lock time at the SQL statement level, which is the expectation of a SQL statement Locking, but the lock has never been acquired. After this time, TiDB will not try to lock again and will return the corresponding error message to the client.
When a wait lock timeout occurs, the following error message will be returned to the client:
ERROR 1205 (HY000): Lock wait timeout exceeded; try restarting transaction
Solutions:
- If the above error occurs frequently, it is recommended to adjust the application logic.
TTL manager has timed out
The transaction execution time can not exceed the GC time limit. In addition, the TTL time of pessimistic transactions has an upper limit, whose default value is 1 hour. Therefore, a pessimistic transaction executed for more than 1 hour will fail to commit. This timeout threshold is controlled by the TiDB parameter performance.max-txn-ttl.
When the execution time of a pessimistic transaction exceeds the TTL time, the following error message occurs in the TiDB log:
TTL manager has timed out, pessimistic locks may expire, please commit or rollback this transaction
Solutions:
- First, confirm whether the application logic can be optimized. For example, large transactions may trigger TiDB's transaction size limit, which can be split into multiple small transactions.
- Also, you can adjust the related parameters properly to meet the application transaction logic.
Deadlock found when trying to get lock
Due to resource competition between two or more transactions, a deadlock occurs. If you do not handle it manually, transactions that block each other cannot be executed successfully and will wait for each other forever. To resolve dead locks, you need to manually terminate one of the transactions to resume other transaction requests.
When a pessimistic transaction has a deadlock, one of the transactions must be terminated to unlock the deadlock. The client will return the same Error 1213 error as in MySQL, for example:
[err="[executor:1213]Deadlock found when trying to get lock; try restarting transaction"]
Solutions:
- If it is difficult to confirm the cause of the deadlock, for v5.1 and later versions, you are recommended to try to query the
INFORMATION_SCHEMA.DEADLOCKSorINFORMATION_SCHEMA.CLUSTER_DEADLOCKSsystem table to get the information of deadlock waiting chain. For details, see the Deadlock errors section and theDEADLOCKStable document. - If the deadlock occurs frequently, you need to adjust the transaction query logic in your application to reduce such occurrences.
Use Lock View to troubleshoot issues related to pessimistic locks
Since v5.1, TiDB supports the Lock View feature. This feature has several system tables built in information_schema that provide more information about the pessimistic lock conflicts and pessimistic lock waitings. For the detailed introduction of these tables, see the following documents:
TIDB_TRXandCLUSTER_TIDB_TRX: Provides information of all running transactions on the current TiDB node or in the entire cluster, including whether the transaction is in the lock-waiting state, the lock-waiting time, and the digests of statements that have been executed in the transaction.DATA_LOCK_WAITS: Provides the pessimistic lock-waiting information in TiKV, including thestart_tsof the blocking and blocked transaction, the digest of the blocked SQL statement, and the key on which the waiting occurs.DEADLOCKSandCLUSTER_DEADLOCKS: Provides the information of several deadlock events that have recently occurred on the current TiDB node or in the entire cluster, including the waiting relationship among transactions in the deadlock loops, the digest of the statement currently being executed in the transaction, and the key on which the waiting occurs.
The following sections show the examples of troubleshooting some issues using these tables.
Deadlock errors
To get the information of the recent deadlock errors, you can query the DEADLOCKS or CLUSTER_DEADLOCKS table. For example:
select * from information_schema.deadlocks;
+-------------+----------------------------+-----------+--------------------+------------------------------------------------------------------+----------------------------------------+--------------------+
| DEADLOCK_ID | OCCUR_TIME                 | RETRYABLE | TRY_LOCK_TRX_ID    | CURRENT_SQL_DIGEST                                               | KEY                                    | TRX_HOLDING_LOCK   |
+-------------+----------------------------+-----------+--------------------+------------------------------------------------------------------+----------------------------------------+--------------------+
|           1 | 2021-06-04 08:22:38.765699 |         0 | 425405959304904707 | 22230766411edb40f27a68dadefc63c6c6970d5827f1e5e22fc97be2c4d8350d | 7480000000000000385F728000000000000002 | 425405959304904708 |
|           1 | 2021-06-04 08:22:38.765699 |         0 | 425405959304904708 | 22230766411edb40f27a68dadefc63c6c6970d5827f1e5e22fc97be2c4d8350d | 7480000000000000385F728000000000000001 | 425405959304904707 |
+-------------+----------------------------+-----------+--------------------+------------------------------------------------------------------+----------------------------------------+--------------------+
The query result above shows the waiting relationship among multiple transactions in the deadlock error, the digest of the SQL statement currently being executed in each transaction, and the key on which the conflict occurs.
You can get the text of the normalized SQL statement corresponding to the digest of the SQL statements executed recently from the STATEMENTS_SUMMARY or STATEMENTS_SUMMARY_HISTORY table. For details, see STATEMENTS_SUMMARY and STATEMENTS_SUMMARY_HISTORY tables. You can also join the obtained results directly with the DEADLOCKS table. Note that the STATEMENTS_SUMMARY table might not contain the information of all SQL statements, so left join is used in the following example:
select l.deadlock_id, l.occur_time, l.try_lock_trx_id, l.trx_holding_lock, s.digest_text from information_schema.deadlocks as l left join information_schema.statements_summary as s on l.current_sql_digest = s.digest;
+-------------+----------------------------+--------------------+--------------------+-----------------------------------------+
| deadlock_id | occur_time                 | try_lock_trx_id    | trx_holding_lock   | digest_text                             |
+-------------+----------------------------+--------------------+--------------------+-----------------------------------------+
|           1 | 2021-06-04 08:22:38.765699 | 425405959304904707 | 425405959304904708 | update `t` set `v` = ? where `id` = ? ; |
|           1 | 2021-06-04 08:22:38.765699 | 425405959304904708 | 425405959304904707 | update `t` set `v` = ? where `id` = ? ; |
+-------------+----------------------------+--------------------+--------------------+-----------------------------------------+
A few hot keys cause queueing locks
The DATA_LOCK_WAITS system table provides the lock-waiting status on the TiKV nodes. When you query this table, TiDB automatically obtains the real-time lock-waiting information from all TiKV nodes. If a few hot keys are frequently locked and block many transactions, you can query the DATA_LOCK_WAITS table and aggregate the results by key to try to find the keys on which issues frequently occur:
select `key`, count(*) as `count` from information_schema.data_lock_waits group by `key` order by `count` desc;
+----------------------------------------+-------+
| key                                    | count |
+----------------------------------------+-------+
| 7480000000000000415f728000000000000001 |     2 |
| 7480000000000000415f728000000000000002 |     1 |
+----------------------------------------+-------+
To avoid contingency, you might need to make multiple queries.
If you know the key that frequently has issues occurred, you can try to get the information of the transaction that tries to lock the key from the TIDB_TRX or CLUSTER_TIDB_TRX table.
Note that the information displayed in the TIDB_TRX and CLUSTER_TIDB_TRX tables is also the information of the transactions that are running at the time the query is performed. These tables do not display the information of the completed transactions. If there is a large number of concurrent transactions, the result set of the query might also be large. You can use the limit clause or the where clause to filter out transactions with a long lock-waiting time. Note that when you join multiple tables in Lock View, the data in different tables might not be obtained at the same time, so the information in different tables might not be consistent.
select trx.* from information_schema.data_lock_waits as l left join information_schema.tidb_trx as trx on l.trx_id = trx.id where l.key = "7480000000000000415f728000000000000001"\G
*************************** 1. row ***************************
                ID: 425496938634543111
        START_TIME: 2021-06-08 08:46:48.341000
CURRENT_SQL_DIGEST: a4e28cc182bdd18288e2a34180499b9404cd0ba07e3cc34b6b3be7b7c2de7fe9
             STATE: LockWaiting
WAITING_START_TIME: 2021-06-08 08:46:48.388024
   MEM_BUFFER_KEYS: 1
  MEM_BUFFER_BYTES: 19
        SESSION_ID: 87
              USER: root
                DB: test
   ALL_SQL_DIGESTS: [0fdc781f19da1c6078c9de7eadef8a307889c001e05f107847bee4cfc8f3cdf3, a4e28cc182bdd18288e2a34180499b9404cd0
ba07e3cc34b6b3be7b7c2de7fe9, a4e28cc182bdd18288e2a34180499b9404cd0ba07e3cc34b6b3be7b7c2de7fe9]
*************************** 2. row ***************************
                ID: 425496940994101249
        START_TIME: 2021-06-08 08:46:57.342000
CURRENT_SQL_DIGEST: a4e28cc182bdd18288e2a34180499b9404cd0ba07e3cc34b6b3be7b7c2de7fe9
             STATE: LockWaiting
WAITING_START_TIME: 2021-06-08 08:46:57.590060
   MEM_BUFFER_KEYS: 0
  MEM_BUFFER_BYTES: 0
        SESSION_ID: 85
              USER: root
                DB: test
   ALL_SQL_DIGESTS: [0fdc781f19da1c6078c9de7eadef8a307889c001e05f107847bee4cfc8f3cdf3, a4e28cc182bdd18288e2a34180499b9404cd0
ba07e3cc34b6b3be7b7c2de7fe9]
2 rows in set (0.00 sec)
A transaction is blocked for a long time
If a transaction is known to be blocked by another transaction (or multiple transactions) and the start_ts (transaction ID) of the current transaction is known, you can use the following method to obtain the information of the blocking transaction. Note that when you join multiple tables in Lock View, the data in different tables might not be obtained at the same time, so the information in different tables might not be consistent.
select l.key, trx.* from information_schema.data_lock_waits as l join information_schema.tidb_trx as trx on l.current_holding_trx_id = trx.id where l.trx_id = 425497223886536705\G
*************************** 1. row ***************************
               key: 7480000000000000475f728000000000000002
                ID: 425497219115778059
        START_TIME: 2021-06-08 09:04:38.292000
CURRENT_SQL_DIGEST: a4e28cc182bdd18288e2a34180499b9404cd0ba07e3cc34b6b3be7b7c2de7fe9
             STATE: LockWaiting
WAITING_START_TIME: 2021-06-08 09:04:38.336264
   MEM_BUFFER_KEYS: 1
  MEM_BUFFER_BYTES: 19
        SESSION_ID: 97
              USER: root
                DB: test
   ALL_SQL_DIGESTS: [0fdc781f19da1c6078c9de7eadef8a307889c001e05f107847bee4cfc8f3cdf3, a4e28cc182bdd18288e2a34180499b9404cd0
ba07e3cc34b6b3be7b7c2de7fe9, a4e28cc182bdd18288e2a34180499b9404cd0ba07e3cc34b6b3be7b7c2de7fe9]
1 row in set (0.01 sec)
If the start_ts of the current transaction is unknown, you can try to find it out from the information in the TIDB_TRX / CLUSTER_TIDB_TRX table or in the PROCESSLIST / CLUSTER_PROCESSLIST table.