SQL Statements Page of TiDB Dashboard
The SQL statements page shows the execution status of all SQL statements in the cluster. This page is often used to analyze the SQL statement whose total or single execution time is long.
On this page, SQL queries with a consistent structure (even if the query parameters are inconsistent) are classified as the same SQL statement. For example, both SELECT * FROM employee WHERE id IN (1, 2, 3) and select * from EMPLOYEE where ID in (4, 5) are classified as the same select * from employee where id in (...) SQL statement.
Access the page
You can use one of the following two methods to access the SQL statement summary page:
After logging into TiDB Dashboard, click SQL Statements on the left navigation menu:
Visit http://127.0.0.1:2379/dashboard/#/statement in your browser. Replace
127.0.0.1:2379with the actual PD instance address and port.
All the data shown on the SQL statement summary page are from the TiDB statement summary tables. For more details about the tables, see TiDB Statement Summary Tables.
Change Filters
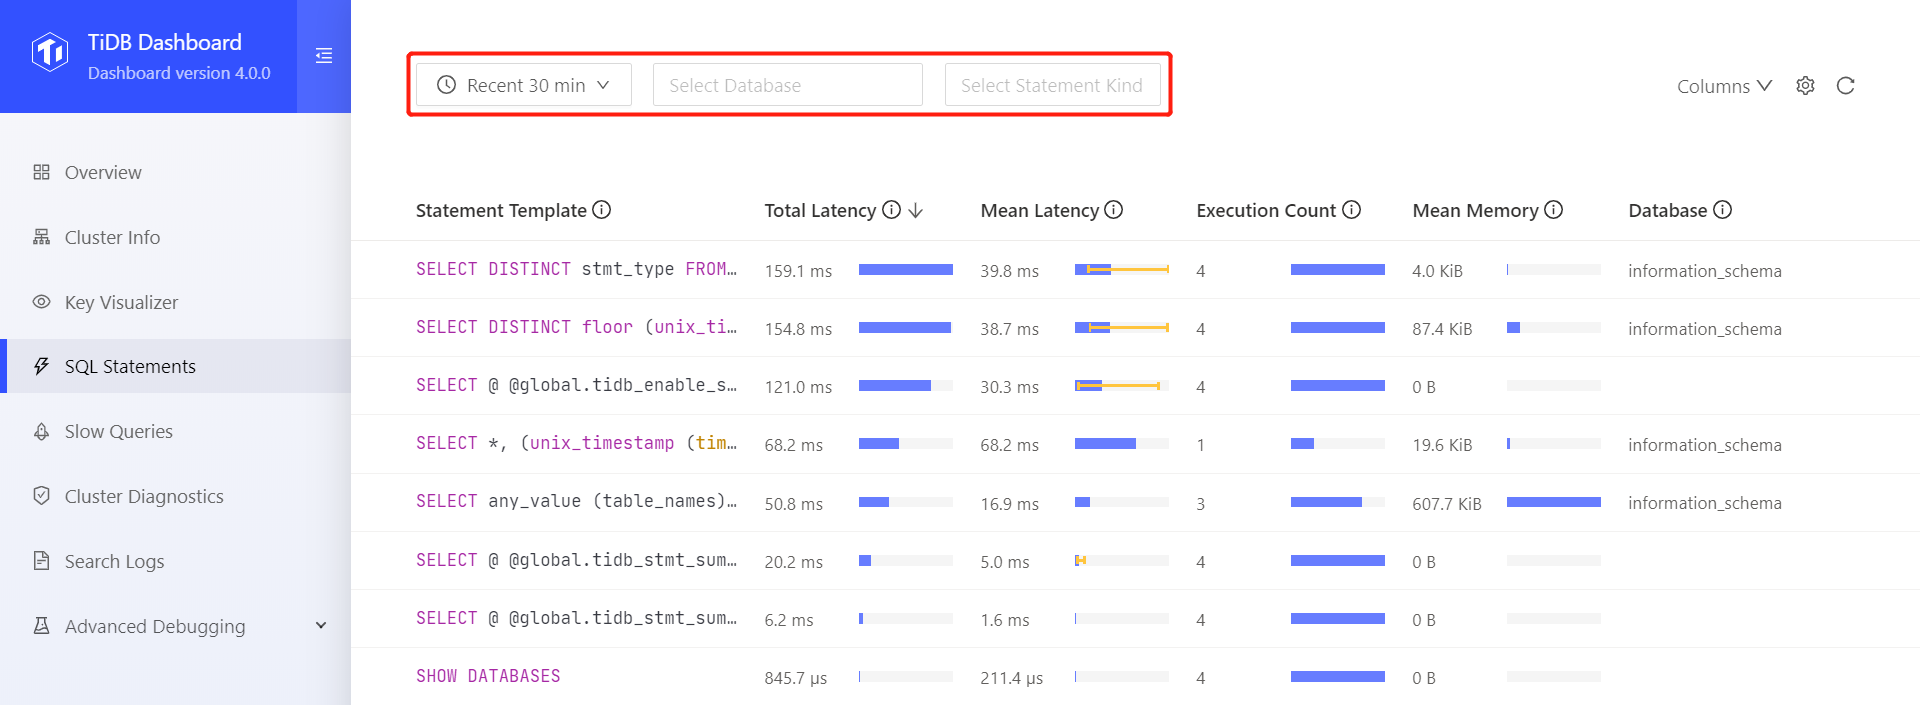
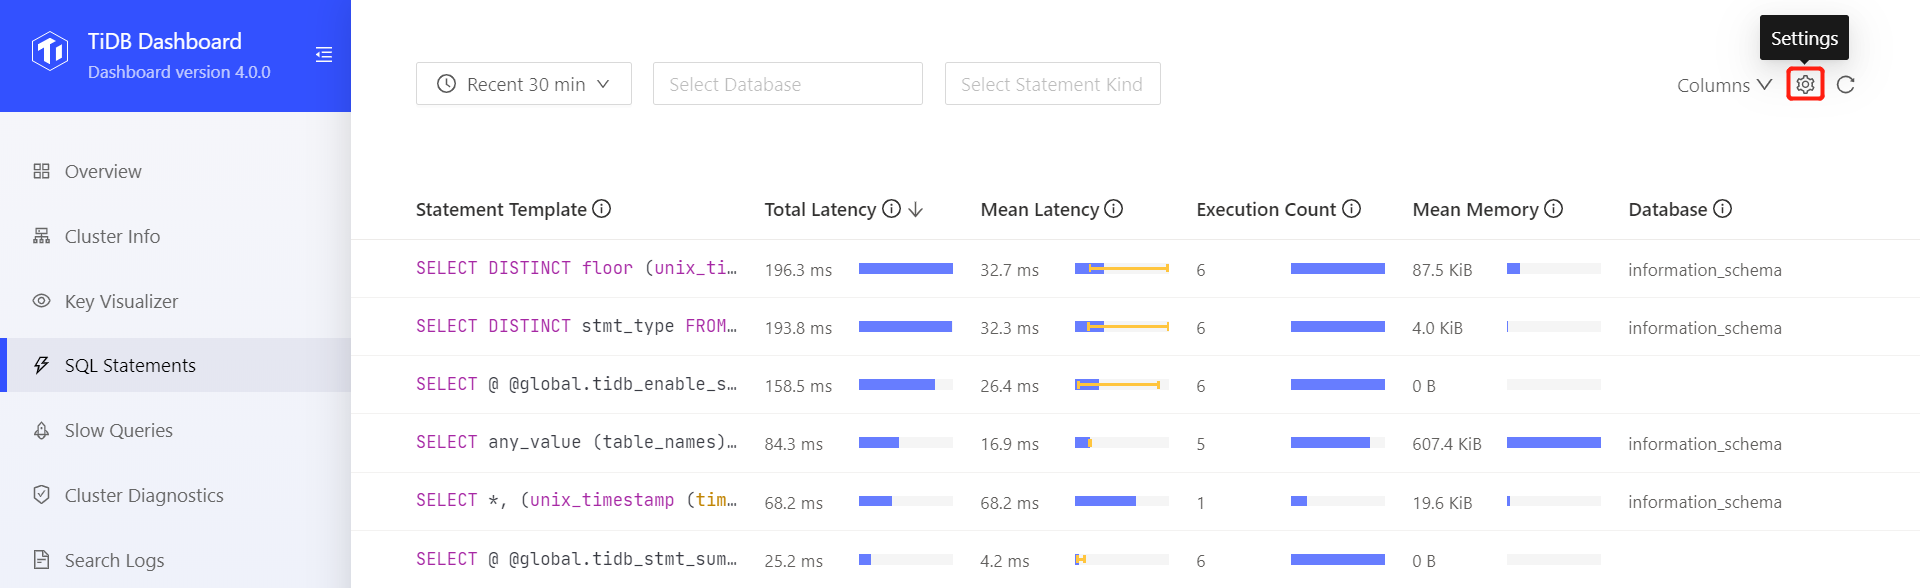
On the top of the SQL statement summary page, you can modify the time range of SQL executions to be displayed. You can also filter the list by database in which SQL statements are executed, or by SQL types. The following image shows all SQL executions over the recent data collection cycle (recent 30 minutes by default).
Display More Columns
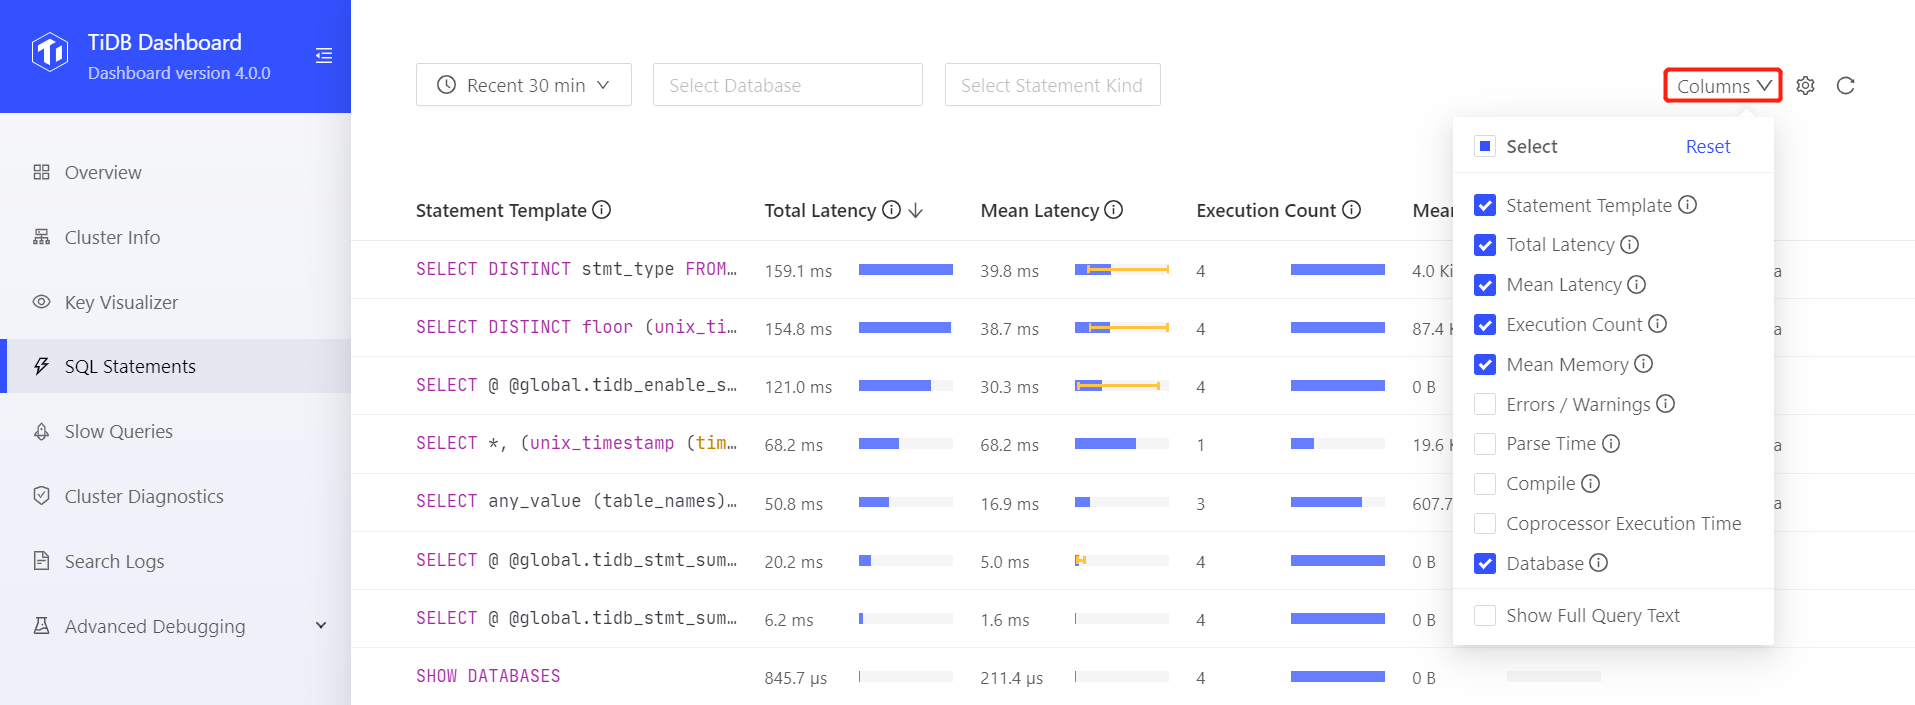
Click Columns on the page and you can choose to see more columns. You can move your mouse to the (i) icon at the right side of a column name to view the description of this column:
Sort by Column
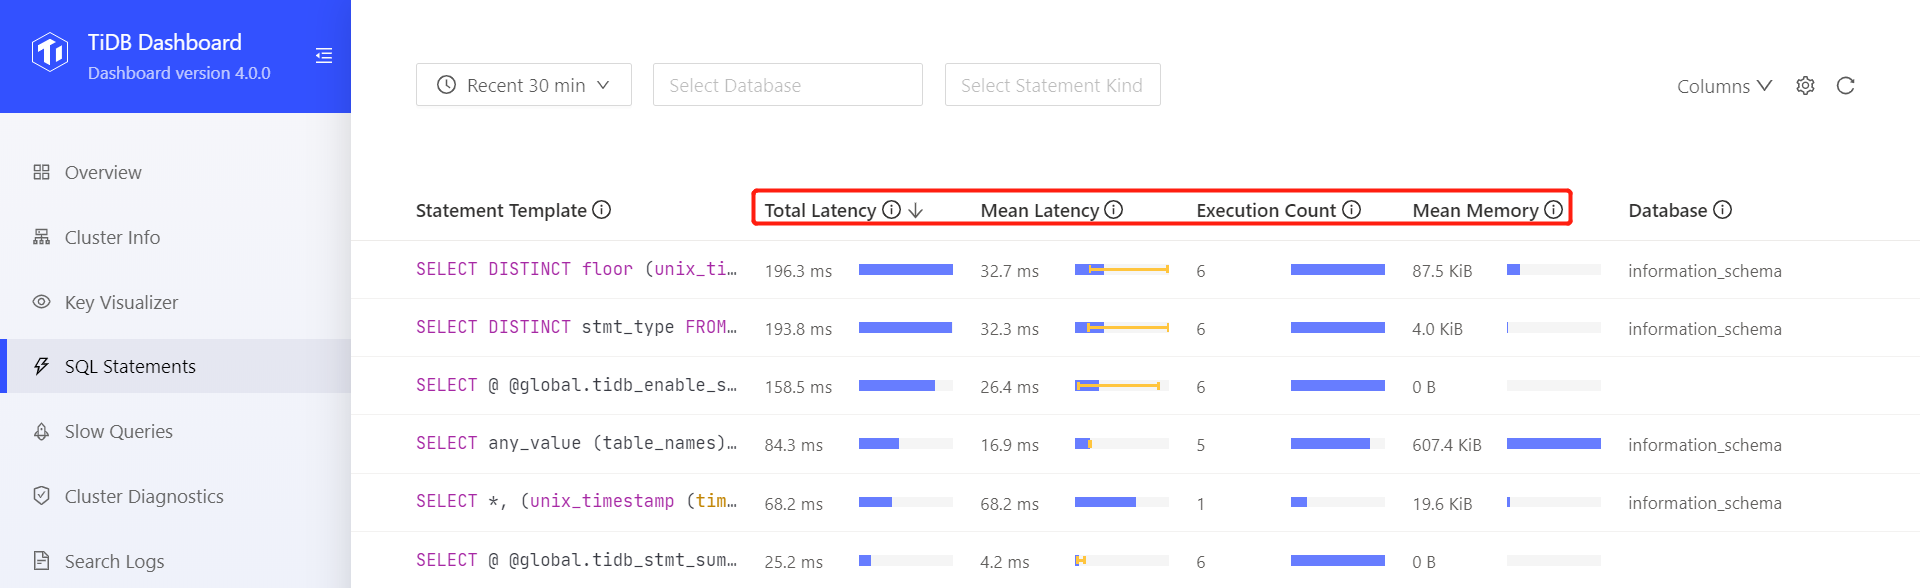
By default, the list is sorted by Total Latency from high to low. Click on different column headings to modify the sorting basis or switch the sorting order:
Change Settings
On the list page, click the Settings button on the top right to change the settings of the SQL statements feature:
After clicking the Settings button, you can see the following setting dialog box:
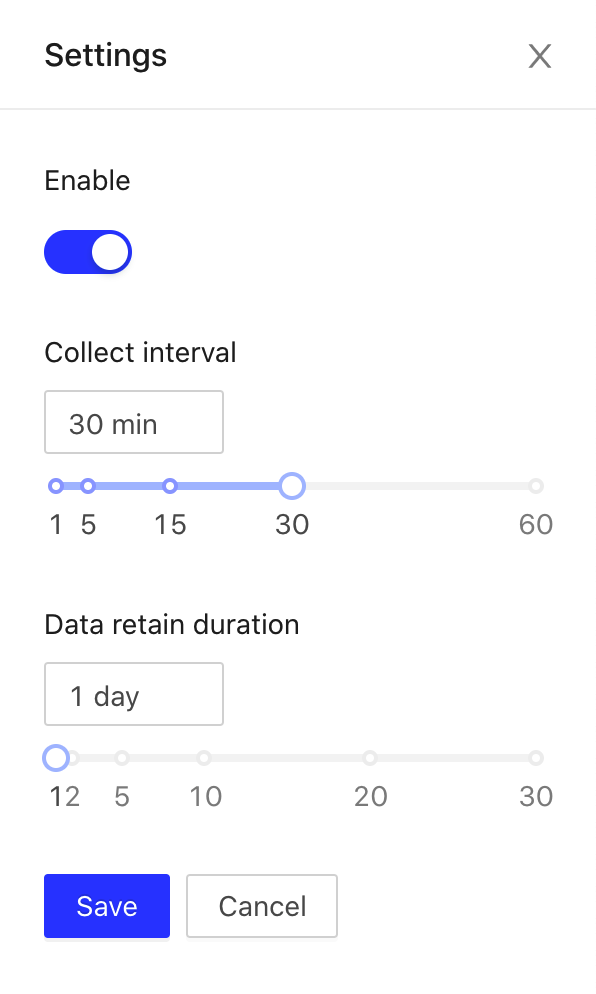
On the setting page, you can disable or enable the SQL statements feature. When the SQL statements feature is enabled, you can modify the following settings:
- Collect interval: The length of period for each SQL statement analysis, which is 30 minutes by default. The SQL statements feature summarizes and counts all SQL statements within a period of time. If the period is too long, the granularity of the summary is coarse, which is not good for locating problems; if the period is too short, the granularity of the statistics is fine, which is good for locating problems, but this will result in more records and more memory usage within the same data retention duration. Therefore, you need to adjust this value based on the actual situation, and properly lower this value when locating problems.
- Data retain duration: The retention duration of summary information, which is 1 day by default. Data retained longer than this duration will be deleted from system tables.
See Configurations of Statement Summary Tables for details.