EXPLAIN
The EXPLAIN statement shows the execution plan for a query without executing it. It is complimented by EXPLAIN ANALYZE which will execute the query. If the output of EXPLAIN does not match the expected result, consider executing ANALYZE TABLE on each table in the query.
The statements DESC and DESCRIBE are aliases of this statement. The alternative usage of EXPLAIN <tableName> is documented under SHOW [FULL] COLUMNS FROM.
TiDB supports the EXPLAIN [options] FOR CONNECTION connection_id statement. However, this statement is different from the EXPLAIN FOR statement in MySQL. For more details, see EXPLAIN FOR CONNECTION.
Synopsis
- ExplainSym
- ExplainStmt
- ExplainableStmt
ExplainSym ::=
'EXPLAIN'
| 'DESCRIBE'
| 'DESC'
ExplainStmt ::=
ExplainSym ( TableName ColumnName? | 'ANALYZE'? ExplainableStmt | 'FOR' 'CONNECTION' NUM | 'FORMAT' '=' ( stringLit | ExplainFormatType ) ( 'FOR' 'CONNECTION' NUM | ExplainableStmt ) )
ExplainableStmt ::=
SelectStmt
| DeleteFromStmt
| UpdateStmt
| InsertIntoStmt
| ReplaceIntoStmt
| UnionStmt
EXPLAIN output format
Currently, EXPLAIN in TiDB outputs 5 columns: id, estRows, task, access object, operator info. Each operator in the execution plan is described by these attributes, with each row in the EXPLAIN output describing an operator. The description of each attribute is as follows:
| Attribute name | Description |
|---|---|
| id | The operator ID is the unique identifier of the operator in the entire execution plan. In TiDB 2.1, the ID is formatted to display the tree structure of the operator. Data flows from the child node to the parent node. One and only one parent node for each operator. |
| estRows | The number of rows that the operator is expected to output. This number is estimated according to the statistics and the operator's logic. estRows is called count in the earlier versions of TiDB 4.0. |
| task | The type of task the operator belongs to. Currently, the execution plans are divided into two tasks: root task, which is executed on tidb-server, and cop task, which is performed in parallel on TiKV or TiFlash. The topology of the execution plan at the task level is that a root task followed by many cop tasks. The root task uses the output of cop tasks as input. The cop tasks refer to tasks that TiDB pushes down to TiKV or TiFlash. Each cop task is distributed in the TiKV cluster or the TiFlash cluster, and is executed by multiple processes. |
| access object | Data item information accessed by the operator. The information includes table, partition, and index (if any). Only operators that directly access the data have such information. |
| operator info | Other information about the operator. operator info of each operator is different. You can refer to the following examples. |
Examples
EXPLAIN SELECT 1;
+-------------------+---------+------+---------------+---------------+
| id                | estRows | task | access object | operator info |
+-------------------+---------+------+---------------+---------------+
| Projection_3      | 1.00    | root |               | 1->Column#1   |
| └─TableDual_4     | 1.00    | root |               | rows:1        |
+-------------------+---------+------+---------------+---------------+
2 rows in set (0.00 sec)
CREATE TABLE t1 (id INT NOT NULL PRIMARY KEY AUTO_INCREMENT, c1 INT NOT NULL);
Query OK, 0 rows affected (0.10 sec)
INSERT INTO t1 (c1) VALUES (1), (2), (3);
Query OK, 3 rows affected (0.02 sec)
Records: 3  Duplicates: 0  Warnings: 0
EXPLAIN SELECT * FROM t1 WHERE id = 1;
+-------------+---------+------+---------------+---------------+
| id          | estRows | task | access object | operator info |
+-------------+---------+------+---------------+---------------+
| Point_Get_1 | 1.00    | root | table:t1      | handle:1      |
+-------------+---------+------+---------------+---------------+
1 row in set (0.00 sec)
DESC SELECT * FROM t1 WHERE id = 1;
+-------------+---------+------+---------------+---------------+
| id          | estRows | task | access object | operator info |
+-------------+---------+------+---------------+---------------+
| Point_Get_1 | 1.00    | root | table:t1      | handle:1      |
+-------------+---------+------+---------------+---------------+
1 row in set (0.00 sec)
DESCRIBE SELECT * FROM t1 WHERE id = 1;
+-------------+---------+------+---------------+---------------+
| id          | estRows | task | access object | operator info |
+-------------+---------+------+---------------+---------------+
| Point_Get_1 | 1.00    | root | table:t1      | handle:1      |
+-------------+---------+------+---------------+---------------+
1 row in set (0.00 sec)
EXPLAIN INSERT INTO t1 (c1) VALUES (4);
+----------+---------+------+---------------+---------------+
| id       | estRows | task | access object | operator info |
+----------+---------+------+---------------+---------------+
| Insert_1 | N/A     | root |               | N/A           |
+----------+---------+------+---------------+---------------+
1 row in set (0.00 sec)
EXPLAIN UPDATE t1 SET c1=5 WHERE c1=3;
+---------------------------+---------+-----------+---------------+--------------------------------+
| id                        | estRows | task      | access object | operator info                  |
+---------------------------+---------+-----------+---------------+--------------------------------+
| Update_4                  | N/A     | root      |               | N/A                            |
| └─TableReader_8           | 0.00    | root      |               | data:Selection_7               |
|   └─Selection_7           | 0.00    | cop[tikv] |               | eq(test.t1.c1, 3)              |
|     └─TableFullScan_6     | 3.00    | cop[tikv] | table:t1      | keep order:false, stats:pseudo |
+---------------------------+---------+-----------+---------------+--------------------------------+
4 rows in set (0.00 sec)
EXPLAIN DELETE FROM t1 WHERE c1=3;
+---------------------------+---------+-----------+---------------+--------------------------------+
| id                        | estRows | task      | access object | operator info                  |
+---------------------------+---------+-----------+---------------+--------------------------------+
| Delete_4                  | N/A     | root      |               | N/A                            |
| └─TableReader_8           | 0.00    | root      |               | data:Selection_7               |
|   └─Selection_7           | 0.00    | cop[tikv] |               | eq(test.t1.c1, 3)              |
|     └─TableFullScan_6     | 3.00    | cop[tikv] | table:t1      | keep order:false, stats:pseudo |
+---------------------------+---------+-----------+---------------+--------------------------------+
4 rows in set (0.01 sec)
If you do not specify the FORMAT, or specify FORMAT = "row", EXPLAIN statement will output the results in a tabular format. See Understand the Query Execution Plan for more information.
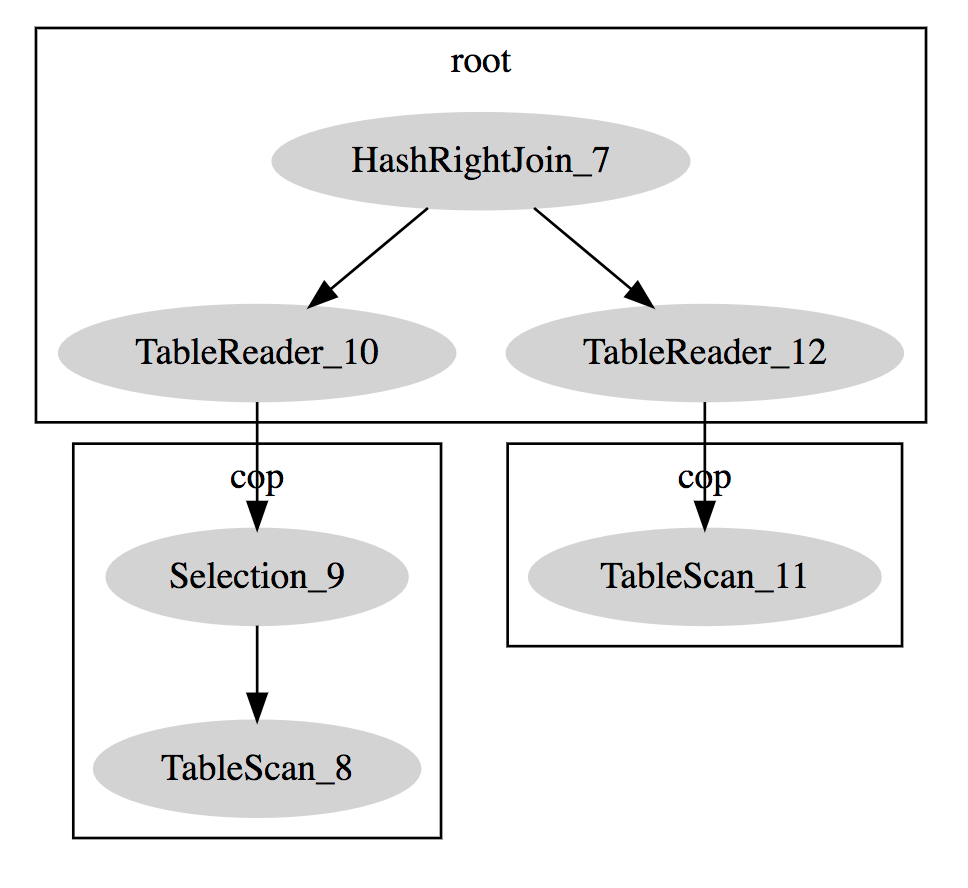
In addition to the MySQL standard result format, TiDB also supports DotGraph and you need to specify FORMAT = "dot" as in the following example:
create table t(a bigint, b bigint);
desc format = "dot" select A.a, B.b from t A join t B on A.a > B.b where A.a < 10;
+-----------------------------------------------------------------------------------------------------------------------------------------------------------------------------------------------------------------------------------------------------------------------------------------------------------------------------------------------------------------------------------------------------------------------------------------------------------------------------------------------------------------------------------------------------------------------------+
| dot contents                                                                                                                                                                                                                                                                                                                                                                                                                                                                                                                                                                |
+-----------------------------------------------------------------------------------------------------------------------------------------------------------------------------------------------------------------------------------------------------------------------------------------------------------------------------------------------------------------------------------------------------------------------------------------------------------------------------------------------------------------------------------------------------------------------------+
|
digraph Projection_8 {
subgraph cluster8{
node [style=filled, color=lightgrey]
color=black
label = "root"
"Projection_8" -> "HashJoin_9"
"HashJoin_9" -> "TableReader_13"
"HashJoin_9" -> "Selection_14"
"Selection_14" -> "TableReader_17"
}
subgraph cluster12{
node [style=filled, color=lightgrey]
color=black
label = "cop"
"Selection_12" -> "TableFullScan_11"
}
subgraph cluster16{
node [style=filled, color=lightgrey]
color=black
label = "cop"
"Selection_16" -> "TableFullScan_15"
}
"TableReader_13" -> "Selection_12"
"TableReader_17" -> "Selection_16"
}
 |
+-----------------------------------------------------------------------------------------------------------------------------------------------------------------------------------------------------------------------------------------------------------------------------------------------------------------------------------------------------------------------------------------------------------------------------------------------------------------------------------------------------------------------------------------------------------------------------+
1 row in set (0.00 sec)
If the dot program (in the graphviz package) is installed on your computer, you can generate a PNG file using the following method:
dot xx.dot -T png -O

The xx.dot is the result returned by the above statement.
If the dot program is not installed on your computer, copy the result to this website to get a tree diagram:
MySQL compatibility
- Both the format of
EXPLAINand the potential execution plans in TiDB differ substaintially from MySQL. - TiDB does not support the
EXPLAIN FORMAT=JSONas in MySQL. - TiDB does not currently support
EXPLAINfor insert statements.
EXPLAIN FOR CONNECTION
EXPLAIN FOR CONNECTION is used to get the execution plan of the currently executed SQL query or the last executed SQL query in a connection. The output format is the same as that of EXPLAIN. However, the implementation of EXPLAIN FOR CONNECTION in TiDB is different from that in MySQL. Their differences (apart from the output format) are listed as follows:
- If the connection is sleeping, MySQL returns an empty result, while TiDB returns the last executed query plan.
- If you try to get the execution plan of the current session, MySQL returns an error, while TiDB returns the result normally.
- MySQL requires the login user to be the same as the connection being queried, or the login user has the
PROCESSprivilege; while TiDB requires the login user to be the same as the connection being queried, or the login user has theSUPERprivilege.