- About TiDB
- Quick Start
- Deploy
- Software and Hardware Requirements
- Environment Configuration Checklist
- Topology Patterns
- Install and Start
- Verify Cluster Status
- Benchmarks Methods
- Migrate
- Maintain
- Monitor and Alert
- Troubleshoot
- TiDB Troubleshooting Map
- Identify Slow Queries
- Analyze Slow Queries
- SQL Diagnostics
- Identify Expensive Queries
- Statement Summary Tables
- Troubleshoot Hotspot Issues
- Troubleshoot Increased Read and Write Latency
- Troubleshoot Cluster Setup
- Troubleshoot High Disk I/O Usage
- Troubleshoot Lock Conflicts
- Troubleshoot TiFlash
- Troubleshoot Write Conflicts in Optimistic Transactions
- Performance Tuning
- System Tuning
- Software Tuning
- SQL Tuning
- Overview
- Understanding the Query Execution Plan
- SQL Optimization Process
- Overview
- Logic Optimization
- Physical Optimization
- Prepare Execution Plan Cache
- Control Execution Plans
- Tutorials
- TiDB Tools
- Overview
- Use Cases
- Download
- TiUP
- TiDB Operator
- Backup & Restore (BR)
- TiDB Binlog
- TiDB Lightning
- TiDB Data Migration
- TiCDC
- Dumpling
- sync-diff-inspector
- Loader
- Mydumper
- Syncer
- TiSpark
- Reference
- Cluster Architecture
- Key Monitoring Metrics
- Secure
- Privileges
- SQL
- SQL Language Structure and Syntax
- SQL Statements
ADD COLUMN
ADD INDEX
ADMIN
ADMIN CANCEL DDL
ADMIN CHECKSUM TABLE
ADMIN CHECK [TABLE|INDEX]
ADMIN SHOW DDL [JOBS|QUERIES]
ALTER DATABASE
ALTER INSTANCE
ALTER TABLE
ALTER USER
ANALYZE TABLE
BACKUP
BEGIN
CHANGE COLUMN
COMMIT
CHANGE DRAINER
CHANGE PUMP
CREATE [GLOBAL|SESSION] BINDING
CREATE DATABASE
CREATE INDEX
CREATE ROLE
CREATE SEQUENCE
CREATE TABLE LIKE
CREATE TABLE
CREATE USER
CREATE VIEW
DEALLOCATE
DELETE
DESC
DESCRIBE
DO
DROP [GLOBAL|SESSION] BINDING
DROP COLUMN
DROP DATABASE
DROP INDEX
DROP ROLE
DROP SEQUENCE
DROP STATS
DROP TABLE
DROP USER
DROP VIEW
EXECUTE
EXPLAIN ANALYZE
EXPLAIN
FLASHBACK TABLE
FLUSH PRIVILEGES
FLUSH STATUS
FLUSH TABLES
GRANT <privileges>
GRANT <role>
INSERT
KILL [TIDB]
LOAD DATA
LOAD STATS
MODIFY COLUMN
PREPARE
RECOVER TABLE
RENAME INDEX
RENAME TABLE
REPLACE
RESTORE
REVOKE <privileges>
REVOKE <role>
ROLLBACK
SELECT
SET DEFAULT ROLE
SET [NAMES|CHARACTER SET]
SET PASSWORD
SET ROLE
SET TRANSACTION
SET [GLOBAL|SESSION] <variable>
SHOW ANALYZE STATUS
SHOW [BACKUPS|RESTORES]
SHOW [GLOBAL|SESSION] BINDINGS
SHOW BUILTINS
SHOW CHARACTER SET
SHOW COLLATION
SHOW [FULL] COLUMNS FROM
SHOW CONFIG
SHOW CREATE SEQUENCE
SHOW CREATE TABLE
SHOW CREATE USER
SHOW DATABASES
SHOW DRAINER STATUS
SHOW ENGINES
SHOW ERRORS
SHOW [FULL] FIELDS FROM
SHOW GRANTS
SHOW INDEX [FROM|IN]
SHOW INDEXES [FROM|IN]
SHOW KEYS [FROM|IN]
SHOW MASTER STATUS
SHOW PLUGINS
SHOW PRIVILEGES
SHOW [FULL] PROCESSSLIST
SHOW PROFILES
SHOW PUMP STATUS
SHOW SCHEMAS
SHOW STATS_HEALTHY
SHOW STATS_HISTOGRAMS
SHOW STATS_META
SHOW STATUS
SHOW TABLE NEXT_ROW_ID
SHOW TABLE REGIONS
SHOW TABLE STATUS
SHOW [FULL] TABLES
SHOW [GLOBAL|SESSION] VARIABLES
SHOW WARNINGS
SHUTDOWN
SPLIT REGION
START TRANSACTION
TRACE
TRUNCATE
UPDATE
USE
- Data Types
- Functions and Operators
- Overview
- Type Conversion in Expression Evaluation
- Operators
- Control Flow Functions
- String Functions
- Numeric Functions and Operators
- Date and Time Functions
- Bit Functions and Operators
- Cast Functions and Operators
- Encryption and Compression Functions
- Information Functions
- JSON Functions
- Aggregate (GROUP BY) Functions
- Window Functions
- Miscellaneous Functions
- Precision Math
- List of Expressions for Pushdown
- Constraints
- Generated Columns
- SQL Mode
- Transactions
- Garbage Collection (GC)
- Views
- Partitioning
- Character Set and Collation
- System Tables
mysql
- INFORMATION_SCHEMA
- Overview
ANALYZE_STATUS
CHARACTER_SETS
CLUSTER_CONFIG
CLUSTER_HARDWARE
CLUSTER_INFO
CLUSTER_LOAD
CLUSTER_LOG
CLUSTER_SYSTEMINFO
COLLATIONS
COLLATION_CHARACTER_SET_APPLICABILITY
COLUMNS
DDL_JOBS
ENGINES
INSPECTION_RESULT
INSPECTION_RULES
INSPECTION_SUMMARY
KEY_COLUMN_USAGE
METRICS_SUMMARY
METRICS_TABLES
PARTITIONS
PROCESSLIST
SCHEMATA
SEQUENCES
SESSION_VARIABLES
SLOW_QUERY
STATISTICS
TABLES
TABLE_CONSTRAINTS
TABLE_STORAGE_STATS
TIDB_HOT_REGIONS
TIDB_INDEXES
TIDB_SERVERS_INFO
TIFLASH_REPLICA
TIKV_REGION_PEERS
TIKV_REGION_STATUS
TIKV_STORE_STATUS
USER_PRIVILEGES
VIEWS
METRICS_SCHEMA
- UI
- TiDB Dashboard
- Overview
- Maintain
- Access
- Overview Page
- Cluster Info Page
- Key Visualizer Page
- Metrics Relation Graph
- SQL Statements Analysis
- Slow Queries Page
- Cluster Diagnostics
- Search Logs Page
- Profile Instances Page
- Session Management and Configuration
- FAQ
- CLI
- Command Line Flags
- Configuration File Parameters
- System Variables
- Storage Engines
- Telemetry
- Errors Codes
- Table Filter
- Schedule Replicas by Topology Labels
- FAQs
- Release Notes
- All Releases
- v4.0
- v3.1
- v3.0
- v2.1
- v2.0
- v1.0
- Glossary
TiDB Dashboard Cluster Information Page
On the cluster information page, you can view the running status of TiDB, TiKV, PD, TiFlash components in the entire cluster and the running status of the host on which these components are located.
Access the page
You can use one of the following two methods to access the cluster information page:
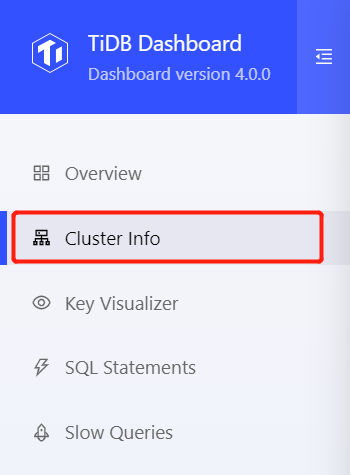
After logging into TiDB Dashboard, click Cluster Info on the left navigation menu:
Visit http://127.0.0.1:2379/dashboard/#/cluster_info/instance in your browser. Replace
127.0.0.1:2379
with the actual PD instance address and port.
Instance list
Click Instances to view the list of instances:
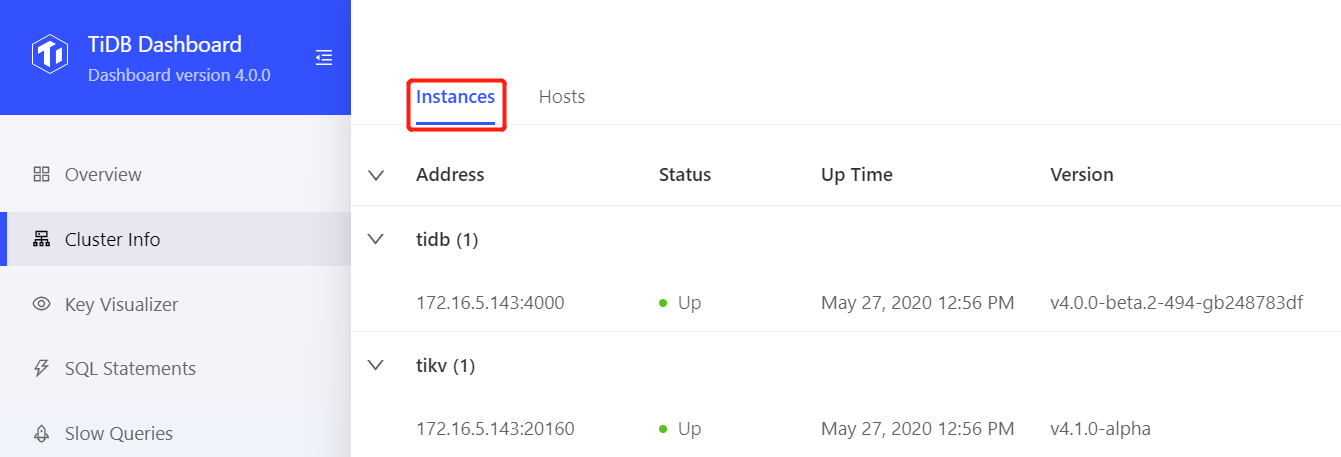
This instance list shows the overview information of all instances of TiDB, TiKV, PD, and TiFlash components in the cluster.
The list includes the following information:
- Address: The instance address.
- Status: The running status of the instance.
- Up Time: The start time of the instance.
- Version: The instance version number.
- Deployment directory: The directory in which the instance binary file is located.
- Git Hash: The Git Hash value corresponding to the instance binary file.
An instance has the following running status:
- Up: The instance is running properly.
- Down or Unreachable: The instance is not started or a network problem exists on the corresponding host.
- Tombstone: The data on the instance has been completely migrated out and the scaling-in is complete. This status exists only on TiKV or TiFlash instances.
- Leaving: The data on the instance is being migrated out and the scaling-in is in process. This status exists only on TiKV or TiFlash instances.
- Unknown: The running state of the instance is unknown.
Some columns in the table can be displayed only when the instance is up.
Host list
Click Hosts to view the list of hosts:
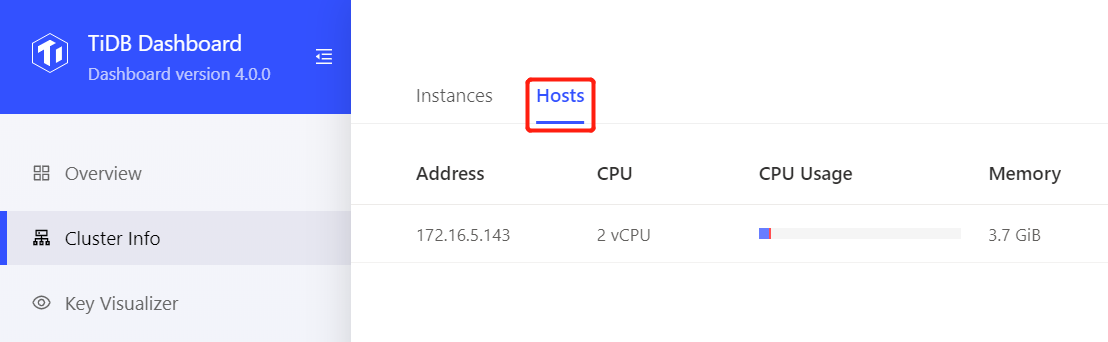
This host list shows the running status of hosts that correspond to all instances of TiDB, TiKV, PD, and TiFlash components in the cluster.
The list includes the following information:
- Address: The Host IP address.
- CPU: The number of logical cores of the host CPU.
- CPU Usage: The user-mode and kernel-mode CPU usage in the current 1 second.
- Memory: The total physical memory size of the host.
- Memory Usage: The current memory usage of the host.
- Disk: The file system of the disk on the host on which the instance is running and the mounting path of this disk.
- Disk Usage: The space usage of the disk on the host on which the instance is running.
The host list information is provided by each instance process, so when all instances on the host are down, the host information is not displayed.