Daily Check
As a distributed database, TiDB is more complicated than the stand-alone database in terms of the mechanism, and monitoring items. To help operate and maintain TiDB in a more convenient way, this document introduces some key performance indicators.
Key indicators of TiDB Dashboard
Starting from v4.0, TiDB provides a new operation and maintenance management tool, TiDB Dashboard. This tool is integrated into the PD component. You can access TiDB Dashboard at the default address http://${pd-ip}:${pd_port}/dashboard.
TiDB Dashboard simplifies the operation and maintenance of the TiDB database. You can view the running status of the entire TiDB cluster through one interface. The following are descriptions of some performance indicators.
Instance panel
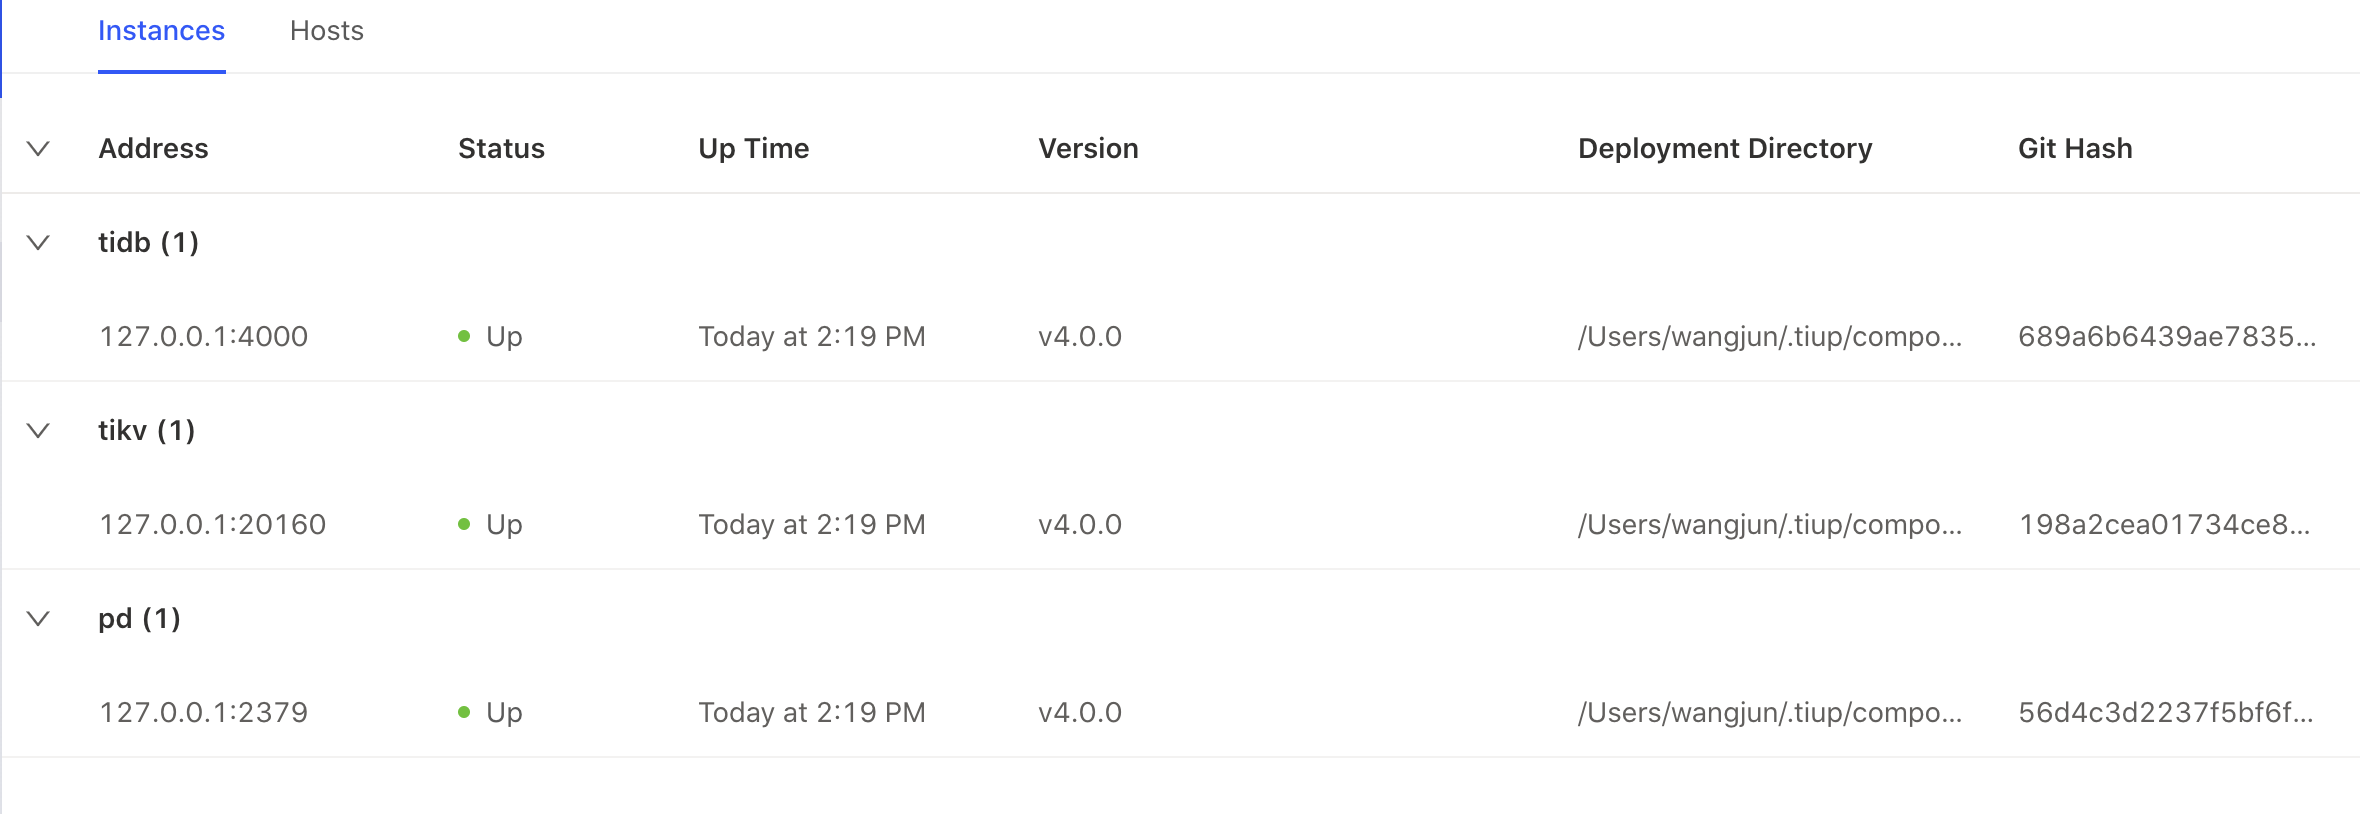
- Status: This indicator is used to check whether the status is normal. For an online node, this can be ignored.
- Up Time: The key indicator. If you find that the
Up Timeis changed, you need to locate the reason why the component is restarted. - Version, Deployment Directory, Git Hash: These indicators need to be checked to avoid inconsistent or even incorrect version/deployment directory.
Host panel
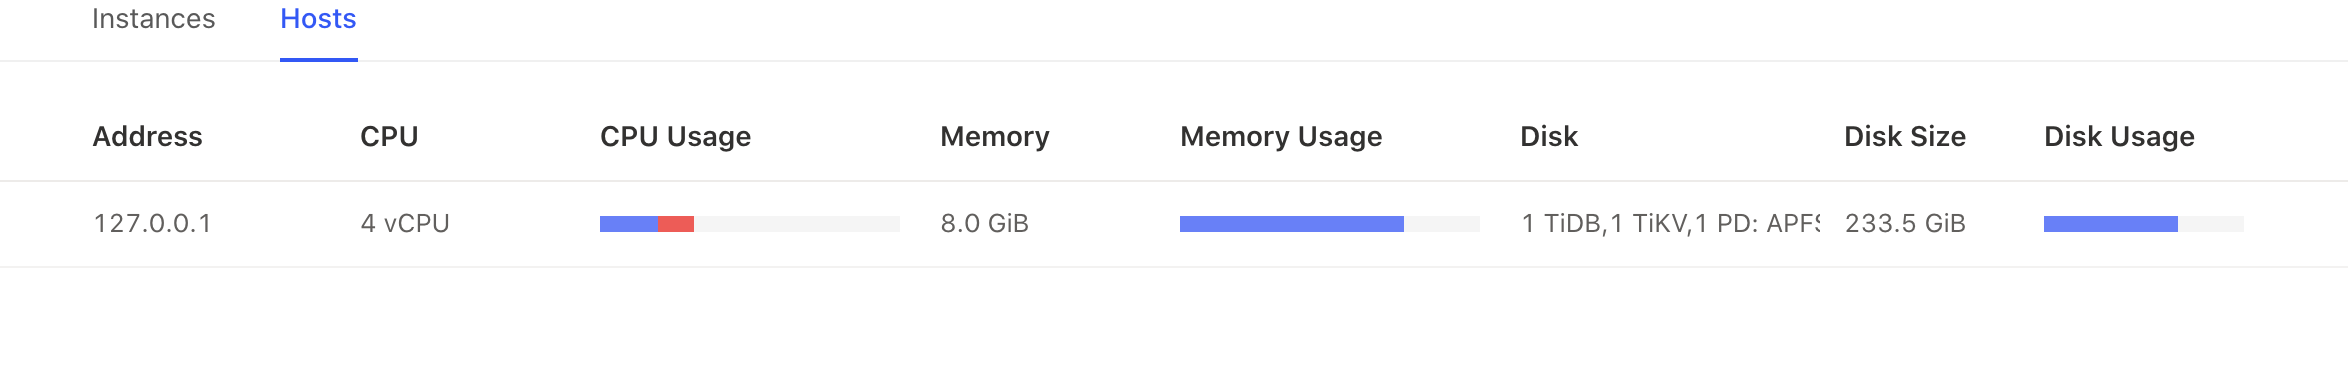
You can view the usage of CPU, memory, and disk. When the usage of any resource exceeds 80%, it is recommended to scale out the capacity accordingly.
SQL analysis panel
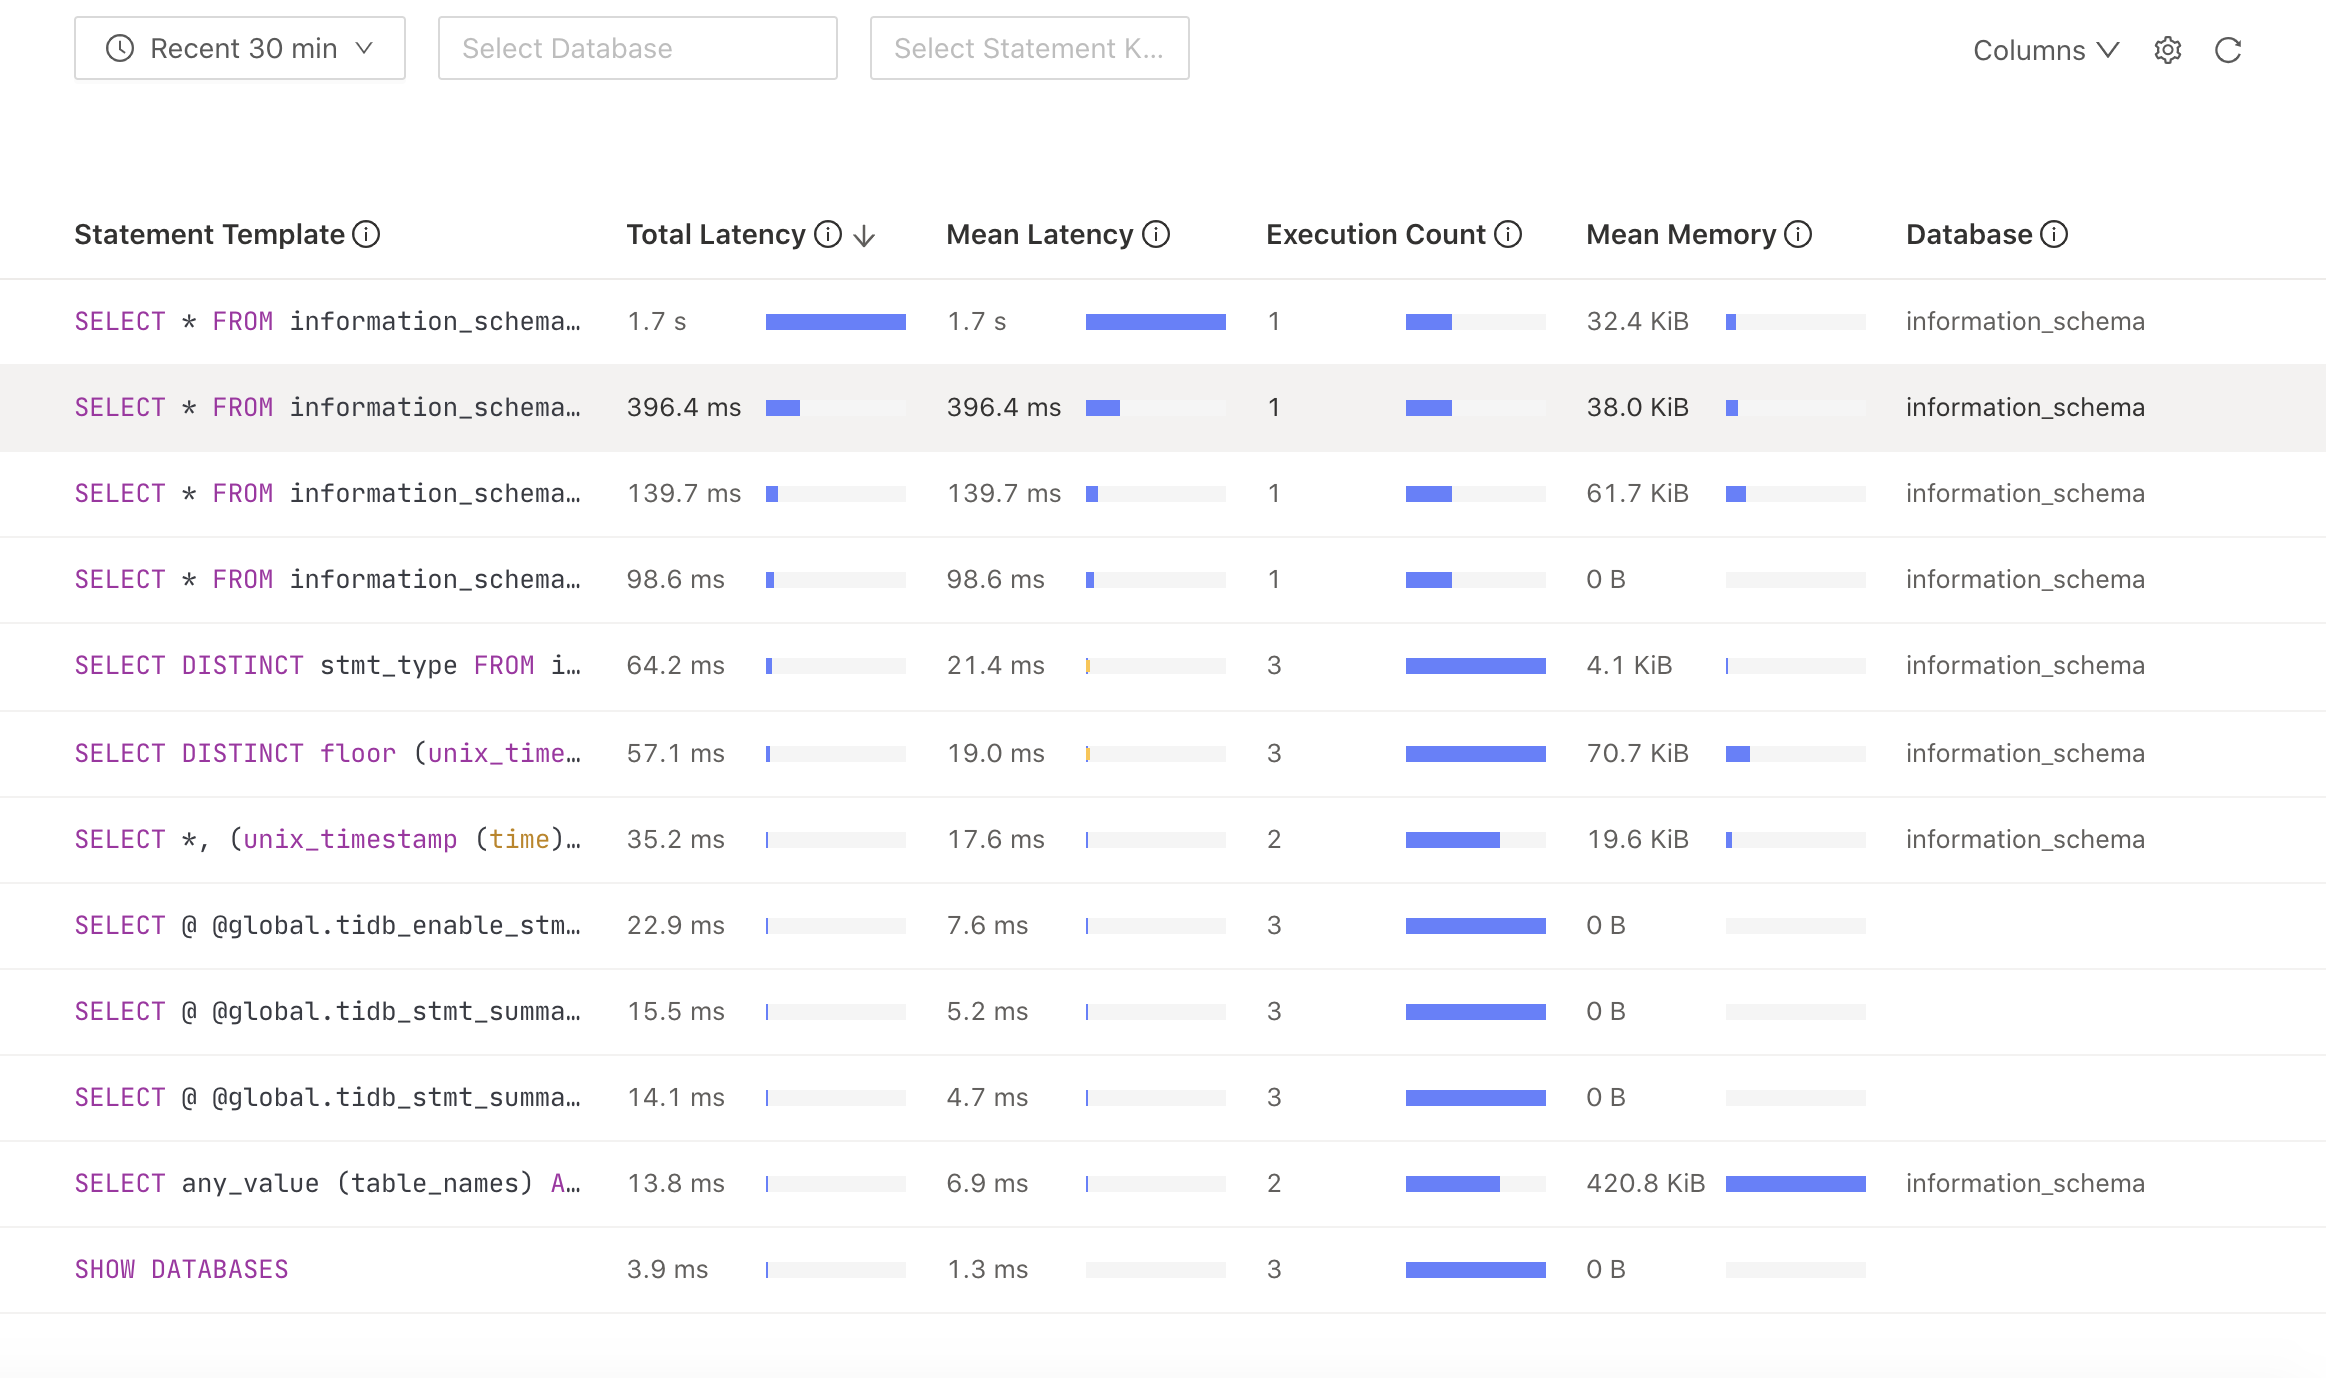
You can locate the slow SQL statement executed in the cluster. Then you can optimize the specific SQL statement.
Region panel
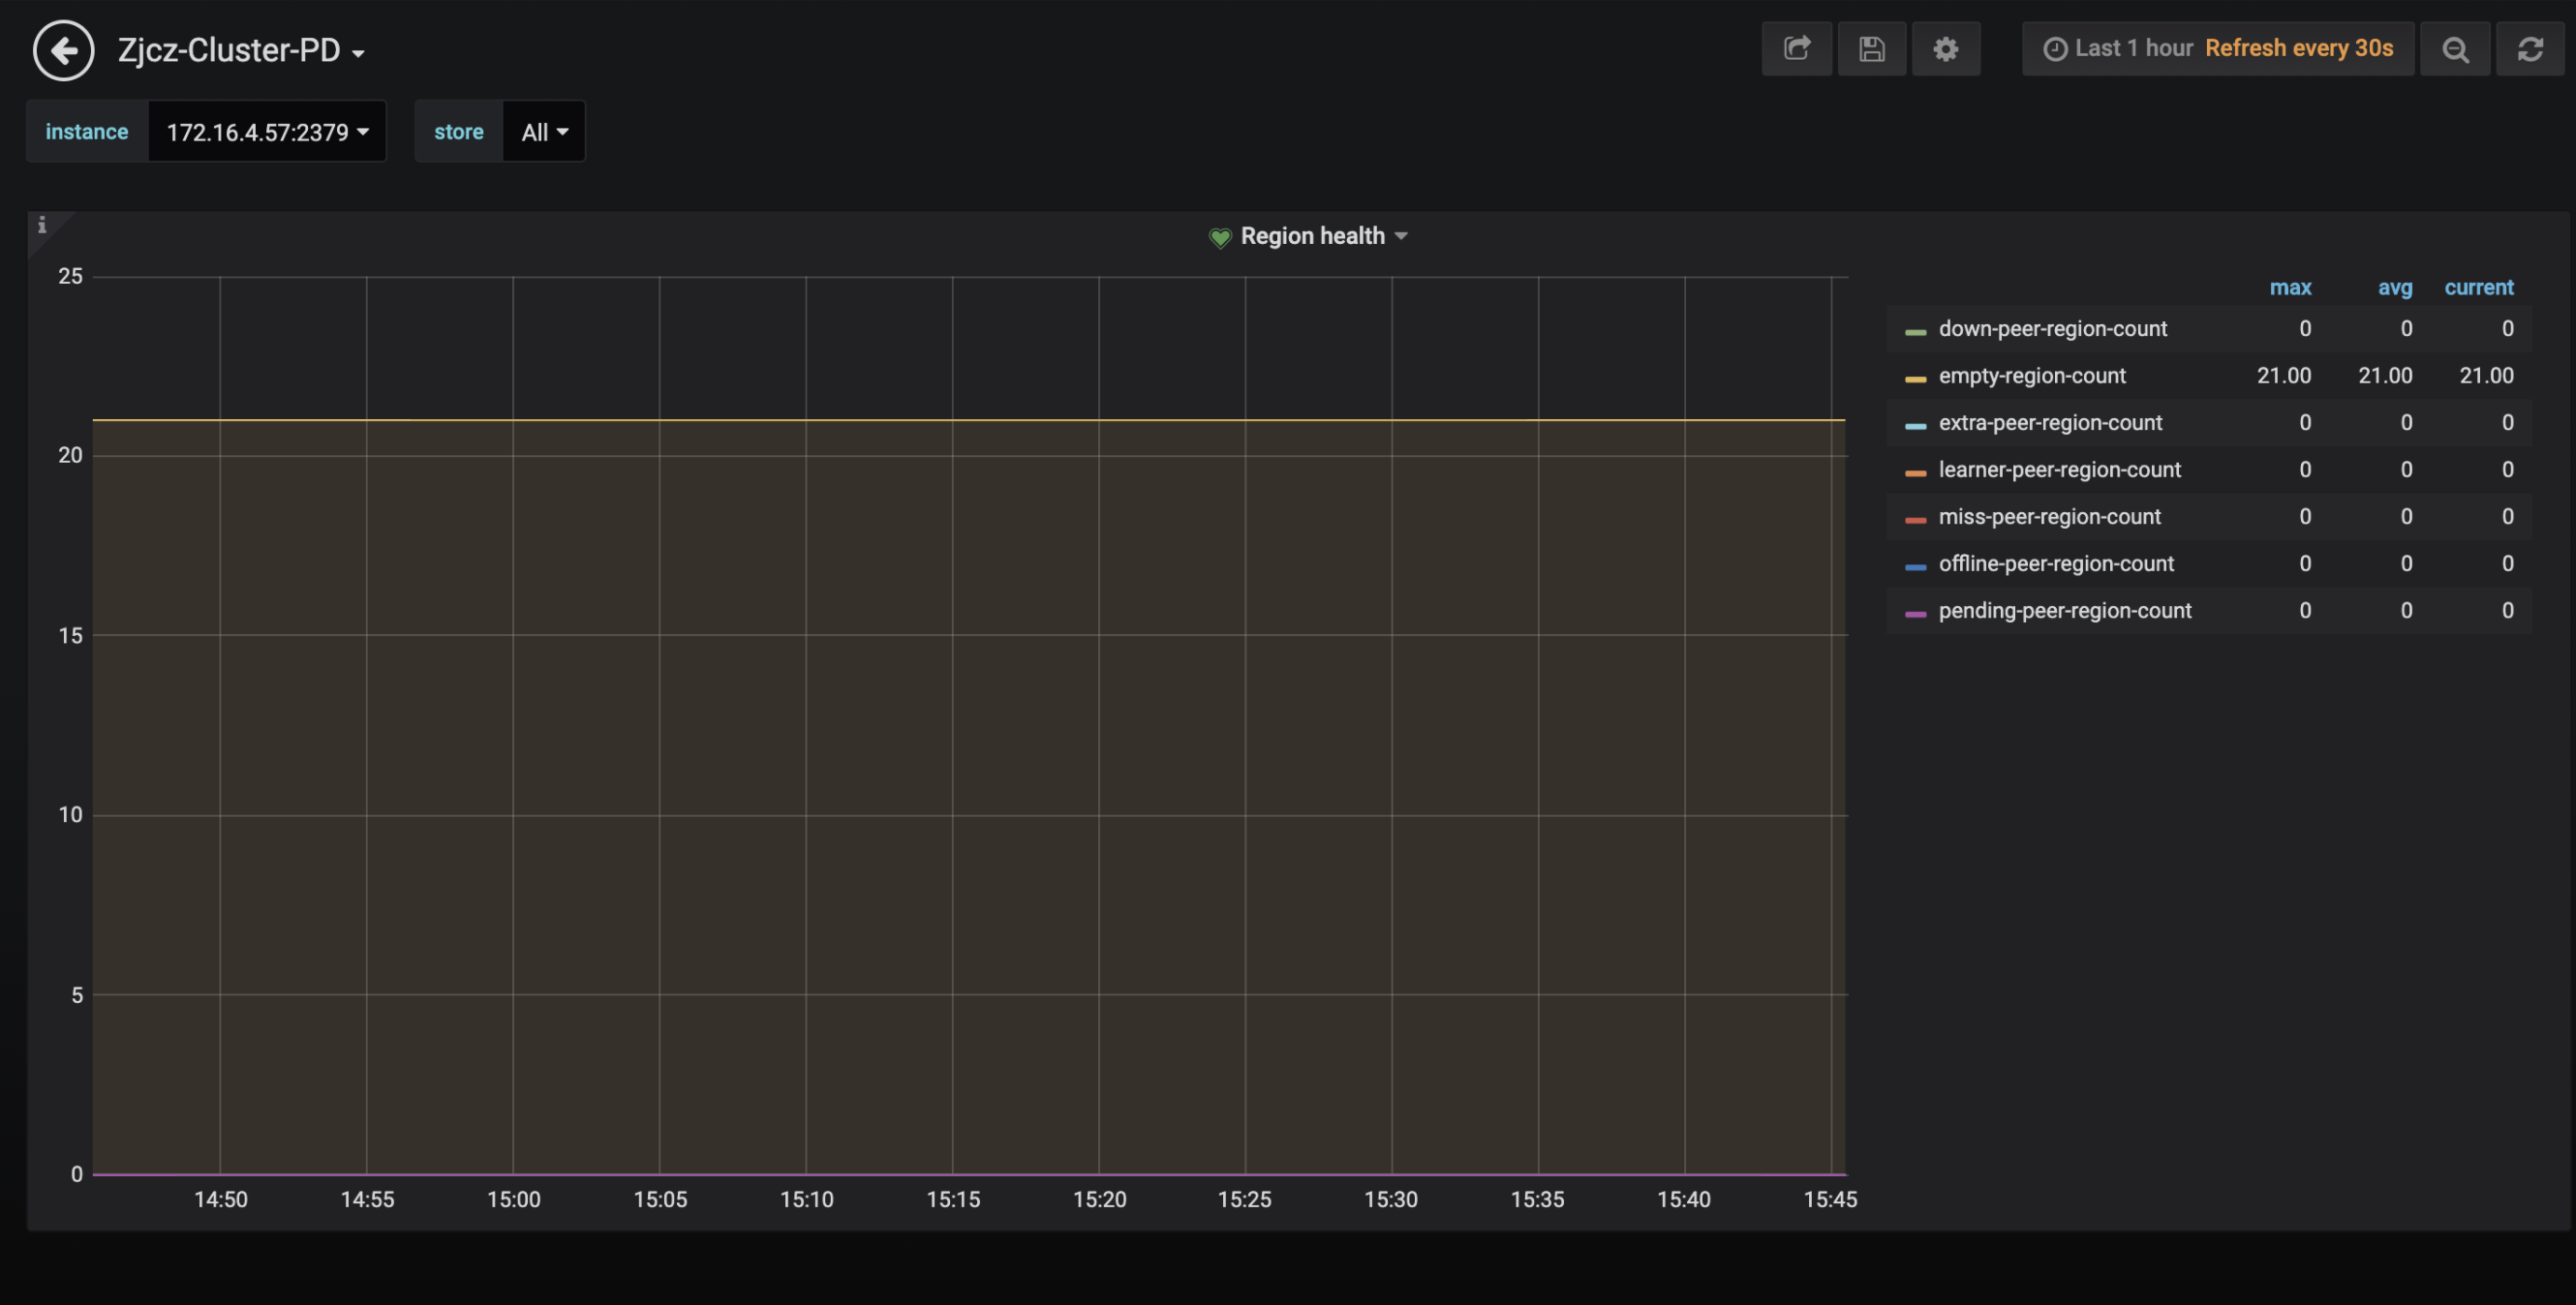
miss-peer-region-count: The number of Regions without enough replicas. This value is not always greater than0.extra-peer-region-count: The number of Regions with extra replicas. These Regions are generated during the scheduling process.empty-region-count: The number of empty Regions, generated by executing theTRUNCATE TABLE/DROP TABLEstatement. If this number is large, you can consider enablingRegion Mergeto merge Regions across tables.pending-peer-region-count: The number of Regions with outdated Raft logs. It is normal that a few pending peers are generated in the scheduling process. However, it is not normal if this value is large for a period of time.down-peer-region-count: The number of Regions with an unresponsive peer reported by the Raft leader.offline-peer-region-count: The number of Regions during the offline process.
Generally, it is normal that these values are not 0. However, it is not normal that they are not 0 for quite a long time.
KV Request Duration
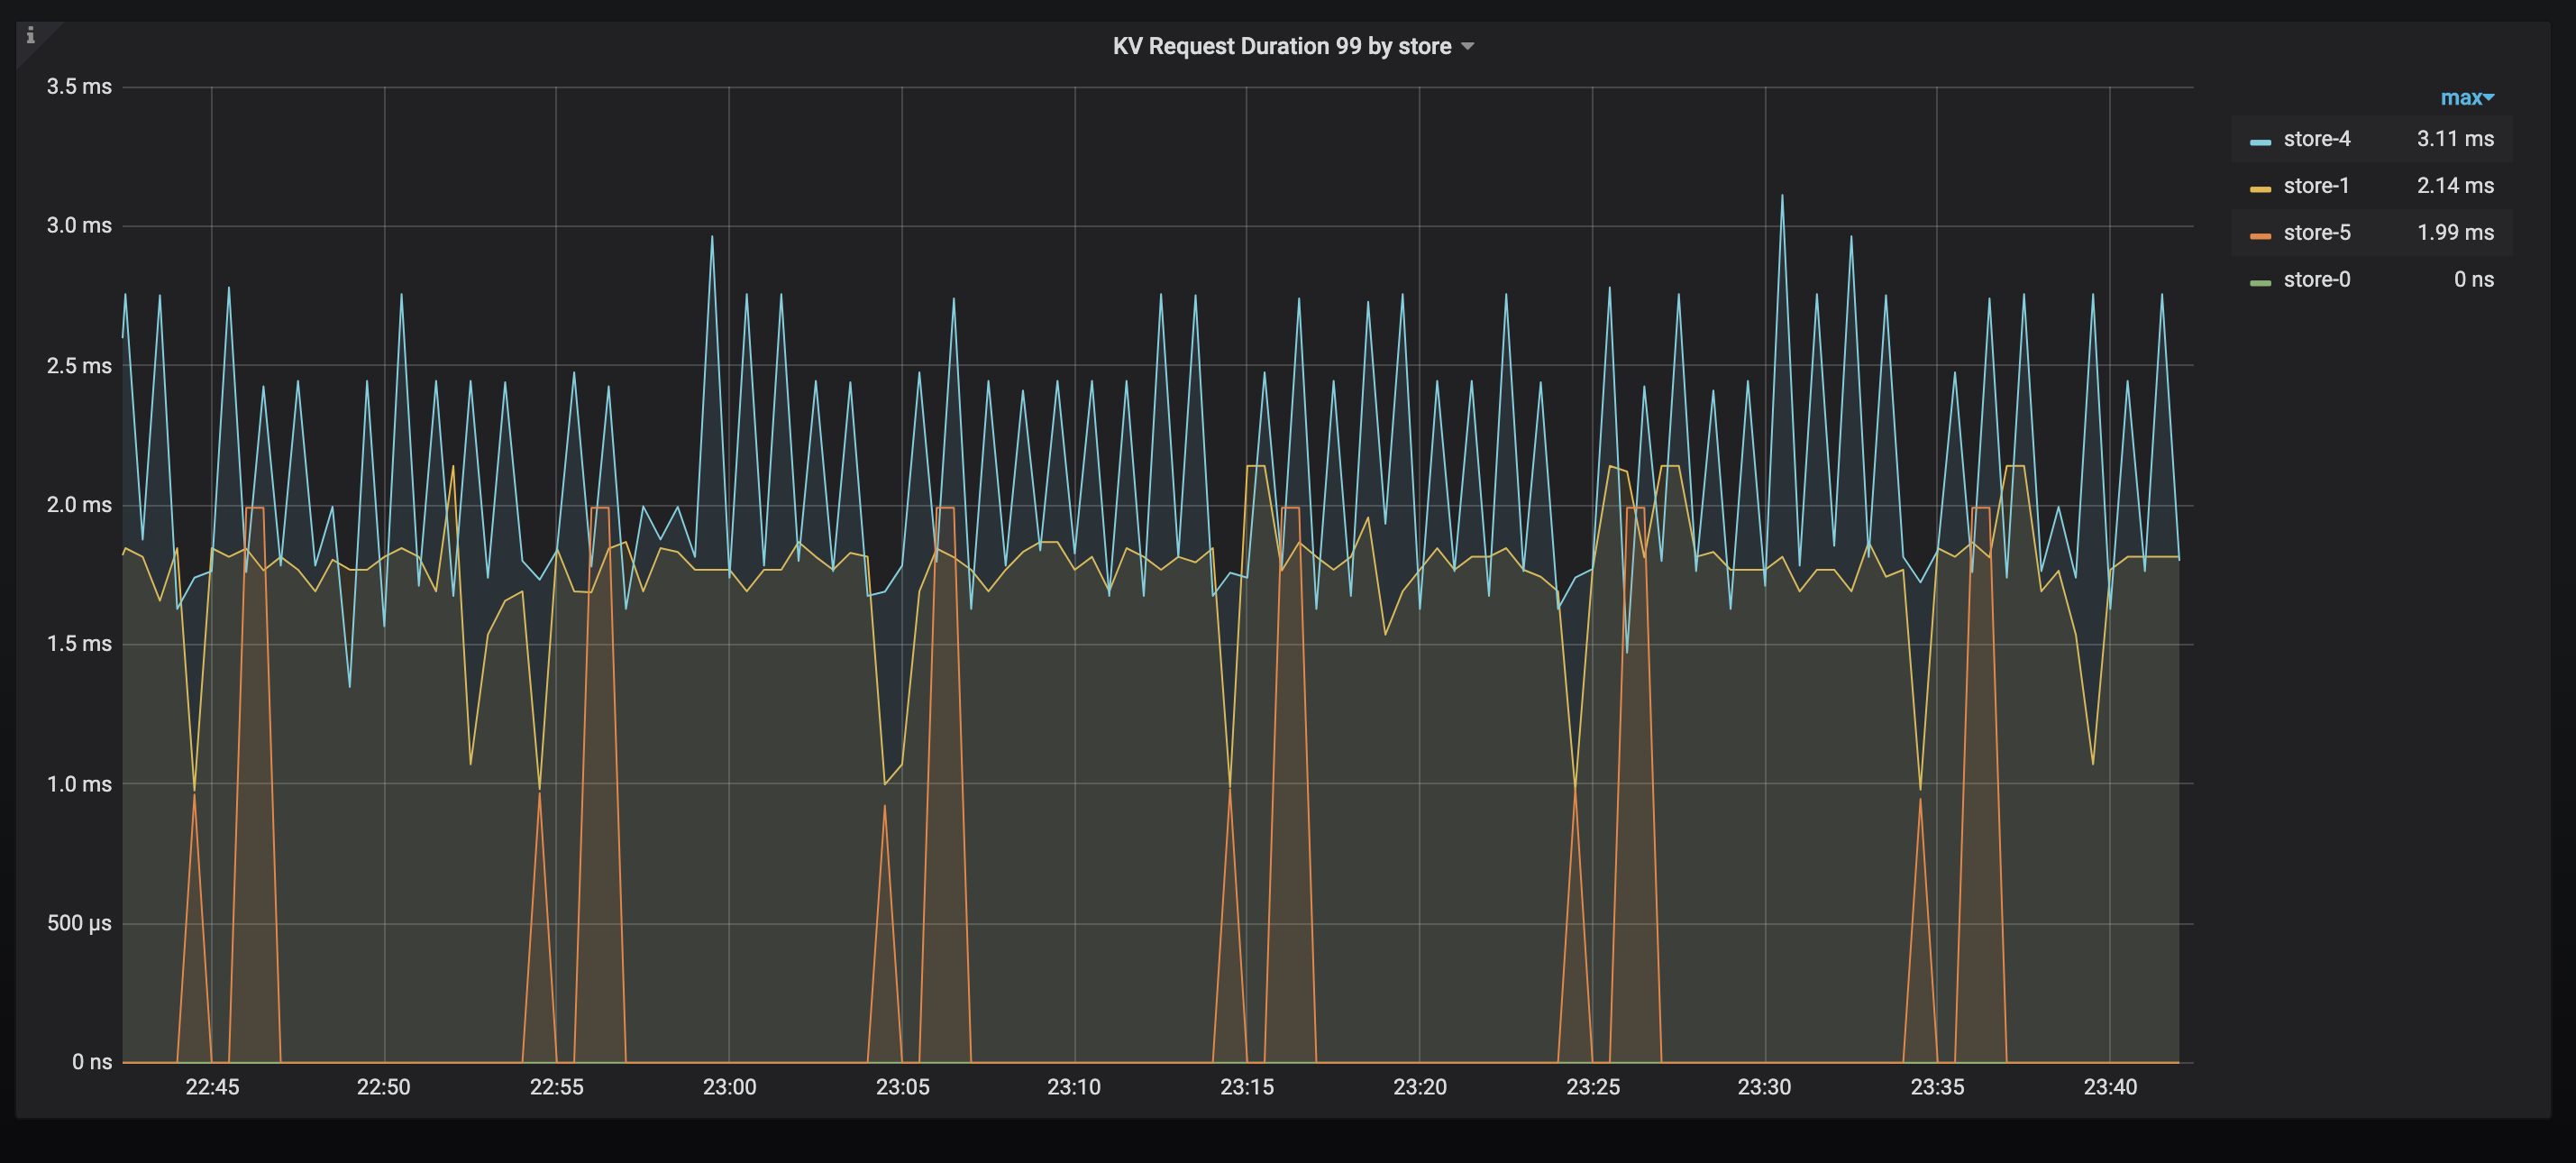
The KV request duration 99 in TiKV. If you find nodes with a long duration, check whether there are hot spots, or whether there are nodes with poor performance.
PD TSO Wait Duration
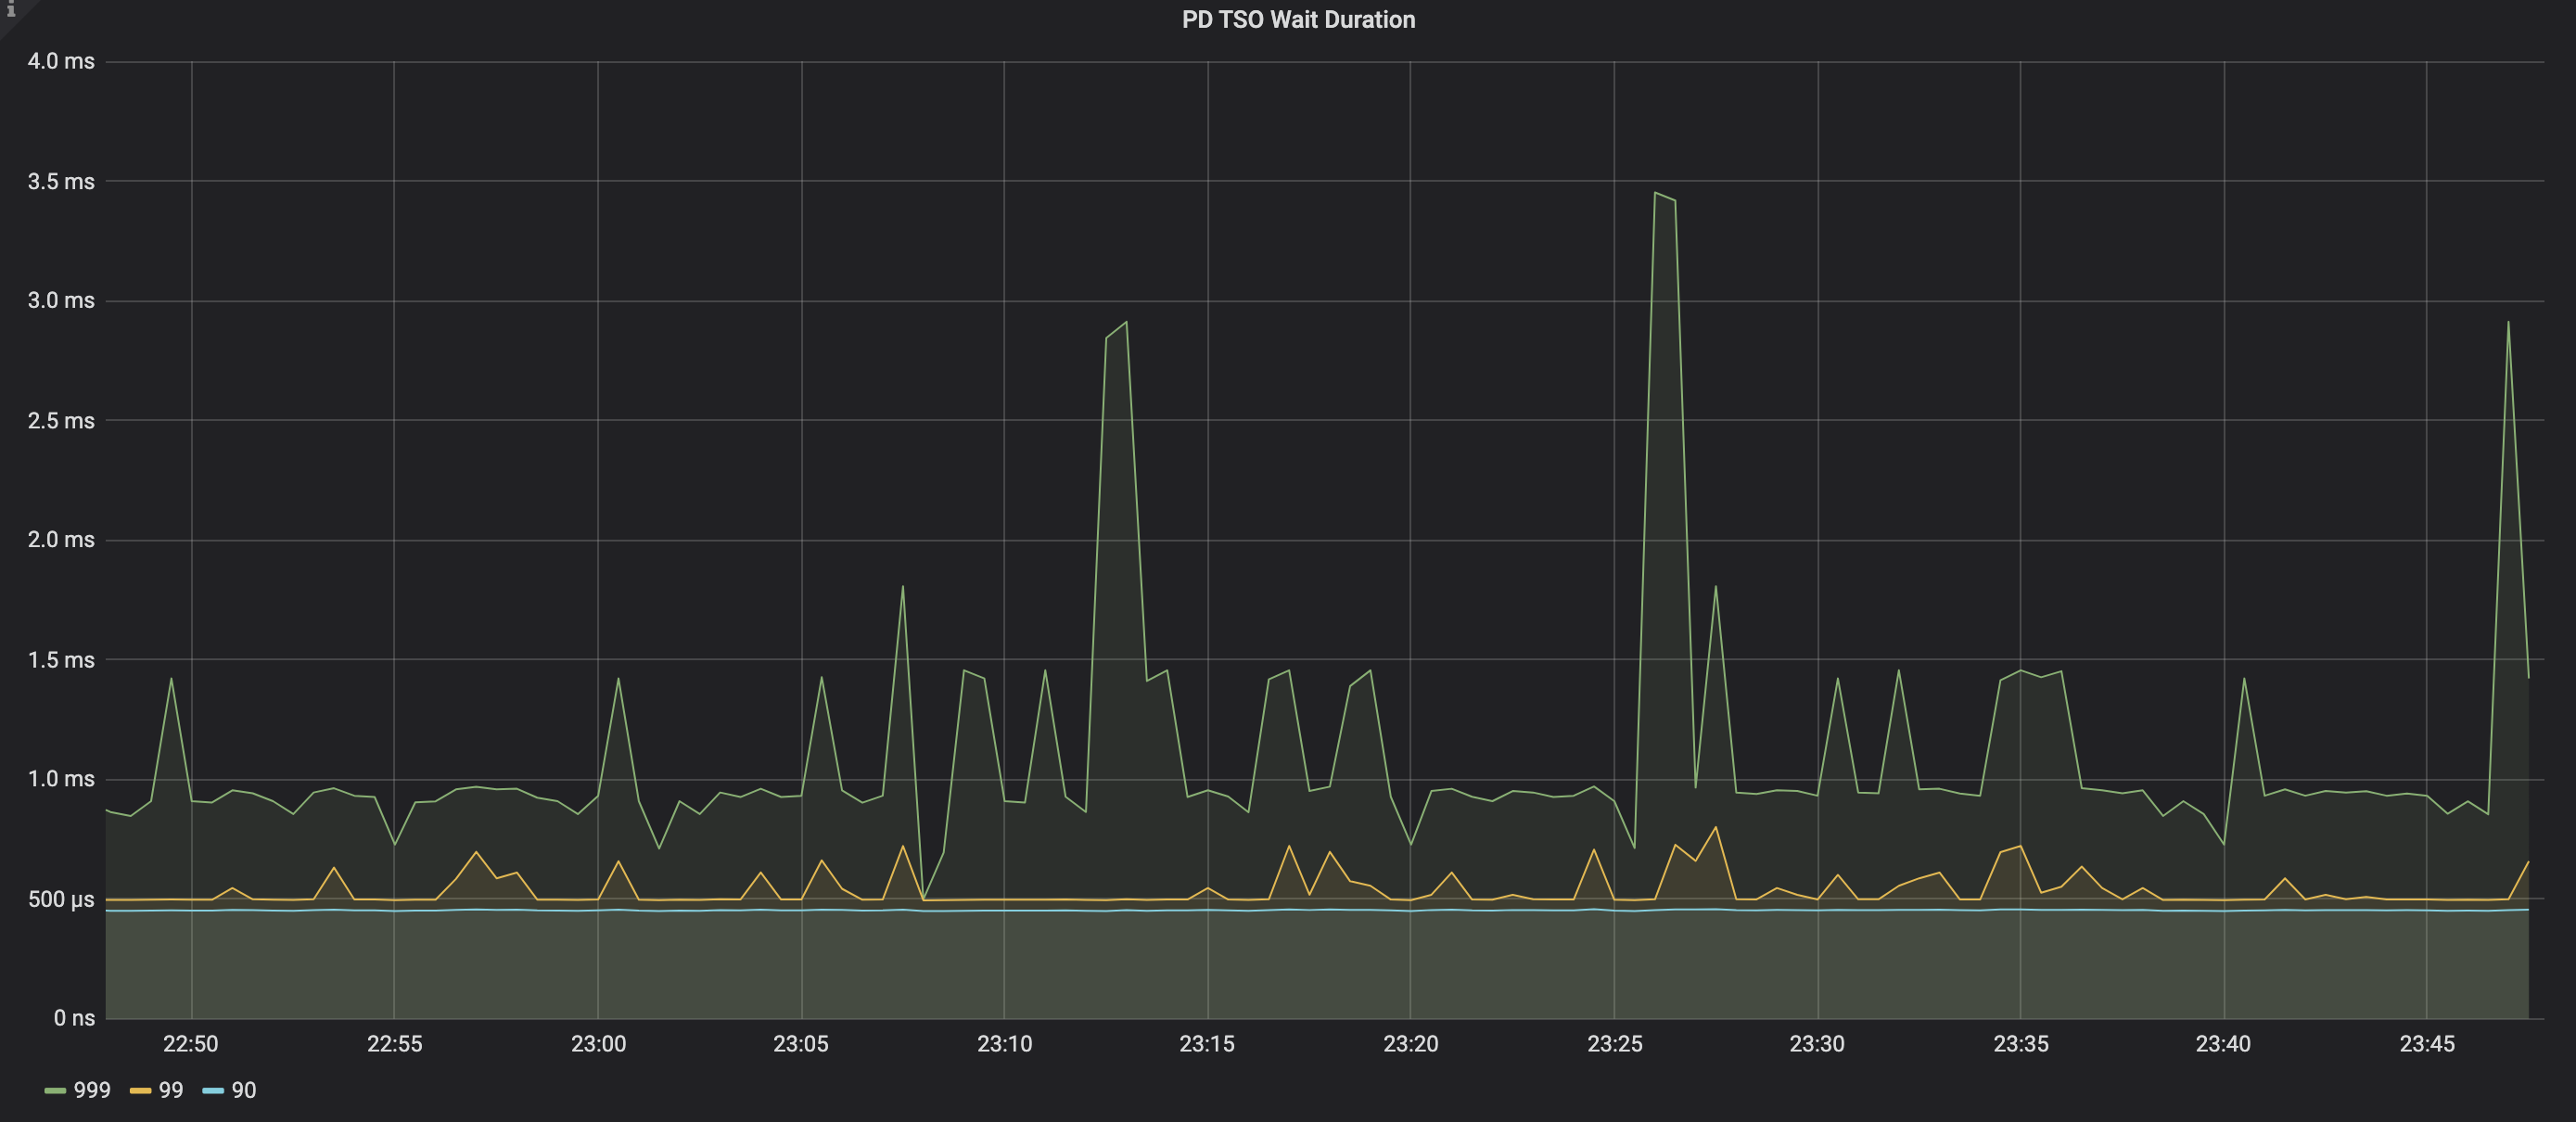
The time it takes for TiDB to obtain TSO from PD. The following are reasons for the long wait duration:
- High network latency from TiDB to PD. You can manually execute the ping command to test the network latency.
- High load for the TiDB server.
- High load for the PD server.
Overview panel
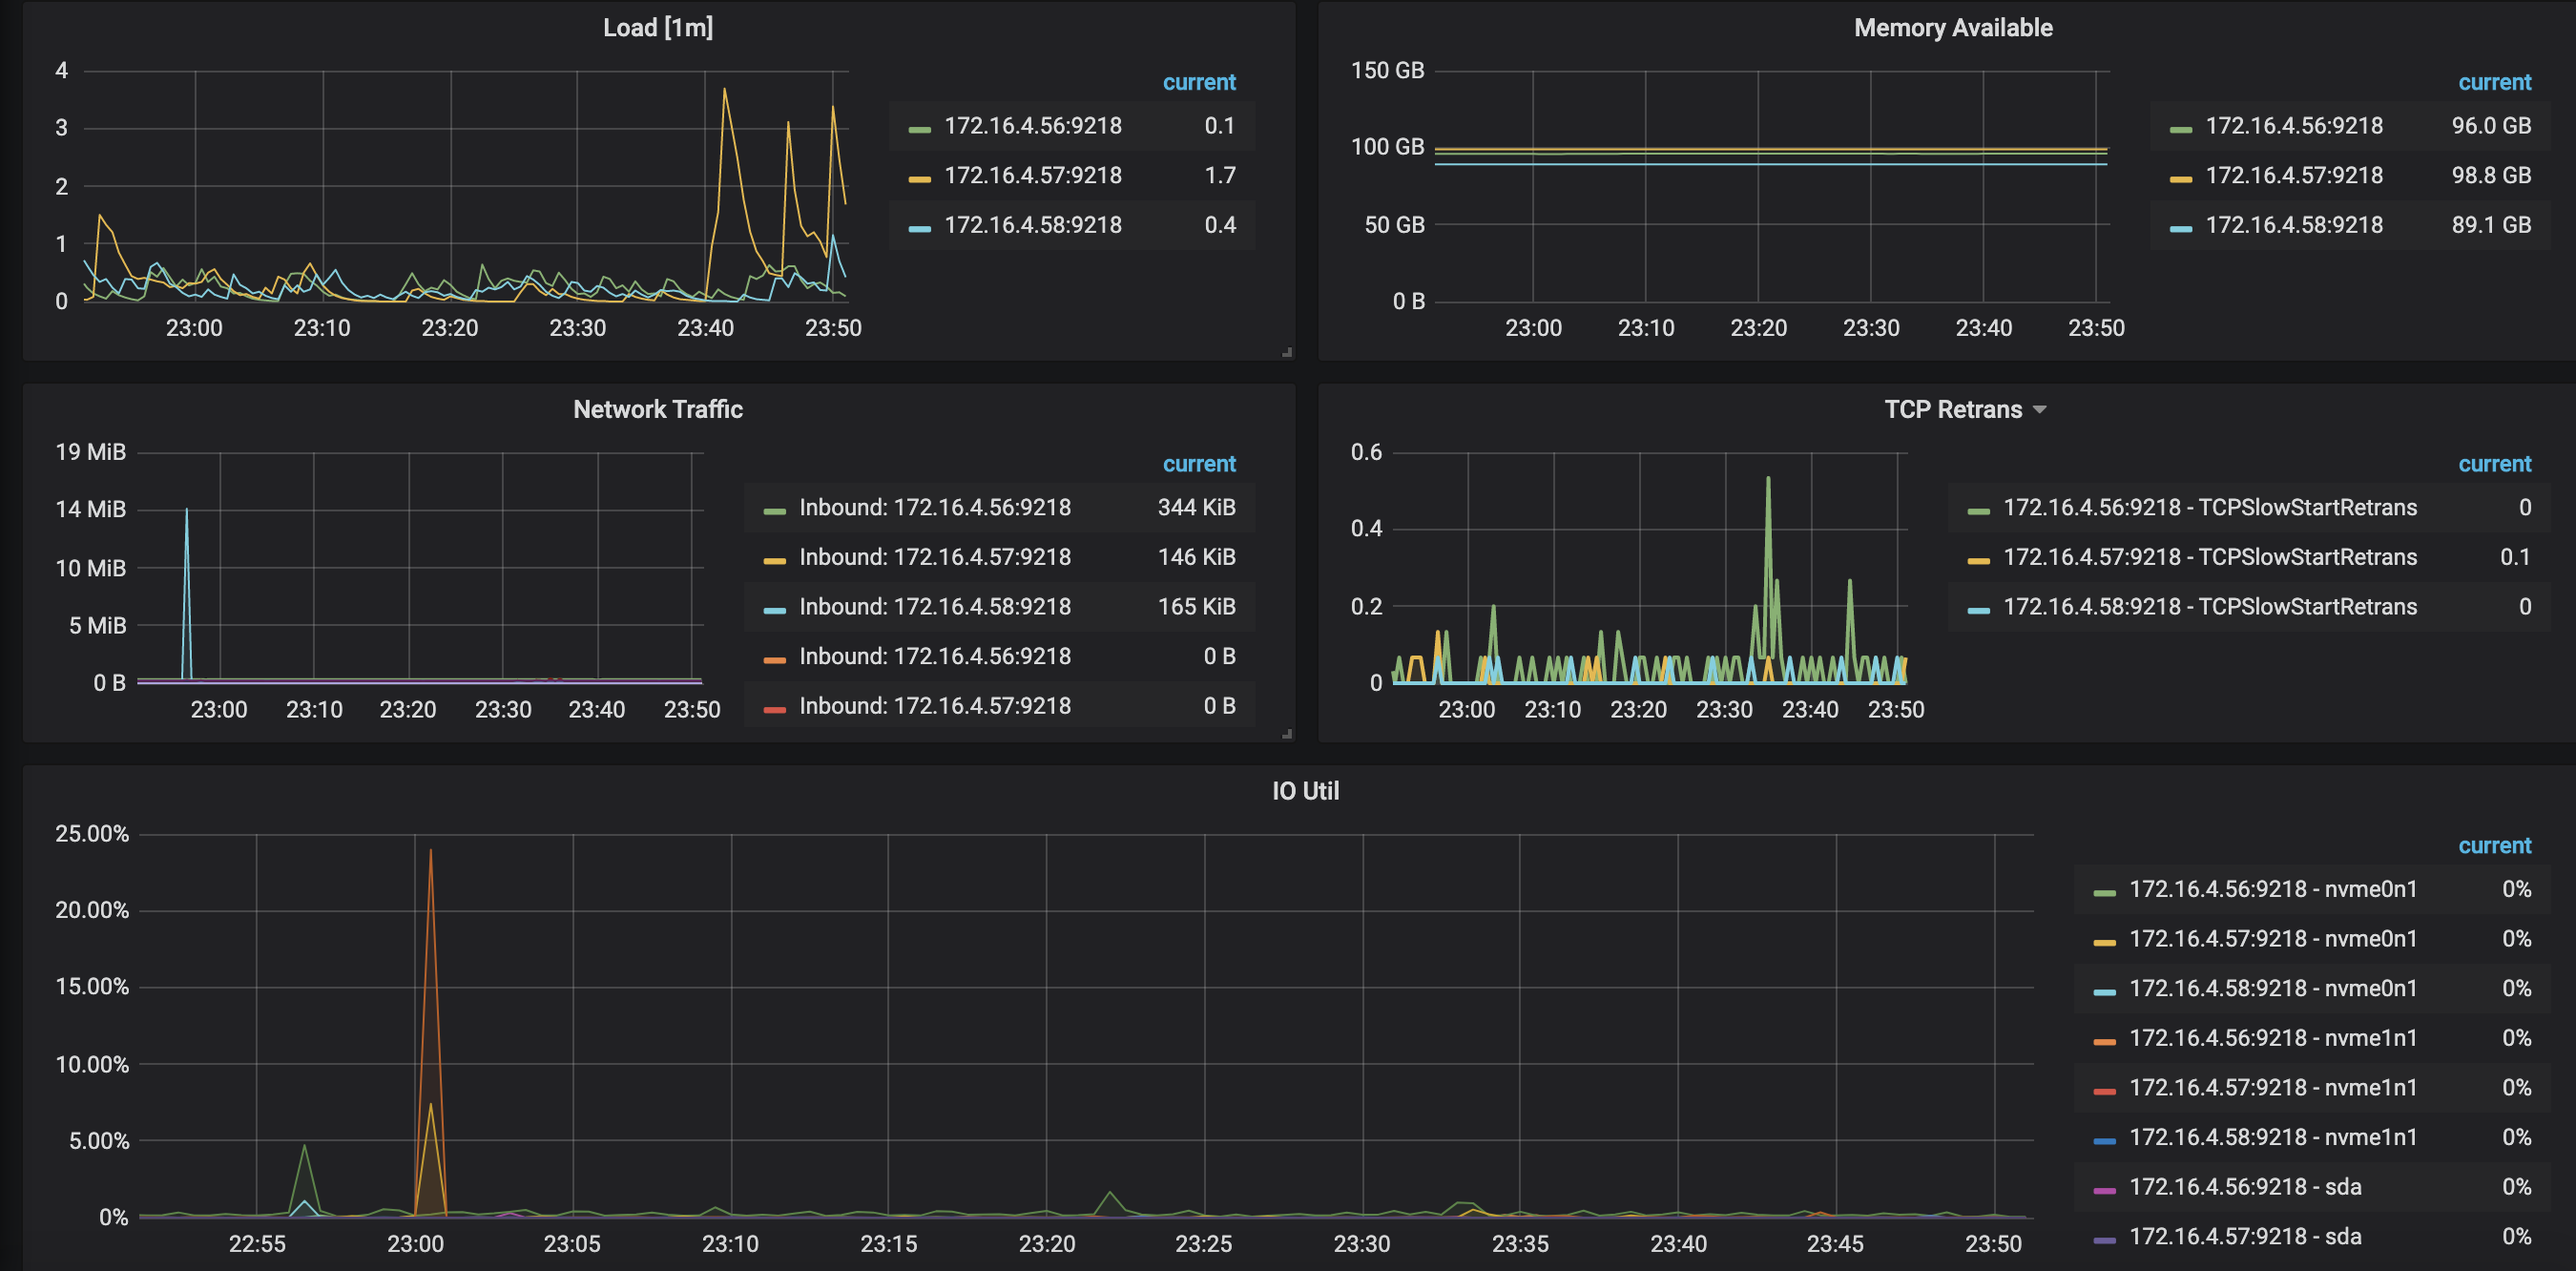
You can view the load, memory available, network traffic, and I/O utilities. When a bottleneck is found, it is recommended to scale out the capacity, or to optimize the cluster topology, SQL, cluster parameters, etc.
Exceptions
You can view the errors triggered by the execution of SQL statements on each TiDB instance. These include syntax error, primary key conflicts, etc.
GC status
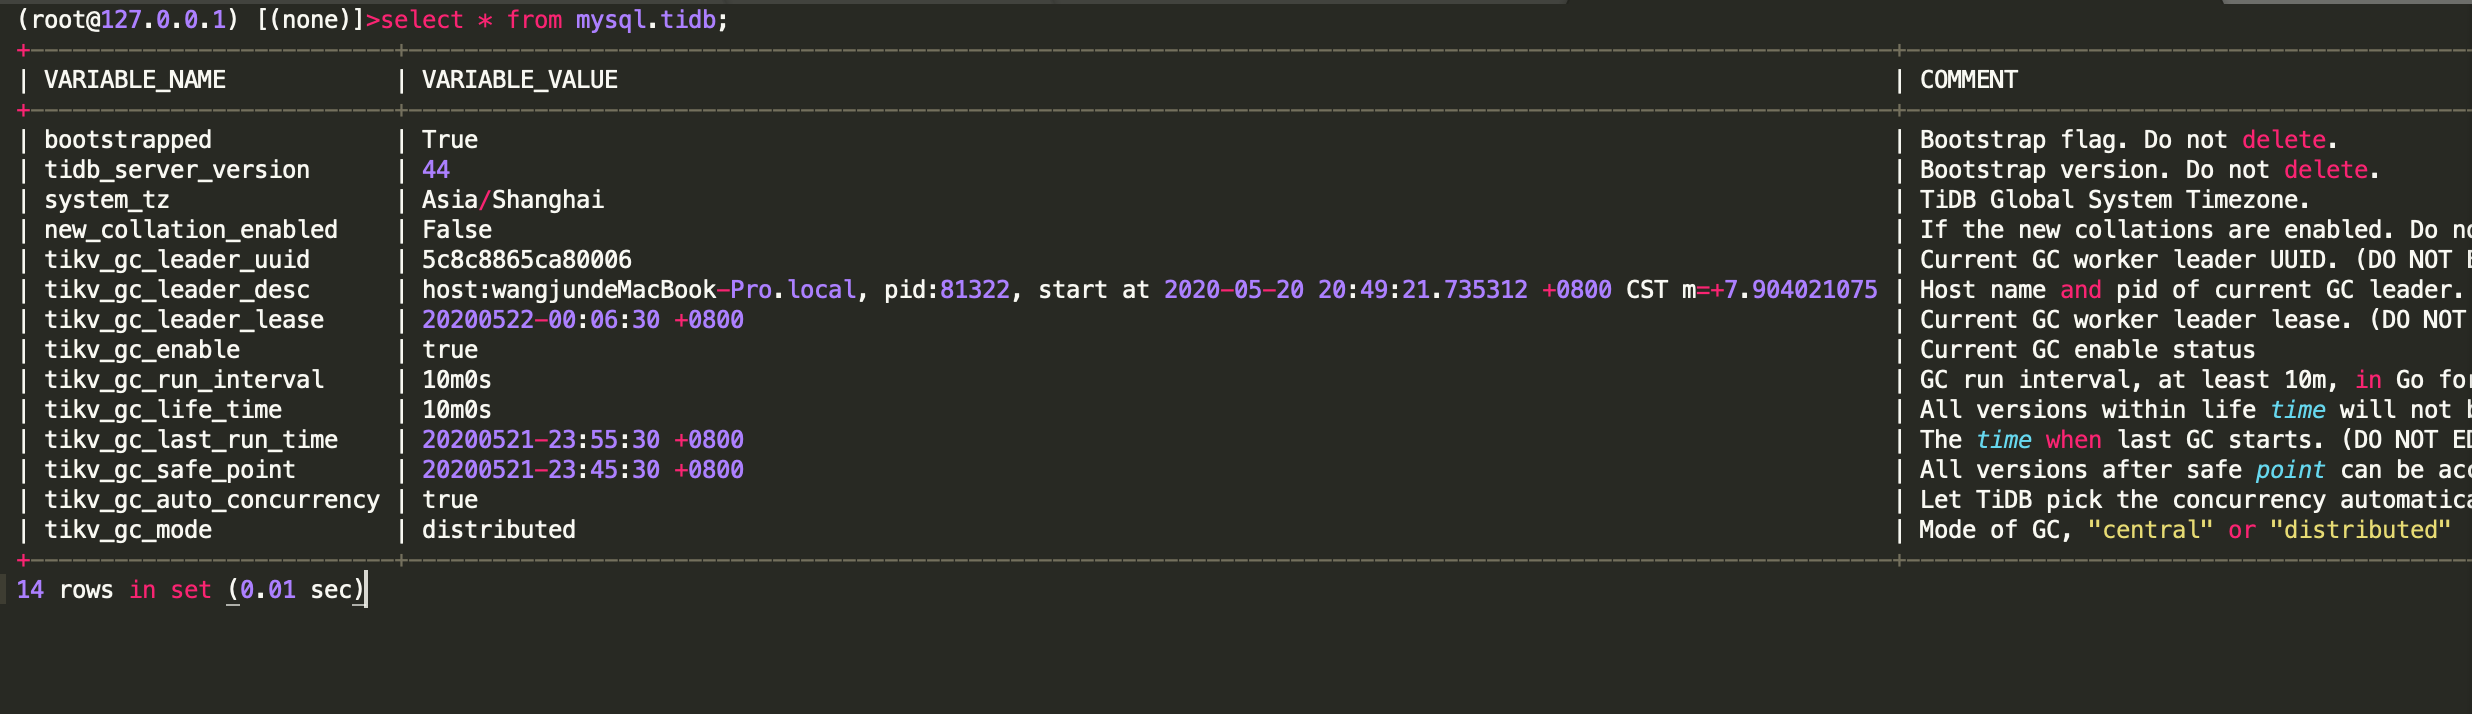
You can check whether the GC (Garbage Collection) status is normal by viewing the time when the last GC happens. If the GC is abnormal, it might lead to excessive historical data, thereby decreasing the access efficiency.