- Introduction
- Concepts
- Key Features
- Horizontal Scalability
- MySQL Compatible Syntax
- Replicate from and to MySQL
- Distributed Transactions with Strong Consistency
- Cloud Native Architecture
- Minimize ETL with HTAP
- Fault Tolerance & Recovery with Raft
- Automatic Rebalancing
- Deployment and Orchestration with Ansible, Kubernetes, Docker
- JSON Support
- Spark Integration
- Read Historical Data Without Restoring from Backup
- Fast Import and Restore of Data
- Hybrid of Column and Row Storage
- SQL Plan Management
- Open Source
- Online Schema Changes
- Key Features
- How-to
- Get Started
- Start a Cluster
- Deploy
- From Binary Tarball
- Orchestrated Deployment
- Geographic Redundancy
- Configure
- Secure
- Transport Layer Security (TLS)
- Monitor
- Migrate
- Migrate from MySQL
- Maintain
- Backup and Restore
- Identify Abnormal Queries
- Scale
- Upgrade
- Troubleshoot
- Get Started
- Reference
- SQL
- SQL Language Structure
- Data Types
- Numeric Types
- Date and Time Types
- String Types
- Functions and Operators
- Function and Operator Reference
- Type Conversion in Expression Evaluation
- Operators
- Control Flow Functions
- String Functions
- Numeric Functions and Operators
- Date and Time Functions
- Bit Functions and Operators
- Cast Functions and Operators
- Encryption and Compression Functions
- Information Functions
- JSON Functions
- Aggregate (GROUP BY) Functions
- Window Functions
- Miscellaneous Functions
- Precision Math
- List of Expressions for Pushdown
- SQL Statements
ADD COLUMN
ADD INDEX
ADMIN
ADMIN CANCEL DDL
ADMIN CHECKSUM TABLE
ADMIN CHECK [TABLE|INDEX]
ADMIN SHOW DDL [JOBS|QUERIES]
ALTER DATABASE
ALTER TABLE
ALTER USER
ANALYZE TABLE
BEGIN
CHANGE COLUMN
COMMIT
CREATE DATABASE
CREATE INDEX
CREATE ROLE
CREATE TABLE LIKE
CREATE TABLE
CREATE USER
CREATE VIEW
DEALLOCATE
DELETE
DESC
DESCRIBE
DO
DROP COLUMN
DROP DATABASE
DROP INDEX
DROP ROLE
DROP TABLE
DROP USER
DROP VIEW
EXECUTE
EXPLAIN ANALYZE
EXPLAIN
FLUSH PRIVILEGES
FLUSH STATUS
FLUSH TABLES
GRANT <privileges>
GRANT <role>
INSERT
KILL [TIDB]
LOAD DATA
LOAD STATS
MODIFY COLUMN
PREPARE
RECOVER TABLE
RENAME INDEX
RENAME TABLE
REPLACE
REVOKE <privileges>
REVOKE <role>
ROLLBACK
SELECT
SET DEFAULT ROLE
SET [NAMES|CHARACTER SET]
SET PASSWORD
SET ROLE
SET TRANSACTION
SET [GLOBAL|SESSION] <variable>
SHOW ANALYZE STATUS
SHOW CHARACTER SET
SHOW COLLATION
SHOW [FULL] COLUMNS FROM
SHOW CREATE TABLE
SHOW CREATE USER
SHOW DATABASES
SHOW ENGINES
SHOW ERRORS
SHOW [FULL] FIELDS FROM
SHOW GRANTS
SHOW INDEXES [FROM|IN]
SHOW INDEX [FROM|IN]
SHOW KEYS [FROM|IN]
SHOW PRIVILEGES
SHOW [FULL] PROCESSSLIST
SHOW SCHEMAS
SHOW STATUS
SHOW [FULL] TABLES
SHOW TABLE REGIONS
SHOW TABLE STATUS
SHOW [GLOBAL|SESSION] VARIABLES
SHOW WARNINGS
SPLIT REGION
START TRANSACTION
TRACE
TRUNCATE
UPDATE
USE
- Configuration
- tidb-server
- pd-server
- tikv-server
- Security
- Transactions
- System Databases
- Garbage Collection (GC)
- Performance
- Overview
- Understanding the Query Execution Plan
- The Blocklist of Optimization Rules and Expression Pushdown
- Introduction to Statistics
- TopN and Limit Push Down
- Optimizer Hints
- Check the TiDB Cluster Status Using SQL Statements
- Execution Plan Binding
- Statement Summary Table
- Tune TiKV
- Operating System Tuning
- Column Pruning
- Key Monitoring Metrics
- Best Practices
- TiDB Binlog
- Upgrade
- Reparo
- Binlog Consumer Client
- TiDB Binlog Relay Log
- Bidirectional Replication Between TiDB Clusters
- Glossary
- Troubleshoot
- Tools
- TiDB Lightning
- sync-diff-inspector
- SQL
- FAQs
- Support
- Contribute
- Releases
- All Releases
- v3.0
- v2.1
- v2.0
- v1.0
- Glossary
Export Grafana Snapshots
Metrics data is important in troubleshooting. When you request remote assistance, sometimes the support staff need to view the Grafana dashboards to diagnose problems. MetricsTool can help export snapshots of Grafana dashboards as local files and visualize these snapshots. You can share these snapshots with outsiders and allow them to accurately read out the graphs, without giving out access to other sensitive information on the Grafana server.
Usage
MetricsTool can be accessed from https://metricstool.pingcap.com/. It consists of three sets of tools:
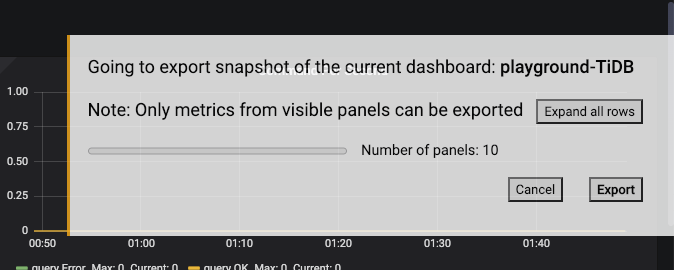
Export: A user script running on the browser's Developer Tool, allowing you to download a snapshot of all visible panels in the current dashboard on any Grafana v6.x.x server.
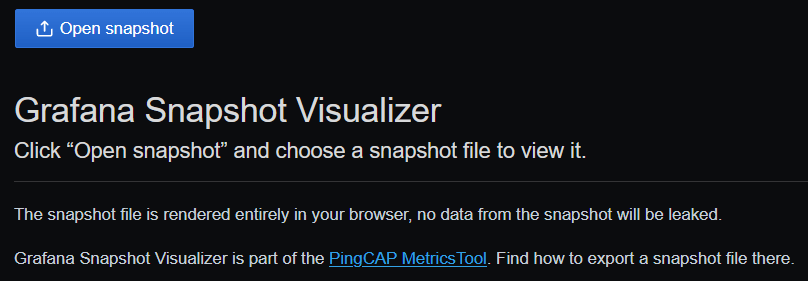
Visualize: A web page visualizing the exported snapshot files. The visualized snapshots can be operated in the same way as live Grafana dashboards.
Import: Instructions to import the exported snapshot back into an actual Grafana instance.
FAQs
What is the advantage of this tool compared with screenshot or PDF printing?
The snapshot files exported by MetricsTool contain the actual values when they are taken. And the Visualizer allows you to interact with the rendered graphs as if it is a live Grafana dashboard, supporting operations like toggling series, zooming into a smaller time range, and checking the precise value at a given time. This makes MetricsTool much more powerful than images or PDFs.
What are included in the snapshot file?
The snapshot file contains the values of all graphs and panels in the selected time range. It does not save the original metrics from the data sources (and thus you cannot edit the query expression in the Visualizer).
Will the Visualizer save the uploaded snapshot files in PingCAP's servers?
No, the Visualizer parses the snapshot files entirely inside your browser. Nothing will be sent to PingCAP. You are free to view snapshot files received from sensitive sources, and no need to worry about these leaking to third parties through the Visualizer.
Can it export metrics besides Grafana?
No, we only support Grafana v6.x.x at the moment.
Will there be problems to execute the script before all metrics are loaded?
No, the script UI will notify you to wait for all metrics to be loaded. However, you can manually skip waiting and export the snapshot in case of some metrics loading for too long.
Can we share a link to a visualized snapshot?
No, but you can share the snapshot file, with instruction on how to use the Visualizer to view it. If you truly need a world-readable URL, you may also try the public snapshot.raintank.io
service built into Grafana, but make sure all privacy concerns are cleared before doing so.
- Export Grafana Snapshots
- Usage
- FAQs
- What is the advantage of this tool compared with screenshot or PDF printing?
- What are included in the snapshot file?
- Will the Visualizer save the uploaded snapshot files in PingCAP's servers?
- Can it export metrics besides Grafana?
- Will there be problems to execute the script before all metrics are loaded?
- Can we share a link to a visualized snapshot?