- Introduction
- Concepts
- Architecture
- Key Features
- Horizontal Scalability
- MySQL Compatible Syntax
- Replicate from and to MySQL
- Distributed Transactions with Strong Consistency
- Cloud Native Architecture
- Minimize ETL with HTAP
- Fault Tolerance & Recovery with Raft
- Automatic Rebalancing
- Deployment and Orchestration with Ansible, Kubernetes, Docker
- JSON Support
- Spark Integration
- Read Historical Data Without Restoring from Backup
- Fast Import and Restore of Data
- Hybrid of Column and Row Storage
- SQL Plan Management
- Open Source
- Online Schema Changes
- How-to
- Get Started
- Deploy
- Hardware Recommendations
- From Binary Tarball
- Orchestrated Deployment
- Geographic Redundancy
- Data Migration with Ansible
- Configure
- Secure
- Transport Layer Security (TLS)
- Generate Self-signed Certificates
- Monitor
- Migrate
- Maintain
- Scale
- Upgrade
- Troubleshoot
- Reference
- SQL
- MySQL Compatibility
- SQL Language Structure
- Data Types
- Functions and Operators
- Function and Operator Reference
- Type Conversion in Expression Evaluation
- Operators
- Control Flow Functions
- String Functions
- Numeric Functions and Operators
- Date and Time Functions
- Bit Functions and Operators
- Cast Functions and Operators
- Encryption and Compression Functions
- Information Functions
- JSON Functions
- Aggregate (GROUP BY) Functions
- Miscellaneous Functions
- Precision Math
- SQL Statements
ADD COLUMN
ADD INDEX
ADMIN
ADMIN CANCEL DDL
ADMIN CHECKSUM TABLE
ADMIN CHECK [TABLE|INDEX]
ADMIN SHOW DDL [JOBS|QUERIES]
ALTER DATABASE
ALTER TABLE
ALTER USER
ANALYZE TABLE
BEGIN
CHANGE COLUMN
COMMIT
CREATE DATABASE
CREATE INDEX
CREATE TABLE LIKE
CREATE TABLE
CREATE USER
DEALLOCATE
DELETE
DESC
DESCRIBE
DO
DROP COLUMN
DROP DATABASE
DROP INDEX
DROP TABLE
DROP USER
EXECUTE
EXPLAIN ANALYZE
EXPLAIN
FLUSH PRIVILEGES
FLUSH STATUS
FLUSH TABLES
GRANT <privileges>
INSERT
KILL [TIDB]
LOAD DATA
LOAD STATS
MODIFY COLUMN
PREPARE
RENAME INDEX
RENAME TABLE
REPLACE
REVOKE <privileges>
ROLLBACK
SELECT
SET [NAMES|CHARACTER SET]
SET PASSWORD
SET TRANSACTION
SET [GLOBAL|SESSION] <variable>
SHOW CHARACTER SET
SHOW COLLATION
SHOW [FULL] COLUMNS FROM
SHOW CREATE TABLE
SHOW DATABASES
SHOW ENGINES
SHOW ERRORS
SHOW [FULL] FIELDS FROM
SHOW GRANTS
SHOW INDEXES [FROM|IN]
SHOW INDEX [FROM|IN]
SHOW KEYS [FROM|IN]
SHOW PRIVILEGES
SHOW [FULL] PROCESSSLIST
SHOW SCHEMAS
SHOW STATUS
SHOW [FULL] TABLES
SHOW TABLE STATUS
SHOW [GLOBAL|SESSION] VARIABLES
SHOW WARNINGS
START TRANSACTION
TRACE
TRUNCATE
UPDATE
USE
- Constraints
- Generated Columns
- Character Set
- Configuration
- Security
- Transactions
- System Databases
- Errors Codes
- Supported Client Drivers
- Garbage Collection (GC)
- Performance
- Key Monitoring Metrics
- Alert Rules
- Best Practices
- TiSpark
- TiDB Binlog
- Tools
- Overview
- Use Cases
- Download
- Mydumper
- Syncer
- Loader
- TiDB Data Migration
- TiDB Lightning
- sync-diff-inspector
- PD Control
- PD Recover
- TiKV Control
- TiDB Control
- FAQs
- Support
- Contribute
- Adopters
- Releases
- All Releases
- v2.1
- v2.0
- v1.0
- Glossary
You are viewing the documentation of an older version of the TiDB database (TiDB v2.1).
TiDB Monitoring Framework Overview
The TiDB monitoring framework adopts two open source projects: Prometheus and Grafana. TiDB uses Prometheus to store the monitoring and performance metrics and Grafana to visualize these metrics.
About Prometheus in TiDB
As a time series database, Prometheus has a multi-dimensional data model and flexible query language. As one of the most popular open source projects, Prometheus has been adopted by many companies and organizations and has a very active community. PingCAP is one of the active developers and adopters of Prometheus for monitoring and alerting in TiDB, TiKV and PD.
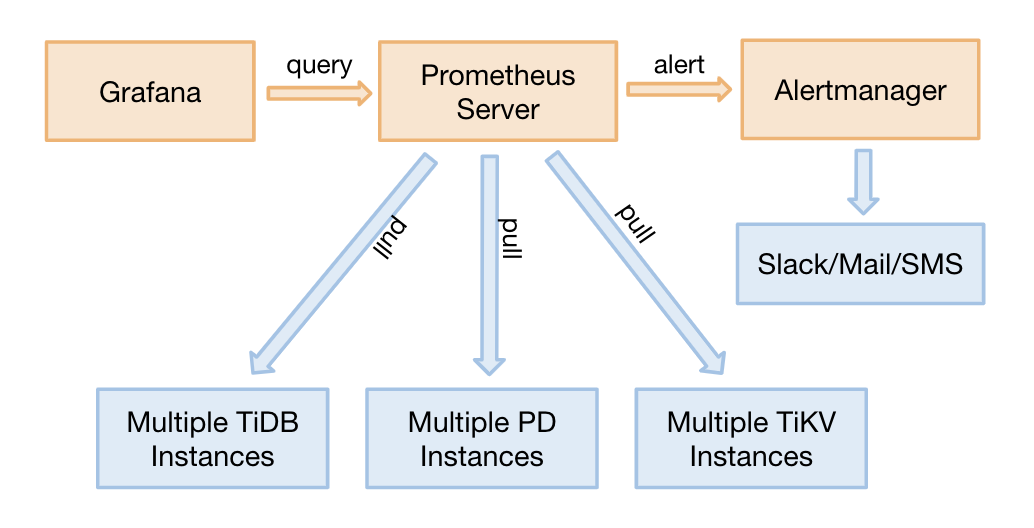
Prometheus consists of multiple components. Currently, TiDB uses the following of them:
- The Prometheus Server to scrape and store time series data
- The client libraries to customize necessary metrics in the application
- An Alertmanager for the alerting mechanism
The diagram is as follows:
About Grafana in TiDB
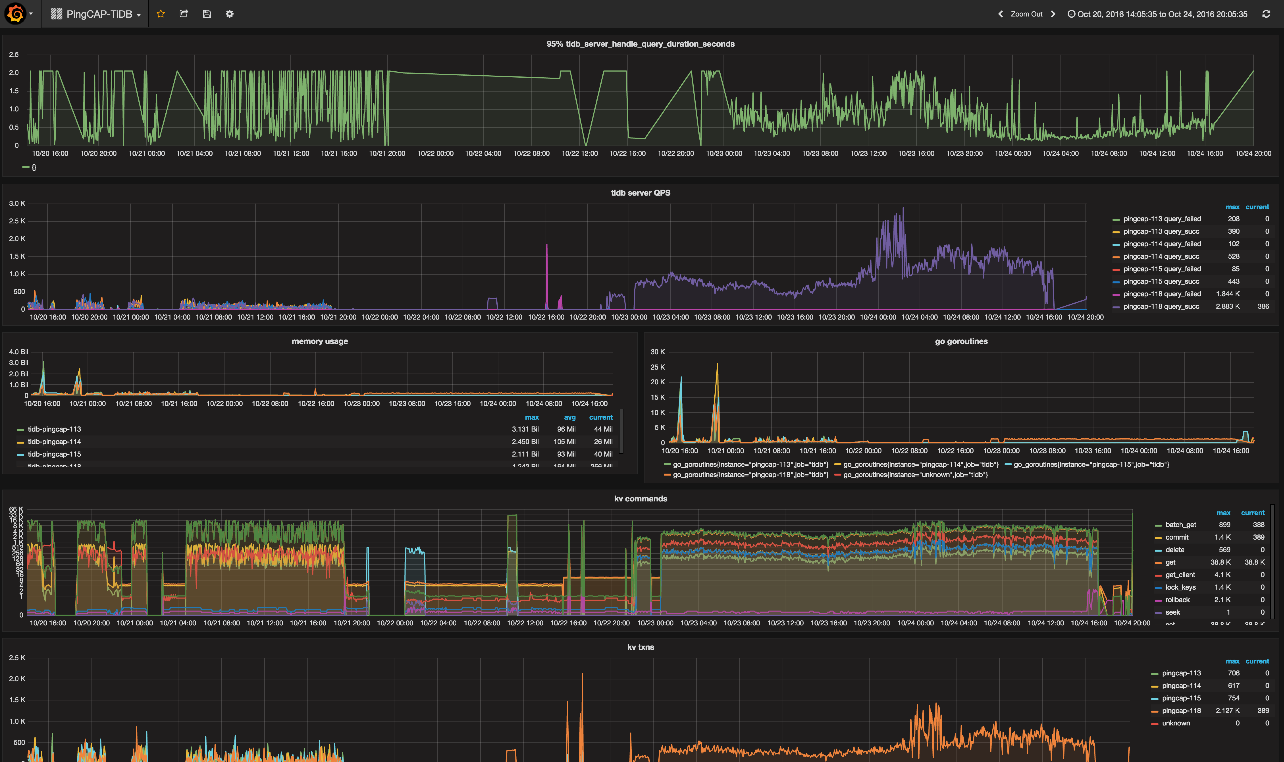
Grafana is an open source project for analyzing and visualizing metrics. TiDB uses Grafana to display the performance metrics as follows: