TiDB Lightning Monitoring
Both tidb-lightning and tikv-importer supports metrics collection via Prometheus. This document introduces the monitor configuration and monitoring metrics of TiDB Lightning.
Monitor configuration
- If TiDB Lightning is installed using TiDB Ansible, simply add the servers to the
[monitored_servers]section in theinventory.inifile. Then the Prometheus server can collect their metrics. - If TiDB Lightning is manually installed, follow the instructions below.
tikv-importer
tikv-importer v2.1 uses Pushgateway to deliver
metrics. Configure tikv-importer.toml to recognize the Pushgateway with the following settings:
[metric]
# The Prometheus client push job name.
job = "tikv-importer"
# The Prometheus client push interval.
interval = "15s"
# The Prometheus Pushgateway address.
address = ""
tidb-lightning
The metrics of tidb-lightning can be gathered directly by Prometheus as long as it is discovered. You can set the metrics port in tidb-lightning.toml:
[lightning]
# HTTP port for debugging and Prometheus metrics pulling (0 to disable)
pprof-port = 8289

...
You need to configure Prometheus to make it discover the tidb-lightning server. For instance, you can directly add the server address to the scrape_configs section:
...
scrape_configs:
  - job_name: 'tidb-lightning'
    static_configs:
      - targets: ['192.168.20.10:8289']
Grafana dashboard
Grafana is a web interface to visualize Prometheus metrics as dashboards.
If TiDB Lightning is installed using TiDB Ansible, its dashboard is already installed. Otherwise, the dashboard JSON can be imported from https://raw.githubusercontent.com/pingcap/tidb-ansible/master/scripts/lightning.json.
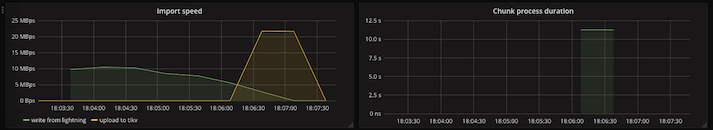
Row 1: Speed
| Panel | Series | Description |
|---|---|---|
| Import speed | write from lightning | Speed of sending KVs from TiDB Lightning to TiKV Importer, which depends on each table's complexity |
| Import speed | upload to tikv | Total upload speed from TiKV Importer to all TiKV replicas |
| Chunk process duration | Average time needed to completely encode one single data file |
Sometimes the import speed will drop to zero allowing other parts to catch up. This is normal.
Row 2: Progress

| Panel | Description |
|---|---|
| Import progress | Percentage of data files encoded so far |
| Checksum progress | Percentage of tables are verified to be imported successfully |
| Failures | Number of failed tables and their point of failure, normally empty |
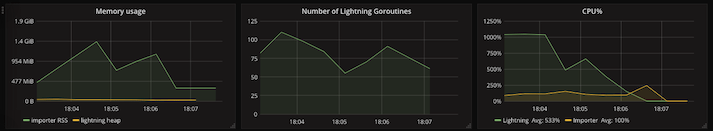
Row 3: Resource
| Panel | Description |
|---|---|
| Memory usage | Amount of memory occupied by each service |
| Number of Lightning Goroutines | Number of running goroutines used by TiDB Lightning |
| CPU% | Number of logical CPU cores utilized by each service |
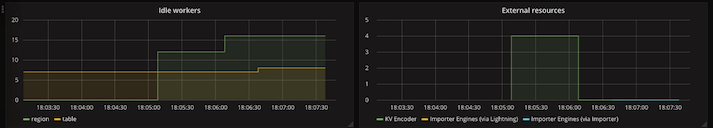
Row 4: Quota
| Panel | Series | Description |
|---|---|---|
| Idle workers | io | Number of unused io-concurrency, normally close to configured value (default 5), and close to 0 means the disk is too slow |
| Idle workers | closed-engine | Number of engines which is closed but not yet cleaned up, normally close to index + table-concurrency (default 8), and close to 0 means TiDB Lightning is faster than TiKV Importer, which will cause TiDB Lightning to stall |
| Idle workers | table | Number of unused table-concurrency, normally 0 until the end of process |
| Idle workers | index | Number of unused index-concurrency, normally 0 until the end of process |
| Idle workers | region | Number of unused region-concurrency, normally 0 until the end of process |
| External resources | KV Encoder | Counts active KV encoders, normally the same as region-concurrency until the end of process |
| External resources | Importer Engines | Counts opened engine files, should never exceed the max-open-engines setting |
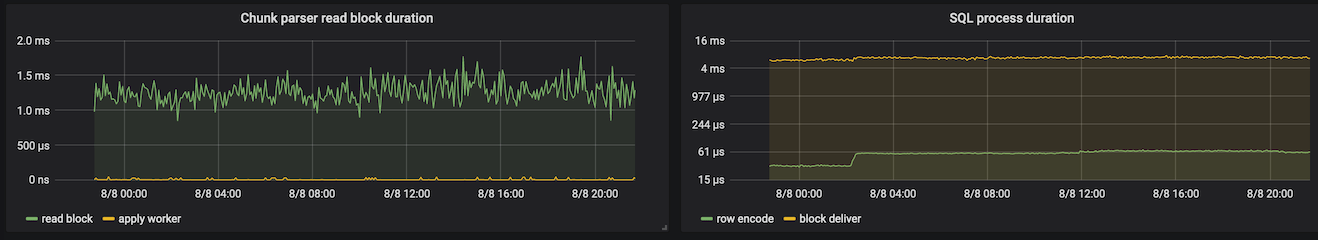
Row 5: Read speed
| Panel | Series | Description |
|---|---|---|
| Chunk parser read block duration | read block | Time taken to read one block of bytes to prepare for parsing |
| Chunk parser read block duration | apply worker | Time elapsed to wait for an idle io-concurrency |
| SQL process duration | row encode | Time taken to parse and encode a single row |
| SQL process duration | block deliver | Time taken to send a block of KV pairs to TiKV Importer |
If any of the duration is too high, it indicates that the disk used by TiDB Lightning is too slow or busy with I/O.
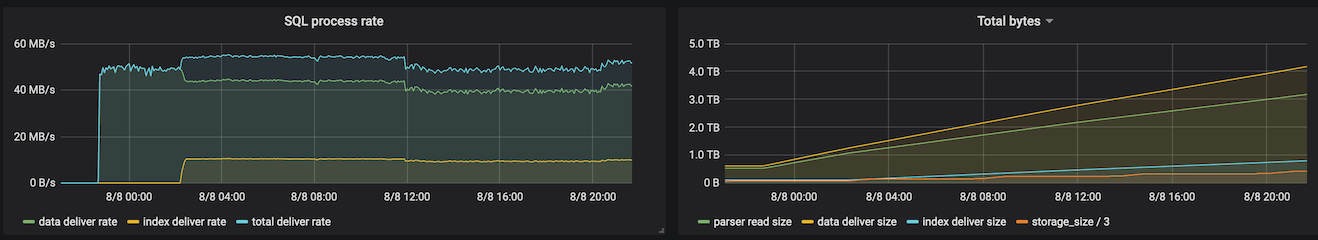
Row 6: Storage
| Panel | Series | Description |
|---|---|---|
| SQL process rate | data deliver rate | Speed of delivery of data KV pairs to TiKV Importer |
| SQL process rate | index deliver rate | Speed of delivery of index KV pairs to TiKV Importer |
| SQL process rate | total deliver rate | The sum of two rates above |
| Total bytes | parser read size | Number of bytes being read by TiDB Lightning |
| Total bytes | data deliver size | Number of bytes of data KV pairs already delivered to TiKV Importer |
| Total bytes | index deliver size | Number of bytes of index KV pairs already delivered to TiKV Importer |
| Total bytes | storage_size / 3 | Total size occupied by the TiKV cluster, divided by 3 (the default number of replicas) |
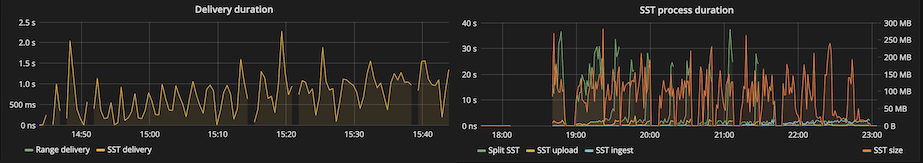
Row 7: Import speed
| Panel | Series | Description |
|---|---|---|
| Delivery duration | Range delivery | Time taken to upload a range of KV pairs to the TiKV cluster |
| Delivery duration | SST delivery | Time taken to upload an SST file to the TiKV cluster |
| SST process duration | Split SST | Time taken to split the stream of KV pairs into SST files |
| SST process duration | SST upload | Time taken to upload an SST file |
| SST process duration | SST ingest | Time taken to ingest an uploaded SST file |
| SST process duration | SST size | File size of an SST file |
Monitoring metrics
This section explains the monitoring metrics of tikv-importer and tidb-lightning, if you need to monitor other metrics not covered by the default Grafana dashboard.
tikv-importer
Metrics provided by tikv-importer are listed under the namespace tikv_import_*.
tikv_import_rpc_duration(Histogram)Bucketed histogram for the duration of an RPC action. Labels:
- request: what kind of RPC is executed
switch_mode— switched a TiKV node to import/normal modeopen_engine— opened an engine filewrite_engine— received data and written into an engineclose_engine— closed an engine fileimport_engine— imported an engine file into the TiKV clustercleanup_engine— deleted an engine filecompact_cluster— explicitly compacted the TiKV clusterupload— uploaded an SST fileingest— ingested an SST filecompact— explicitly compacted a TiKV node
- result: the execution result of the RPC
okerror
- request: what kind of RPC is executed
tikv_import_write_chunk_bytes(Histogram)Bucketed histogram for the uncompressed size of a block of KV pairs received from Lightning.
tikv_import_write_chunk_duration(Histogram)Bucketed histogram for the time needed to receive a block of KV pairs from Lightning.
tikv_import_upload_chunk_bytes(Histogram)Bucketed histogram for the compressed size of a chunk of SST file uploaded to TiKV.
tikv_import_upload_chunk_duration(Histogram)Bucketed histogram for the time needed to upload a chunk of SST file to TiKV.
tikv_import_range_delivery_duration(Histogram)Bucketed histogram for the time needed to deliver a range of KV pairs into a
dispatch-job.tikv_import_split_sst_duration(Histogram)Bucketed histogram for the time needed to split off a range from the engine file into a single SST file.
tikv_import_sst_delivery_duration(Histogram)Bucketed histogram for the time needed to deliver an SST file from a
dispatch-jobto anImportSSTJob.tikv_import_sst_recv_duration(Histogram)Bucketed histogram for the time needed to receive an SST file from a
dispatch-jobin anImportSSTJob.tikv_import_sst_upload_duration(Histogram)Bucketed histogram for the time needed to upload an SST file from an
ImportSSTJobto a TiKV node.tikv_import_sst_chunk_bytes(Histogram)Bucketed histogram for the compressed size of the SST file uploaded to a TiKV node.
tikv_import_sst_ingest_duration(Histogram)Bucketed histogram for the time needed to ingest an SST file into TiKV.
tikv_import_each_phase(Gauge)Indicates the running phase. Possible values are 1, meaning running inside the phase, and 0, meaning outside the phase. Labels:
- phase:
prepare/import
- phase:
tikv_import_wait_store_available_count(Counter)Counts the number of times a TiKV node is found to have insufficient space when uploading SST files. Labels:
- store_id: The TiKV store ID.
tidb-lightning
Metrics provided by tidb-lightning are listed under the namespace lightning_*.
lightning_importer_engine(Counter)Counts open and closed engine files. Labels:
- type:
openclosed
- type:
lightning_idle_workers(Gauge)Counts idle workers. Labels:
- name:
table— the remainder oftable-concurrency, normally 0 until the end of the processindex— the remainder ofindex-concurrency, normally 0 until the end of the processregion— the remainder ofregion-concurrency, normally 0 until the end of the processio— the remainder ofio-concurrency, normally close to configured value (default 5), and close to 0 means the disk is too slowclosed-engine— number of engines which have been closed but not yet cleaned up, normally close to index + table-concurrency (default 8). A value close to 0 means TiDB Lightning is faster than TiKV Importer, which might cause TiDB Lightning to stall
- name:
lightning_kv_encoder(Counter)Counts open and closed KV encoders. KV encoders are in-memory TiDB instances that convert SQL
INSERTstatements into KV pairs. The net values need to be bounded in a healthy situation. Labels:- type:
openclosed
- type:
lightning_tables(Counter)Counts processed tables and their statuses. Labels:
- state: the status of the table, indicating which phase should be completed
pending— not yet processedwritten— all data encoded and sentclosed— all corresponding engine files closedimported— all engine files have been imported into the target clusteraltered_auto_inc— AUTO_INCREMENT ID alteredchecksum— checksum performedanalyzed— statistics analysis performedcompleted— the table has been fully imported and verified
- result: the result of the current phase
success— the phase completed successfullyfailure— the phase failed (did not complete)
- state: the status of the table, indicating which phase should be completed
lightning_engines(Counter)Counts number of engine files processed and their status. Labels:
- state: the status of the engine, indicating which phase should be completed
pending— not yet processedwritten— all data encoded and sentclosed— engine file closedimported— the engine file has been imported into the target clustercompleted— the engine has been fully imported
- result: the result of the current phase
success— the phase completed successfullyfailure— the phase failed (did not complete)
- state: the status of the engine, indicating which phase should be completed
lightning_chunks(Counter)Counts number of chunks processed and their status. Labels:
- state: a chunk's status, indicating which phase the chunk is in
estimated— (not a state) this value gives total number of chunks in current taskpending— loaded but not yet processedrunning— data are being encoded and sentfinished— the entire chunk has been processedfailed— errors happened during processing
- state: a chunk's status, indicating which phase the chunk is in
lightning_import_seconds(Histogram)Bucketed histogram for the time needed to import a table.
lightning_row_read_bytes(Histogram)Bucketed histogram for the size of a single SQL row.
lightning_row_encode_seconds(Histogram)Bucketed histogram for the time needed to encode a single SQL row into KV pairs.
lightning_row_kv_deliver_seconds(Histogram)Bucketed histogram for the time needed to deliver a set of KV pairs corresponding to one single SQL row.
lightning_block_deliver_seconds(Histogram)Bucketed histogram for the time needed to deliver a block of KV pairs to Importer.
lightning_block_deliver_bytes(Histogram)Bucketed histogram for the uncompressed size of a block of KV pairs delivered to Importer.
lightning_chunk_parser_read_block_seconds(Histogram)Bucketed histogram for the time needed by the data file parser to read a block.
lightning_checksum_seconds(Histogram)Bucketed histogram for the time needed to compute the checksum of a table.
lightning_apply_worker_seconds(Histogram)Bucketed histogram for the time needed to acquire an idle worker (see also the
lightning_idle_workersgauge). Labels:- name:
tableindexregionioclosed-engine
- name: