Monitor a TiDB Cluster
You can use the following two types of interfaces to monitor the TiDB cluster state:
- The state interface: this interface uses the HTTP interface to get the component information.
- The metrics interface: this interface uses Prometheus to record the detailed information of the various operations in components and views these metrics using Grafana.
Use the state interface
The state interface monitors the basic information of a specific component in the TiDB cluster. It can also act as the monitor interface for Keepalive messages. In addition, the state interface for the Placement Driver (PD) can get the details of the entire TiKV cluster.
TiDB server
- TiDB API address:
http://${host}:${port} - Default port:
10080 - Details about API names: see TiDB HTTP API
The following example uses http://${host}:${port}/status to get the current state of the TiDB server and to determine whether the server is alive. The result is returned in JSON format.
curl http://127.0.0.1:10080/status
{
connections: 0, # The current number of clients connected to the TiDB server.
version: "5.7.25-TiDB-v3.0.0-beta-250-g778c3f4a5", # The TiDB version number.
git_hash: "778c3f4a5a716880bcd1d71b257c8165685f0d70" # The Git Hash of the current TiDB code.
}
PD server
- PD API address:
http://${host}:${port}/pd/api/v1/${api_name} - Default port:
2379 - Details about API names: see PD API doc
The PD interface provides the state of all the TiKV servers and the information about load balancing. See the following example for the information about a single-node TiKV cluster:
curl http://127.0.0.1:2379/pd/api/v1/stores
{
  "count": 1,  # The number of TiKV nodes.
  "stores": [  # The list of TiKV nodes.
    # The details about the single TiKV node.
    {
      "store": {
        "id": 1,
        "address": "127.0.0.1:20160",
        "version": "3.0.0-beta",
        "state_name": "Up"
      },
      "status": {
        "capacity": "20 GiB",  # The total capacity.
        "available": "16 GiB",  # The available capacity.
        "leader_count": 17,
        "leader_weight": 1,
        "leader_score": 17,
        "leader_size": 17,
        "region_count": 17,
        "region_weight": 1,
        "region_score": 17,
        "region_size": 17,
        "start_ts": "2019-03-21T14:09:32+08:00",  # The starting timestamp.
        "last_heartbeat_ts": "2019-03-21T14:14:22.961171958+08:00",  # The timestamp of the last heartbeat.
        "uptime": "4m50.961171958s"
      }
    }
  ]
Use the metrics interface
The metrics interface monitors the state and performance of the entire TiDB cluster.
- If you use TiDB Ansible to deploy the TiDB cluster, the monitoring system (Prometheus and Grafana) is deployed at the same time.
- If you use other deployment ways, deploy Prometheus and Grafana before using this interface.
After Prometheus and Grafana are successfully deployed, configure Grafana.
Deploy Prometheus and Grafana
Assume that the TiDB cluster topology is as follows:
| Name | Host IP | Services |
|---|---|---|
| Node1 | 192.168.199.113 | PD1, TiDB, node_export, Prometheus, Grafana |
| Node2 | 192.168.199.114 | PD2, node_export |
| Node3 | 192.168.199.115 | PD3, node_export |
| Node4 | 192.168.199.116 | TiKV1, node_export |
| Node5 | 192.168.199.117 | TiKV2, node_export |
| Node6 | 192.168.199.118 | TiKV3, node_export |
Step 1: Download the binary package
# Downloads the package.
$ wget https://github.com/prometheus/prometheus/releases/download/v2.2.1/prometheus-2.2.1.linux-amd64.tar.gz
$ wget https://github.com/prometheus/node_exporter/releases/download/v0.15.2/node_exporter-0.15.2.linux-amd64.tar.gz
$ wget https://s3-us-west-2.amazonaws.com/grafana-releases/release/grafana-4.6.3.linux-x64.tar.gz

# Extracts the package.
$ tar -xzf prometheus-2.2.1.linux-amd64.tar.gz
$ tar -xzf node_exporter-0.15.2.linux-amd64.tar.gz
$ tar -xzf grafana-4.6.3.linux-x64.tar.gz
Step 2: Start node_exporter on Node1, Node2, Node3, and Node4
$ cd node_exporter-0.15.2.linux-amd64

# Starts the node_exporter service.
$ ./node_exporter --web.listen-address=":9100" \
    --log.level="info" &
Step 3: Start Prometheus on Node1
Edit the Prometheus configuration file:
$ cd prometheus-2.2.1.linux-amd64
$ vi prometheus.yml

...

global:
  scrape_interval:     15s  # By default, scrape targets every 15 seconds.
  evaluation_interval: 15s  # By default, scrape targets every 15 seconds.
  # scrape_timeout is set to the global default value (10s).
    external_labels:
      cluster: 'test-cluster'
      monitor: "prometheus"

scrape_configs:
  - job_name: 'overwritten-nodes'
    honor_labels: true  # Do not overwrite job & instance labels.
    static_configs:
    - targets:
      - '192.168.199.113:9100'
      - '192.168.199.114:9100'
      - '192.168.199.115:9100'
      - '192.168.199.116:9100'
      - '192.168.199.117:9100'
      - '192.168.199.118:9100'

  - job_name: 'tidb'
    honor_labels: true  # Do not overwrite job & instance labels.
    static_configs:
    - targets:
      - '192.168.199.113:10080'

  - job_name: 'pd'
    honor_labels: true  # Do not overwrite job & instance labels.
    static_configs:
    - targets:
      - '192.168.199.113:2379'
      - '192.168.199.114:2379'
      - '192.168.199.115:2379'

  - job_name: 'tikv'
    honor_labels: true  # Do not overwrite job & instance labels.
    static_configs:
    - targets:
      - '192.168.199.116:20180'
      - '192.168.199.117:20180'
      - '192.168.199.118:20180'

...
Start the Prometheus service:
$ ./prometheus \
    --config.file="./prometheus.yml" \
    --web.listen-address=":9090" \
    --web.external-url="http://192.168.199.113:9090/" \
    --web.enable-admin-api \
    --log.level="info" \
    --storage.tsdb.path="./data.metrics" \
    --storage.tsdb.retention="15d" &
Step 4: Start Grafana on Node1
Edit the Grafana configuration file:
$ cd grafana-4.6.3
$ vi conf/grafana.ini

...

[paths]
data = ./data
logs = ./data/log
plugins = ./data/plugins
[server]
http_port = 3000
domain = 192.168.199.113
[database]
[session]
[analytics]
check_for_updates = true
[security]
admin_user = admin
admin_password = admin
[snapshots]
[users]
[auth.anonymous]
[auth.basic]
[auth.ldap]
[smtp]
[emails]
[log]
mode = file
[log.console]
[log.file]
level = info
format = text
[log.syslog]
[event_publisher]
[dashboards.json]
enabled = false
path = ./data/dashboards
[metrics]
[grafana_net]
url = https://grafana.net

...
Start the Grafana service:
$ ./bin/grafana-server \
    --config="./conf/grafana.ini" &
Configure Grafana
This section describes how to configure Grafana.
Step 1: Add a Prometheus data source
Log in to the Grafana Web interface.
- Default address: http://localhost:3000
- Default account: admin
- Default password: admin
Click the Grafana logo to open the sidebar menu.
In the sidebar menu, click Data Source.
Click Add data source.
Specify the data source information.
- Specify a Name for the data source.
- For Type, select Prometheus.
- For URL, specify the Prometheus address.
- Specify other fields as needed.
Click Add to save the new data source.
Step 2: Import a Grafana dashboard
To import a Grafana dashboard for the PD server, the TiKV server, and the TiDB server, take the following steps respectively:
Click the Grafana logo to open the sidebar menu.
In the sidebar menu, click Dashboards -> Import to open the Import Dashboard window.
Click Upload .json File to upload a JSON file (Download TiDB Grafana configuration file).
Click Load.
Select a Prometheus data source.
Click Import. A Prometheus dashboard is imported.
View component metrics
Click New dashboard in the top menu and choose the dashboard you want to view.
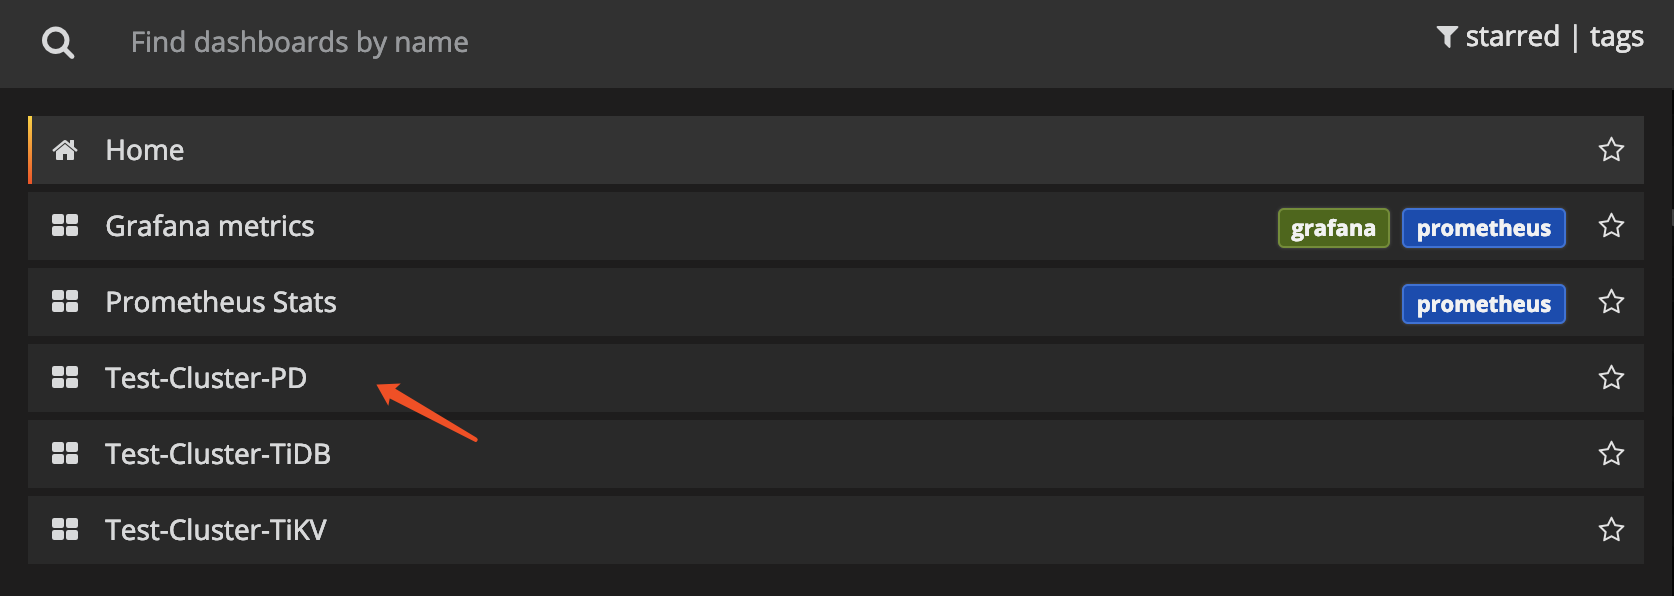
You can get the following metrics for cluster components:
TiDB server:
- Query processing time to monitor the latency and throughput
- The DDL process monitoring
- TiKV client related monitoring
- PD client related monitoring
PD server:
- The total number of times that the command executes
- The total number of times that a certain command fails
- The duration that a command succeeds
- The duration that a command fails
- The duration that a command finishes and returns result
TiKV server:
- Garbage Collection (GC) monitoring
- The total number of times that the TiKV command executes
- The duration that Scheduler executes commands
- The total number of times of the Raft propose command
- The duration that Raft executes commands
- The total number of times that Raft commands fail
- The total number of times that Raft processes the ready state