Key Metrics
If you use TiDB Ansible to deploy the TiDB cluster, the monitoring system is deployed at the same time. For more information, see TiDB Monitoring Framework Overview.
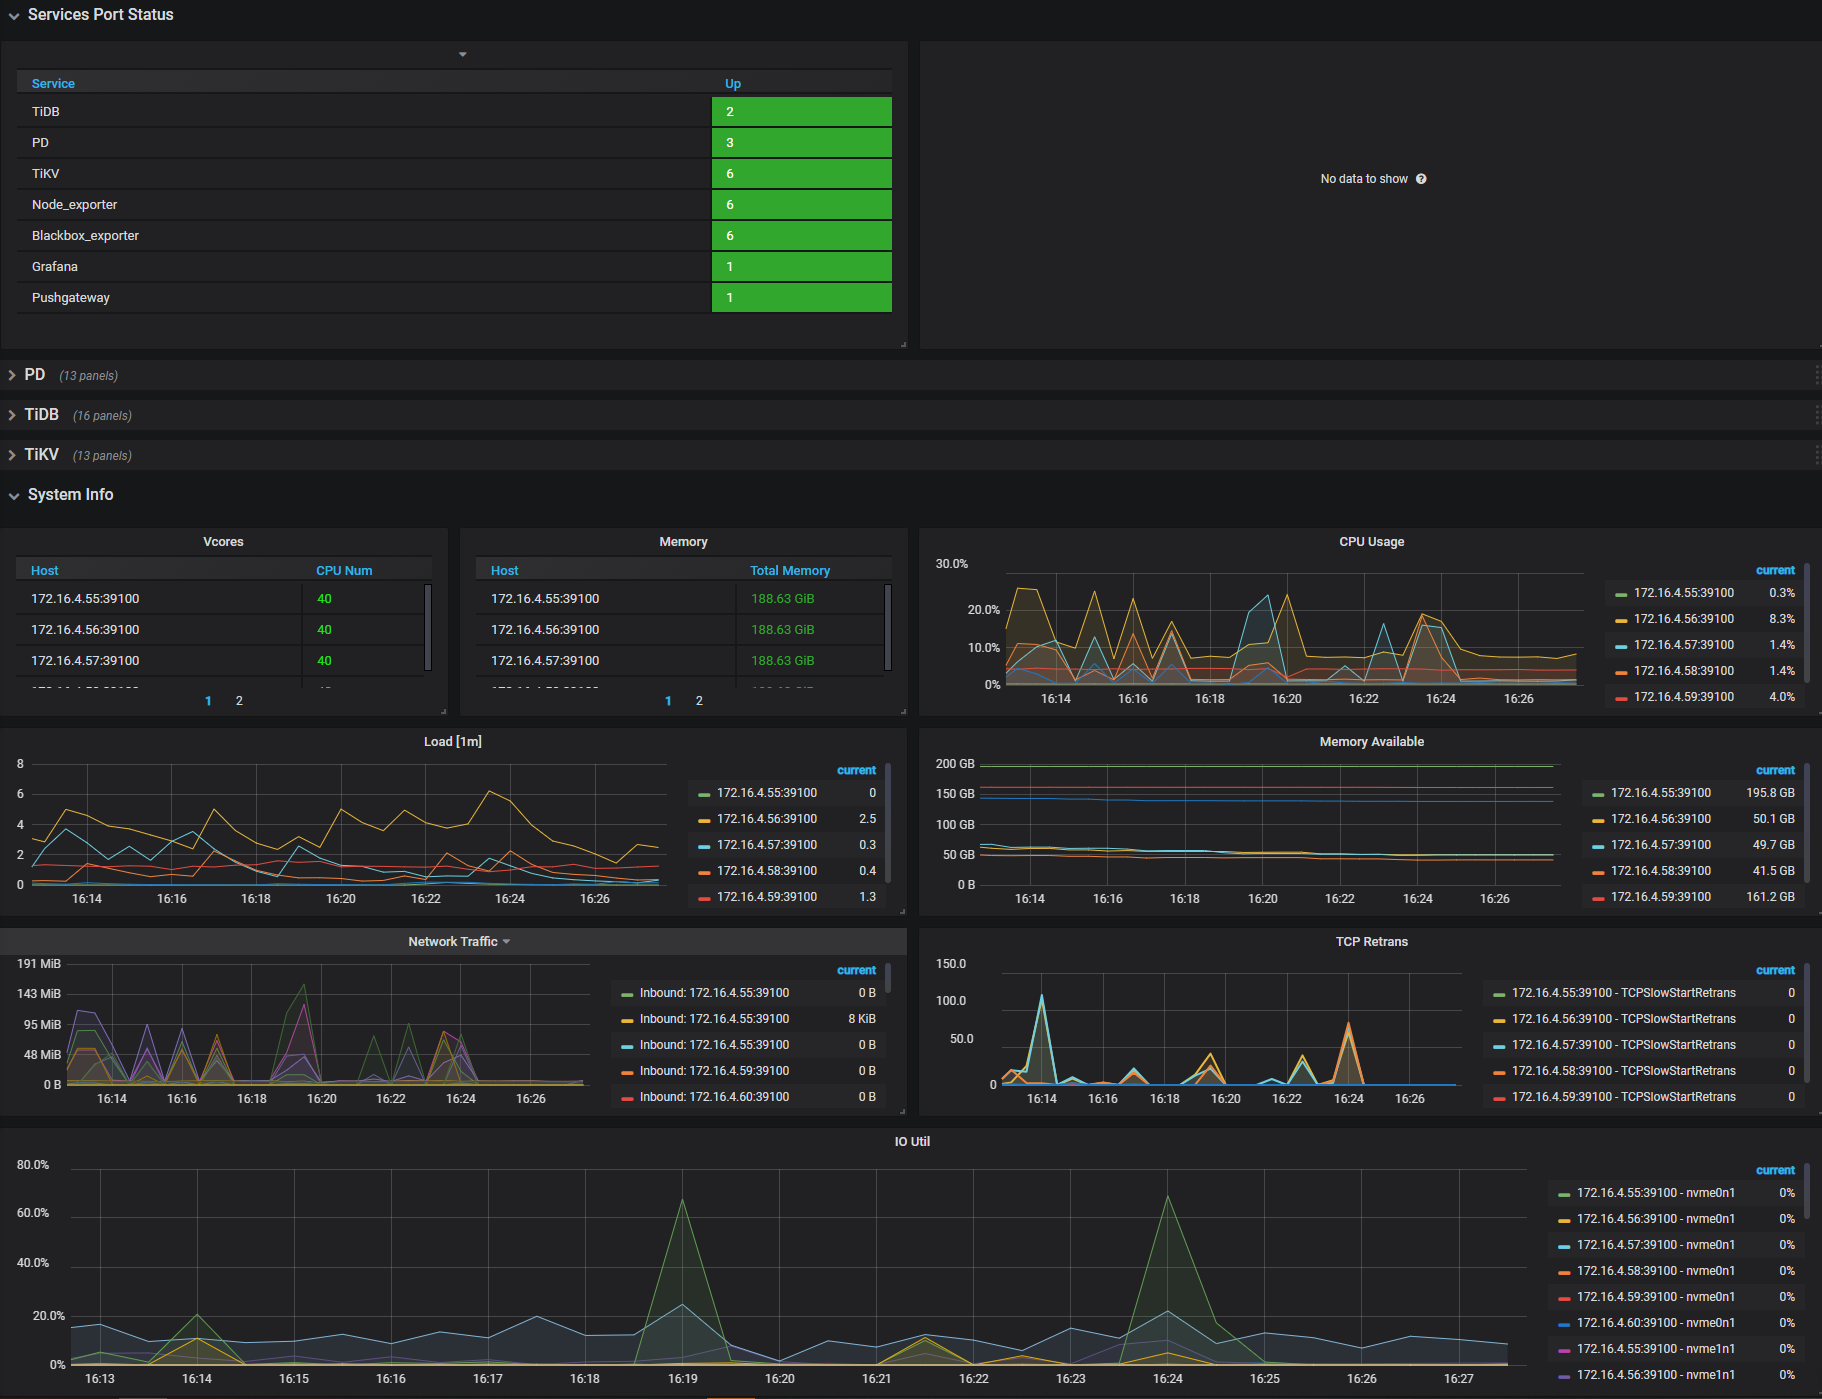
The Grafana dashboard is divided into a series of sub dashboards which include Overview, PD, TiDB, TiKV, Node_exporter, Disk Performance, and so on. A lot of metrics are there to help you diagnose.
For routine operations, you can get an overview of the component (PD, TiDB, TiKV) status and the entire cluster from the Overview dashboard, where the key metrics are displayed. This document provides a detailed description of these key metrics.
Key metrics description
To understand the key metrics displayed on the Overview dashboard, check the following table:
| Service | Panel Name | Description | Normal Range |
|---|---|---|---|
| Services Port Status | Services Online | the online nodes number of each service | |
| Services Port Status | Services Offline | the offline nodes number of each service | |
| PD | Storage Capacity | the total storage capacity of the TiDB cluster | |
| PD | Current Storage Size | the occupied storage capacity of the TiDB cluster | |
| PD | Number of Regions | the total number of Regions of the current cluster | |
| PD | Leader Balance Ratio | the leader ratio difference of the nodes with the biggest leader ratio and the smallest leader ratio | It is less than 5% for a balanced situation and becomes bigger when you restart a node. |
| PD | Region Balance Ratio | the Region ratio difference of the nodes with the biggest Region ratio and the smallest Region ratio | It is less than 5% for a balanced situation and becomes bigger when you add or remove a node. |
| PD | Store Status -- Up Stores | the number of TiKV nodes that are up | |
| PD | Store Status -- Disconnect Stores | the number of TiKV nodes that encounter abnormal communication within a short time | |
| PD | Store Status -- LowSpace Stores | the number of TiKV nodes with an available space of less than 20% | |
| PD | Store Status -- Down Stores | the number of TiKV nodes that are down | The normal value is 0. If the number is bigger than 0, it means some node(s) are abnormal. |
| PD | Store Status -- Offline Stores | the number of TiKV nodes (still providing service) that are being made offline | |
| PD | Store Status -- Tombstone Stores | the number of TiKV nodes that are successfully offline | |
| PD | 99% completed_cmds_duration_seconds | the 99th percentile duration to complete a pd-server request | less than 5ms |
| PD | handle_requests_duration_seconds | the request duration of a PD request | |
| PD | Region health | The state of each Region. | Generally, the number of pending peers is less than 100, and that of the missing peers cannot always be greater than 0. |
| PD | Hot write Region's leader distribution | The total number of leaders who are the write hotspots on each TiKV instance. | |
| PD | Hot read Region's leader distribution | The total number of leaders who are the read hotspots on each TiKV instance. | |
| PD | Region heartbeat report | The count of heartbeats reported to PD per instance. | |
| PD | 99% Region heartbeat latency | The heartbeat latency per TiKV instance (P99). | |
| TiDB | Statement OPS | the total number of executed SQL statements, including SELECT, INSERT, UPDATE and so on | |
| TiDB | Duration | the execution time of a SQL statement | |
| TiDB | QPS By Instance | the QPS on each TiDB instance | |
| TiDB | Failed Query OPM | the number of failed SQL statements, including syntax error and key conflicts and so on | |
| TiDB | Connection Count | the connection number of each TiDB instance | |
| TiDB | Heap Memory Usage | the size of heap memory used by each TiDB instance | |
| TiDB | Transaction OPS | the number of executed transactions per second | |
| TiDB | Transaction Duration | the execution time of a transaction | |
| TiDB | KV Cmd OPS | the number of executed KV commands | |
| TiDB | KV Cmd Duration 99 | the execution time of the KV command | |
| TiDB | PD TSO OPS | the number of TSO that TiDB obtains from PD | |
| TiDB | PD TSO Wait Duration | the time consumed when TiDB obtains TSO from PD | |
| TiDB | TiClient Region Error OPS | the number of Region related errors returned by TiKV | |
| TiDB | Lock Resolve OPS | the number of transaction related conflicts | |
| TiDB | Load Schema Duration | the time consumed when TiDB obtains Schema from TiKV | |
| TiDB | KV Backoff OPS | the number of errors returned by TiKV (such as transaction conflicts ) | |
| TiKV | leader | the number of leaders on each TiKV node | |
| TiKV | region | the number of Regions on each TiKV node | |
| TiKV | CPU | the CPU usage ratio on each TiKV node | |
| TiKV | Memory | the memory usage on each TiKV node | |
| TiKV | store size | the data amount on each TiKV node | |
| TiKV | cf size | the data amount on different CFs in the cluster | |
| TiKV | channel full | No data points is displayed in normal conditions. If a monitoring value displays, it means the corresponding TiKV node fails to handle the messages | |
| TiKV | server report failures | No data points is displayed in normal conditions. If Unreachable is displayed, it means TiKV encounters a communication issue. | |
| TiKV | scheduler pending commands | the number of commits on queue | Occasional value peaks are normal. |
| TiKV | coprocessor pending requests | the number of requests on queue | 0 or very small |
| TiKV | coprocessor executor count | the number of various query operations | |
| TiKV | coprocessor request duration | the time consumed by TiKV queries | |
| TiKV | raft store CPU | the CPU usage ratio of the raftstore thread | Currently, it is a single thread. A value of over 80% indicates that the CPU usage ratio is very high. |
| TiKV | Coprocessor CPU | the CPU usage ratio of the TiKV query thread, related to the application; complex queries consume a great deal of CPU | |
| System Info | Vcores | the number of CPU cores | |
| System Info | Memory | the total memory | |
| System Info | CPU Usage | the CPU usage ratio, 100% at a maximum | |
| System Info | Load [1m] | the overload within 1 minute | |
| System Info | Memory Available | the size of the available memory | |
| System Info | Network Traffic | the statistics of the network traffic | |
| System Info | TCP Retrans | the statistics about network monitoring and TCP | |
| System Info | IO Util | the disk usage ratio, 100% at a maximum; generally you need to consider adding a new node when the usage ratio is up to 80% ~ 90% |
Interface of the Overview dashboard