How to Test TiDB Using Sysbench
In this test, Sysbench 1.0.14 and TiDB 3.0 Beta are used. It is recommended to use Sysbench 1.0 or later, which can be downloaded here.
Test environment
The TiDB cluster is deployed according to the TiDB Deployment Guide. Suppose there are 3 servers in total. It is recommended to deploy 1 TiDB instance, 1 PD instance and 1 TiKV instance on each server. As for disk space, supposing that there are 32 tables and 10M rows of data on each table, it is recommended that the disk space where TiKV's data directory resides is larger than 512 GB. The number of concurrent connections to a single TiDB cluster is recommended to be under 500. If you need to increase the concurrency pressure on the entire system, you can add TiDB instances to the cluster whose number depends on the pressure of the test.
IDC machines:
| Type | Name |
|---|---|
| OS | Linux (CentOS 7.3.1611) |
| CPU | 40 vCPUs, Intel® Xeon® CPU E5-2630 v4 @ 2.20GHz |
| RAM | 128GB |
| DISK | Intel Optane SSD P4800X 375G * 1 |
| NIC | 10Gb Ethernet |
Test plan
TiDB version information
| Component | GitHash |
|---|---|
| TiDB | 7a240818d19ae96e4165af9ea35df92466f59ce6 |
| TiKV | e26ceadcdfe94fb6ff83b5abb614ea3115394bcd |
| PD | 5e81548c3c1a1adab056d977e7767307a39ecb70 |
Cluster topology
| Machine IP | Deployment instance |
|---|---|
| 172.16.30.31 | 3*sysbench |
| 172.16.30.33 | 1*tidb 1*pd 1*tikv |
| 172.16.30.34 | 1*tidb 1*pd 1*tikv |
| 172.16.30.35 | 1*tidb 1*pd 1*tikv |
TiDB configuration
Higher log level means fewer logs to be printed and thus positively influences TiDB performance. Enable prepared plan cache in the TiDB configuration to lower the cost of optimizing execution plan. Specifically, you can add the following command in the TiDB configuration file:
[log]
level = "error"
[prepared-plan-cache]
enabled = true
TiKV configuration
Higher log level also means better performance for TiKV.
As TiKV is deployed in clusters, the Raft algorithm can guarantee that data is written into most of the nodes. Therefore, except the scenarios where data safety is extremely important, sync-log can be disabled in raftstore.
There are 2 Column Families (Default CF and Write CF) on TiKV cluster which are mainly used to store different types of data. For the Sysbench test, the Column Family that is used to import data has a constant proportion among TiDB clusters:
Default CF : Write CF = 4 : 1
Configuring the block cache of RocksDB on TiKV should be based on the machine’s memory size, in order to make full use of the memory. To deploy a TiKV cluster on a 40GB virtual machine, it is suggested to configure the block cache as follows:
log-level = "error"
[raftstore]
sync-log = false
[rocksdb.defaultcf]
block-cache-size = "24GB"
[rocksdb.writecf]
block-cache-size = "6GB"
For more detailed information on TiKV performance tuning, see Tune TiKV Performance.
Test process
Sysbench configuration
This is an example of the Sysbench configuration file:
mysql-host={TIDB_HOST}
mysql-port=4000
mysql-user=root
mysql-password=password
mysql-db=sbtest
time=600
threads={8, 16, 32, 64, 128, 256}
report-interval=10
db-driver=mysql
The above parameters can be adjusted according to actual needs. Among them, TIDB_HOST is the IP address of the TiDB server (because we cannot include multiple addresses in the configuration file), threads is the number of concurrent connections in the test, which can be adjusted in "8, 16, 32, 64, 128, 256". When importing data, it is recommended to set threads = 8 or 16. After adjusting threads, save the file named config.
See the following as a sample config file:
mysql-host=172.16.30.33
mysql-port=4000
mysql-user=root
mysql-password=password
mysql-db=sbtest
time=600
threads=16
report-interval=10
db-driver=mysql
Data import
Before importing the data, it is necessary to make some settings to TiDB. Execute the following command in MySQL client:
set global tidb_disable_txn_auto_retry = off;
Then exit the client. TiDB uses an optimistic transaction model that rolls back transactions when a concurrency conflict is found. Setting tidb_disable_txn_auto_retry to off turns on the automatic retry mechanism after meeting a transaction conflict, which can prevent Sysbench from quitting because of the transaction conflict error.
Restart MySQL client and execute the following SQL statement to create a database sbtest:
create database sbtest;
Adjust the order in which Sysbench scripts create indexes. Sysbench imports data in the order of "Build Table -> Insert Data -> Create Index", which takes more time for TiDB to import data. Users can adjust the order to speed up the import of data. Suppose that you use the Sysbench version 1.0.14. You can adjust the order in either of the following two ways:
- Download the modified oltp_common.lua file for TiDB and overwrite the
/usr/share/sysbench/oltp_common.luafile with it. - In
/usr/share/sysbench/oltp_common.lua, move the lines 235-240 to be right behind the line 198.
At the command line, enter the following command to start importing data. The config file is the one configured in the previous step:
sysbench --config-file=config oltp_point_select --tables=32 --table-size=10000000 prepare
Warming data and collecting statistics
To warm data, we load data from disk into the block cache of memory. The warmed data has significantly improved the overall performance of the system. It is recommended to warm data once after restarting the cluster.
Sysbench 1.0.14 does not provide data warming, so it must be done manually. If you are using a later version of Sysbench, you can use the data warming feature included in the tool itself.
Take a table sbtest7 in Sysbench as an example. Execute the following SQL to warming up data:
SELECT COUNT(pad) FROM sbtest7 USE INDEX (k_7);
Collecting statistics helps the optimizer choose a more accurate execution plan. The analyze command can be used to collect statistics on the table sbtest. Each table needs statistics.
ANALYZE TABLE sbtest7;
Point select test command
sysbench --config-file=config oltp_point_select --tables=32 --table-size=10000000 run
Update index test command
sysbench --config-file=config oltp_update_index --tables=32 --table-size=10000000 run
Read-only test command
sysbench --config-file=config oltp_read_only --tables=32 --table-size=10000000 run
Test results
32 tables are tested, each with 10M of data.
Sysbench test was carried on each of the tidb-servers. And the final result was a sum of all the results.
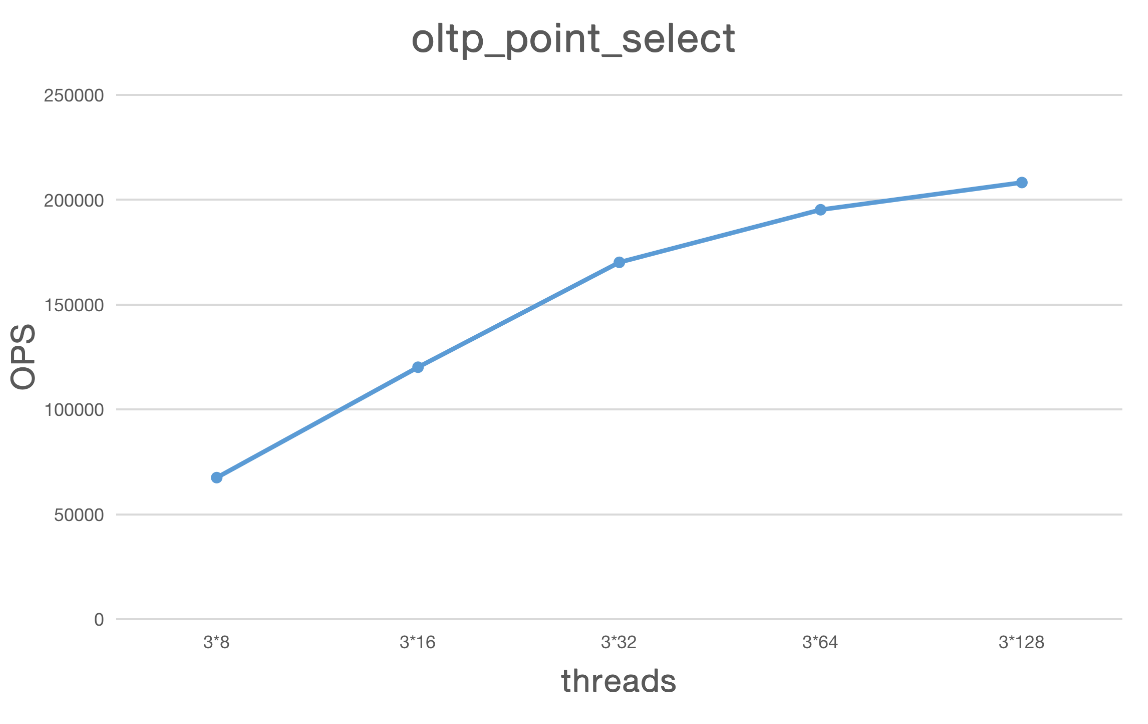
oltp_point_select
| Type | Thread | TPS | QPS | avg.latency(ms) | .95.latency(ms) | max.latency(ms) |
|---|---|---|---|---|---|---|
| point_select | 3*8 | 67502.55 | 67502.55 | 0.36 | 0.42 | 141.92 |
| point_select | 3*16 | 120141.84 | 120141.84 | 0.40 | 0.52 | 20.99 |
| point_select | 3*32 | 170142.92 | 170142.92 | 0.58 | 0.99 | 28.08 |
| point_select | 3*64 | 195218.54 | 195218.54 | 0.98 | 2.14 | 21.82 |
| point_select | 3*128 | 208189.53 | 208189.53 | 1.84 | 4.33 | 31.02 |
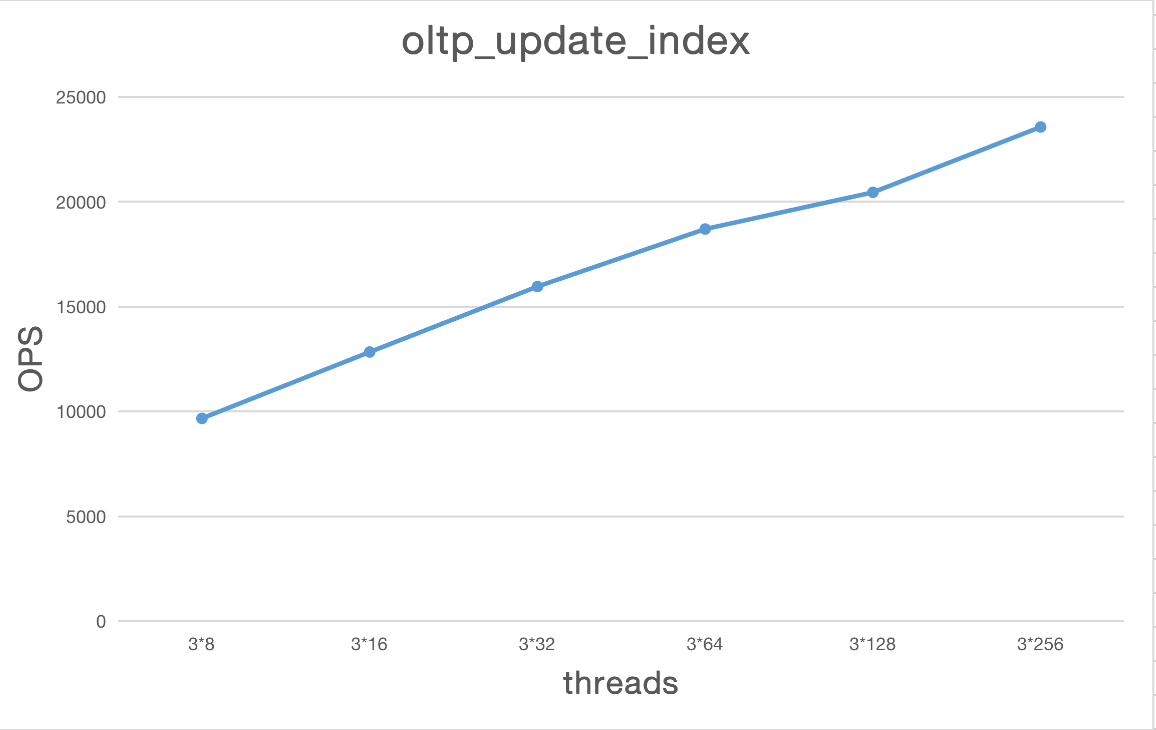
oltp_update_index
| Type | Thread | TPS | QPS | avg.latency(ms) | .95.latency(ms) | max.latency(ms) |
|---|---|---|---|---|---|---|
| oltp_update_index | 3*8 | 9668.98 | 9668.98 | 2.51 | 3.19 | 103.88 |
| oltp_update_index | 3*16 | 12834.99 | 12834.99 | 3.79 | 5.47 | 176.90 |
| oltp_update_index | 3*32 | 15955.77 | 15955.77 | 6.07 | 9.39 | 4787.14 |
| oltp_update_index | 3*64 | 18697.17 | 18697.17 | 10.34 | 17.63 | 4539.04 |
| oltp_update_index | 3*128 | 20446.81 | 20446.81 | 18.98 | 40.37 | 5394.75 |
| oltp_update_index | 3*256 | 23563.03 | 23563.03 | 32.86 | 78.60 | 5530.69 |
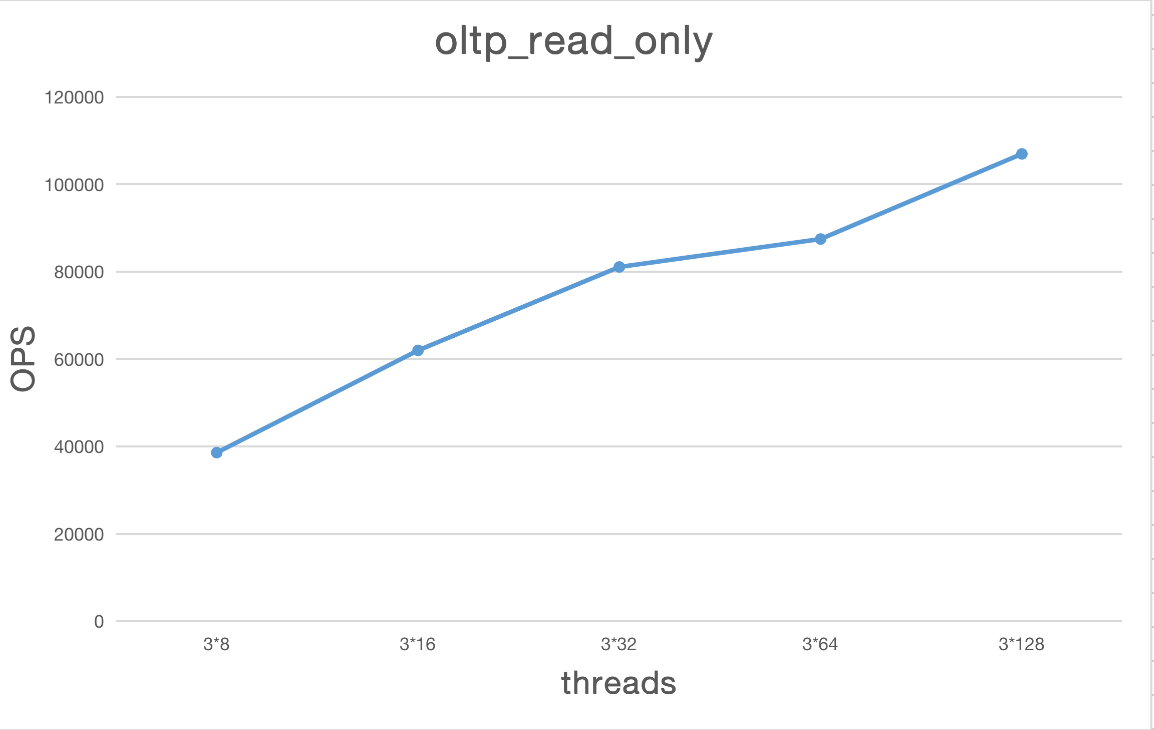
oltp_read_only
| Type | Thread | TPS | QPS | avg.latency(ms) | .95.latency(ms) | max.latency(ms) |
|---|---|---|---|---|---|---|
| oltp_read_only | 3*8 | 2411.00 | 38575.96 | 9.92 | 20.00 | 92.23 |
| oltp_read_only | 3*16 | 3873.53 | 61976.50 | 12.25 | 16.12 | 56.94 |
| oltp_read_only | 3*32 | 5066.88 | 81070.16 | 19.42 | 26.20 | 123.41 |
| oltp_read_only | 3*64 | 5466.36 | 87461.81 | 34.65 | 63.20 | 231.19 |
| oltp_read_only | 3*128 | 6684.16 | 106946.59 | 57.29 | 97.55 | 180.85 |
Common issues
TiDB and TiKV are both properly configured under high concurrency, why is the overall performance still low?
This issue often has things to do with the use of a proxy. You can add pressure on single TiDB server, sum each result up and compare the summed result with the result with proxy.
Take HAproxy as an example. The parameter nbproc can increase the number of processes it can start at most. Later versions of HAproxy also support nbthread and cpu-map. All of these can mitigate the negative impact of proxy use on performance.
Under high concurrency, why is the CPU utilization rate of TiKV still low?
Although the overall CPU utilization rate is low for TiKV, the CPU utilization rate of some modules in the cluster might be high.
The maximum concurrency limits for other modules on TiKV, such as storage readpool, coprocessor, and gRPC, can be adjusted through the TiKV configuration file.
The actual CPU usage can be observed through Grafana's TiKV Thread CPU monitor panel. If there is a bottleneck on the modules, it can be adjusted by increasing the concurrency of the modules.
Given that TiKV has not yet reached the CPU usage bottleneck under high concurrency, why is TiDB's CPU utilization rate still low?
CPU of NUMA architecture is used on some high-end equipment where cross-CPU access to remote memory will greatly reduce performance. By default, TiDB will use all CPUs of the server, and goroutine scheduling will inevitably lead to cross-CPU memory access.
Therefore, it is recommended to deploy n TiDBs (n is the number of NUMA CPUs) on the server of NUMA architecture, and meanwhile set the TiDB parameter max-procs to a value that is the same as the number of NUMA CPU cores.